


vk.com/id446425943
 Electricity
Electricity generation*
|
|
|
|
|
|
|
|
|
|
|
|
Growth rate per annum |
Share |
|
|
|
|
|
|
|
|
|
|
|
|
|
|
|
|
Terawatt-hours |
2008 |
2009 |
2010 |
2011 |
2012 |
2013 |
2014 |
2015 |
2016 |
2017 |
2018 |
2018 |
2007-17 |
2018 |
Canada |
638.4 |
614.0 |
606.9 |
638.3 |
636.5 |
662.5 |
660.5 |
663.7 |
663.9 |
662.7 |
654.4 |
-1.3% |
0.4% |
2.5% |
Mexico |
269.3 |
267.8 |
275.6 |
292.1 |
296.4 |
297.1 |
303.3 |
310.3 |
320.3 |
329.1 |
332.1 |
0.9% |
2.3% |
1.2% |
US |
4390.1 |
4206.5 |
4394.3 |
4363.4 |
4310.6 |
4330.3 |
4363.3 |
4348.7 |
4347.9 |
4302.5 |
4460.8 |
3.7% |
-0.3% |
16.8% |
Total North America |
5297.8 |
5088.3 |
5276.7 |
5293.8 |
5243.5 |
5289.9 |
5327.1 |
5322.7 |
5332.1 |
5294.4 |
5447.3 |
2.9% |
-0.1% |
20.5% |
Argentina |
121.9 |
122.3 |
126.0 |
129.5 |
136.0 |
139.4 |
138.6 |
145.4 |
147.2 |
145.6 |
146.6 |
0.7% |
2.5% |
0.6% |
Brazil |
462.9 |
466.2 |
515.8 |
531.8 |
552.5 |
570.8 |
590.5 |
581.2 |
578.9 |
588.0 |
588.0 |
|
2.8% |
2.2% |
Chile |
59.7 |
59.7 |
61.3 |
65.2 |
69.7 |
73.0 |
71.6 |
74.5 |
77.7 |
78.6 |
80.2 |
2.0% |
3.0% |
0.3% |
Colombia |
61.4 |
63.2 |
64.7 |
66.2 |
67.7 |
69.8 |
72.7 |
75.0 |
74.4 |
75.1 |
77.4 |
3.0% |
2.2% |
0.3% |
Ecuador |
18.6 |
18.3 |
19.5 |
20.5 |
22.8 |
23.3 |
24.3 |
26.0 |
27.3 |
28.0 |
29.4 |
4.8% |
4.9% |
0.1% |
Peru |
32.5 |
32.9 |
35.9 |
38.8 |
41.0 |
43.3 |
45.5 |
48.3 |
51.7 |
52.7 |
54.0 |
2.5% |
5.8% |
0.2% |
Trinidad & Tobago |
7.7 |
7.8 |
8.5 |
8.8 |
9.1 |
9.5 |
9.9 |
10.3 |
10.7 |
10.2 |
10.3 |
1.2% |
2.9% |
|
Venezuela |
119.3 |
124.8 |
116.7 |
122.9 |
127.9 |
130.0 |
128.3 |
123.8 |
113.8 |
117.3 |
99.2 |
-15.4% |
0.3% |
0.4% |
Other S. & Cent. America |
186.7 |
186.7 |
191.0 |
196.4 |
203.6 |
207.5 |
205.0 |
211.4 |
222.9 |
216.1 |
220.1 |
1.8% |
1.5% |
0.8% |
Total S. & Cent. America |
1070.7 |
1082.0 |
1139.5 |
1180.1 |
1230.4 |
1266.7 |
1286.5 |
1295.9 |
1304.8 |
1311.6 |
1305.3 |
-0.5% |
2.4% |
4.9% |
Austria |
66.9 |
69.1 |
71.1 |
65.9 |
72.4 |
68.0 |
65.1 |
64.9 |
67.9 |
70.8 |
68.2 |
-3.7% |
0.9% |
0.3% |
Belgium |
84.9 |
91.2 |
95.2 |
90.2 |
82.9 |
83.5 |
72.7 |
69.8 |
85.7 |
86.5 |
74.6 |
-13.7% |
-0.3% |
0.3% |
Czech Republic |
83.5 |
82.3 |
85.9 |
87.6 |
87.6 |
87.1 |
86.0 |
83.9 |
83.3 |
87.0 |
88.0 |
1.1% |
-0.1% |
0.3% |
Finland |
77.8 |
72.5 |
81.1 |
73.7 |
70.5 |
71.4 |
68.2 |
68.8 |
68.8 |
67.1 |
69.6 |
3.7% |
-1.9% |
0.3% |
France |
573.8 |
535.9 |
569.3 |
565.0 |
564.5 |
573.8 |
564.2 |
570.3 |
556.2 |
554.1 |
574.2 |
3.6% |
-0.3% |
2.2% |
Germany |
640.7 |
595.6 |
633.1 |
613.1 |
630.1 |
638.7 |
627.8 |
648.1 |
650.7 |
653.7 |
648.7 |
-0.8% |
0.2% |
2.4% |
Greece |
63.7 |
61.4 |
57.4 |
59.4 |
61.0 |
57.2 |
50.5 |
51.9 |
54.4 |
55.3 |
54.2 |
-2.0% |
-1.4% |
0.2% |
Hungary |
40.0 |
35.9 |
37.4 |
36.0 |
34.6 |
30.3 |
29.4 |
30.4 |
31.9 |
32.9 |
32.0 |
-2.7% |
-1.9% |
0.1% |
Italy |
319.1 |
292.6 |
302.1 |
302.6 |
299.3 |
289.8 |
279.8 |
283.0 |
289.8 |
295.8 |
290.6 |
-1.8% |
-0.6% |
1.1% |
Netherlands |
108.2 |
113.5 |
118.1 |
113.0 |
102.5 |
100.9 |
103.4 |
110.1 |
115.2 |
117.3 |
117.5 |
0.2% |
1.1% |
0.4% |
Norway |
142.1 |
131.8 |
123.6 |
127.6 |
147.7 |
134.0 |
142.0 |
144.5 |
149.0 |
149.4 |
147.0 |
-1.6% |
0.9% |
0.6% |
Poland |
155.3 |
151.7 |
157.7 |
163.5 |
162.1 |
164.6 |
159.1 |
164.9 |
166.6 |
170.5 |
170.1 |
-0.2% |
0.7% |
0.6% |
Portugal |
46.0 |
50.2 |
54.1 |
52.5 |
46.6 |
51.7 |
52.8 |
52.4 |
60.3 |
59.4 |
59.9 |
0.8% |
2.3% |
0.2% |
Romania |
65.0 |
58.0 |
61.0 |
62.2 |
59.0 |
58.9 |
63.3 |
66.3 |
65.1 |
64.3 |
65.2 |
1.4% |
0.4% |
0.2% |
Spain |
313.8 |
296.3 |
300.4 |
291.8 |
297.6 |
285.3 |
278.8 |
281.0 |
274.6 |
275.6 |
275.0 |
-0.2% |
-1.0% |
1.0% |
Sweden |
149.7 |
136.7 |
148.3 |
151.2 |
166.3 |
153.2 |
153.7 |
162.1 |
156.1 |
164.3 |
163.5 |
-0.4% |
1.0% |
0.6% |
Switzerland |
68.7 |
68.3 |
68.0 |
64.8 |
70.0 |
70.4 |
72.0 |
67.9 |
63.3 |
63.3 |
69.8 |
10.3% |
-0.7% |
0.3% |
Turkey |
198.4 |
194.8 |
211.2 |
229.4 |
239.5 |
240.2 |
252.0 |
261.8 |
274.4 |
297.3 |
302.5 |
1.8% |
4.5% |
1.1% |
Ukraine |
192.6 |
173.6 |
188.8 |
194.9 |
198.9 |
194.4 |
182.8 |
163.7 |
164.6 |
155.4 |
159.4 |
2.5% |
-2.3% |
0.6% |
United Kingdom |
388.9 |
376.8 |
382.1 |
368.0 |
363.9 |
358.3 |
338.1 |
338.9 |
339.3 |
338.6 |
333.9 |
-1.4% |
-1.6% |
1.3% |
Other Europe |
309.3 |
306.4 |
320.0 |
307.1 |
295.3 |
309.0 |
297.0 |
298.1 |
305.7 |
303.3 |
313.4 |
3.3% |
0.2% |
1.2% |
Total Europe |
4088.5 |
3894.7 |
4065.7 |
4019.4 |
4052.3 |
4020.4 |
3938.4 |
3982.8 |
4023.0 |
4061.8 |
4077.3 |
0.4% |
|
15.3% |
|
|
|
|
|
|
|
|
|
|
|
|
|
|
|
Azerbaijan |
21.6 |
18.9 |
18.7 |
20.3 |
23.0 |
23.4 |
24.7 |
24.7 |
25.0 |
24.3 |
25.2 |
3.6% |
1.1% |
0.1% |
Belarus |
35.1 |
30.4 |
34.9 |
32.2 |
30.8 |
31.5 |
34.7 |
34.2 |
33.6 |
34.5 |
38.8 |
12.4% |
0.8% |
0.1% |
Kazakhstan |
80.3 |
78.7 |
82.6 |
86.6 |
90.6 |
92.6 |
94.6 |
91.6 |
94.6 |
103.1 |
107.1 |
3.8% |
3.0% |
0.4% |
Russian Federation |
1040.0 |
993.1 |
1038.0 |
1054.9 |
1069.3 |
1059.1 |
1064.2 |
1067.5 |
1091.0 |
1089.6 |
1110.8 |
1.9% |
0.7% |
4.2% |
Turkmenistan |
15.0 |
16.0 |
16.7 |
17.2 |
17.8 |
18.9 |
20.1 |
21.5 |
22.6 |
22.8 |
24.2 |
6.1% |
4.4% |
0.1% |
Uzbekistan |
50.2 |
50.1 |
51.9 |
52.8 |
53.0 |
54.9 |
55.4 |
57.3 |
58.3 |
60.3 |
62.4 |
3.6% |
2.1% |
0.2% |
Other CIS |
39.7 |
39.1 |
41.1 |
44.6 |
46.0 |
43.3 |
44.1 |
44.0 |
43.5 |
47.1 |
48.9 |
3.9% |
0.6% |
0.2% |
Total CIS |
1282.0 |
1226.2 |
1284.0 |
1308.5 |
1330.4 |
1323.7 |
1337.9 |
1340.9 |
1368.5 |
1381.7 |
1417.4 |
2.6% |
0.9% |
5.3% |
Iran |
210.5 |
221.8 |
235.7 |
235.6 |
248.8 |
258.9 |
275.6 |
280.2 |
286.1 |
305.2 |
310.8 |
1.8% |
4.2% |
1.2% |
Iraq |
35.3 |
41.3 |
41.7 |
42.2 |
47.8 |
62.1 |
71.2 |
75.3 |
86.3 |
93.3 |
103.3 |
10.8% |
11.2% |
0.4% |
Israel |
55.8 |
55.3 |
58.5 |
59.3 |
63.0 |
61.4 |
61.3 |
64.3 |
67.3 |
67.7 |
69.6 |
2.9% |
2.1% |
0.3% |
Kuwait |
51.7 |
53.2 |
57.1 |
57.5 |
62.7 |
61.0 |
65.1 |
68.3 |
70.2 |
72.9 |
74.2 |
1.8% |
4.1% |
0.3% |
Oman |
16.0 |
18.4 |
19.8 |
21.9 |
25.0 |
26.2 |
29.1 |
32.8 |
34.2 |
36.1 |
37.3 |
3.2% |
9.6% |
0.1% |
Qatar |
21.6 |
24.2 |
28.1 |
30.7 |
34.8 |
34.7 |
38.7 |
41.5 |
42.3 |
43.8 |
39.5 |
-10.0% |
8.5% |
0.1% |
Saudi Arabia |
216.4 |
229.2 |
251.4 |
262.2 |
284.7 |
299.3 |
333.7 |
359.7 |
370.4 |
382.1 |
383.8 |
0.4% |
6.5% |
1.4% |
United Arab Emirates |
80.5 |
85.7 |
93.9 |
99.1 |
106.2 |
110.0 |
116.5 |
127.4 |
129.6 |
134.6 |
136.9 |
1.8% |
5.5% |
0.5% |
Other Middle East |
87.1 |
90.7 |
98.7 |
93.4 |
88.3 |
83.7 |
81.8 |
79.3 |
79.2 |
83.7 |
84.9 |
1.4% |
0.3% |
0.3% |
Total Middle East |
775.0 |
819.8 |
885.0 |
901.9 |
961.2 |
997.2 |
1073.2 |
1128.7 |
1165.7 |
1219.3 |
1240.4 |
1.7% |
5.2% |
4.7% |
Algeria |
40.2 |
43.1 |
45.7 |
53.1 |
57.4 |
59.9 |
64.2 |
68.8 |
71.0 |
76.0 |
76.4 |
0.5% |
7.4% |
0.3% |
Egypt |
128.8 |
134.3 |
144.4 |
149.6 |
162.8 |
165.1 |
171.2 |
181.8 |
188.2 |
193.2 |
200.0 |
3.5% |
4.9% |
0.8% |
Morocco |
21.0 |
21.7 |
23.7 |
25.4 |
27.7 |
28.1 |
29.3 |
30.3 |
30.7 |
31.6 |
34.4 |
8.9% |
4.5% |
0.1% |
South Africa |
258.3 |
249.6 |
259.6 |
262.5 |
257.9 |
256.1 |
254.8 |
250.1 |
252.7 |
255.1 |
256.0 |
0.4% |
-0.3% |
1.0% |
Other Africa |
174.6 |
180.8 |
198.2 |
198.6 |
214.9 |
234.3 |
248.3 |
255.7 |
258.5 |
273.7 |
286.9 |
4.8% |
4.9% |
1.1% |
Total Africa |
622.9 |
629.4 |
671.7 |
689.1 |
720.7 |
743.5 |
767.8 |
786.8 |
801.2 |
829.6 |
853.7 |
2.9% |
3.1% |
3.2% |
Australia |
245.4 |
249.9 |
251.0 |
256.3 |
250.7 |
249.6 |
247.6 |
254.3 |
258.5 |
259.0 |
261.4 |
0.9% |
0.6% |
1.0% |
Bangladesh |
34.2 |
37.2 |
40.8 |
44.2 |
48.7 |
54.4 |
57.4 |
61.8 |
70.0 |
74.4 |
79.1 |
6.3% |
9.1% |
0.3% |
China |
3495.8 |
3714.7 |
4207.2 |
4713.0 |
4987.6 |
5431.6 |
5649.6 |
5814.6 |
6133.2 |
6604.5 |
7111.8 |
7.7% |
7.2% |
26.7% |
China Hong Kong SAR |
38.0 |
38.7 |
38.4 |
39.1 |
38.8 |
39.2 |
39.9 |
38.0 |
38.3 |
37.1 |
36.7 |
-1.2% |
-0.5% |
0.1% |
India |
828.4 |
879.7 |
937.5 |
1034.0 |
1091.8 |
1146.1 |
1262.2 |
1317.3 |
1401.7 |
1470.3 |
1561.1 |
6.2% |
6.3% |
5.9% |
Indonesia |
149.4 |
156.8 |
169.8 |
183.4 |
200.3 |
216.2 |
228.6 |
234.0 |
247.9 |
254.6 |
267.3 |
5.0% |
6.0% |
1.0% |
Japan |
1183.7 |
1114.0 |
1156.0 |
1104.2 |
1106.9 |
1087.8 |
1062.7 |
1030.1 |
1042.1 |
1050.1 |
1051.6 |
0.1% |
-1.2% |
4.0% |
Malaysia |
106.9 |
111.3 |
120.1 |
120.9 |
127.3 |
137.5 |
143.2 |
147.2 |
158.8 |
162.3 |
168.4 |
3.8% |
4.6% |
0.6% |
New Zealand |
43.8 |
43.4 |
44.9 |
44.4 |
44.2 |
43.3 |
43.5 |
44.2 |
43.6 |
44.2 |
44.3 |
0.2% |
0.1% |
0.2% |
Pakistan |
96.2 |
97.1 |
100.0 |
99.9 |
99.0 |
102.2 |
107.3 |
110.5 |
122.9 |
126.6 |
140.6 |
11.1% |
2.6% |
0.5% |
Philippines |
60.8 |
61.9 |
67.7 |
69.2 |
72.9 |
75.3 |
77.3 |
82.4 |
90.8 |
94.4 |
99.8 |
5.7% |
4.7% |
0.4% |
Singapore |
41.7 |
41.8 |
45.4 |
46.0 |
46.9 |
48.0 |
49.3 |
50.3 |
51.6 |
52.2 |
52.9 |
1.3% |
2.4% |
0.2% |
South Korea |
442.6 |
452.4 |
495.0 |
517.6 |
531.2 |
537.2 |
540.4 |
547.8 |
561.0 |
576.4 |
594.3 |
3.1% |
3.1% |
2.2% |
Sri Lanka |
10.0 |
10.0 |
10.8 |
11.6 |
11.9 |
12.0 |
12.9 |
13.2 |
14.4 |
14.9 |
15.5 |
4.0% |
4.2% |
0.1% |
Taiwan |
238.3 |
230.0 |
247.1 |
252.2 |
250.4 |
252.4 |
260.0 |
258.2 |
264.1 |
270.3 |
273.6 |
1.2% |
1.1% |
1.0% |
Thailand |
145.4 |
145.9 |
157.6 |
153.3 |
169.0 |
168.6 |
173.8 |
177.8 |
179.8 |
176.7 |
177.6 |
0.5% |
2.2% |
0.7% |
Vietnam |
71.0 |
80.6 |
91.7 |
101.5 |
115.1 |
124.5 |
141.3 |
157.9 |
175.7 |
192.5 |
212.9 |
10.6% |
11.6% |
0.8% |
Other Asia Pacific |
64.7 |
63.5 |
70.8 |
75.0 |
76.5 |
82.8 |
86.8 |
89.5 |
107.3 |
117.7 |
124.7 |
6.0% |
6.7% |
0.5% |
Total Asia Pacific |
7296.4 |
7529.0 |
8251.7 |
8865.8 |
9269.3 |
9808.4 |
10183.7 |
10429.1 |
10961.7 |
11578.2 |
12273.6 |
6.0% |
5.2% |
46.1% |
Total World |
20433.3 |
20269.3 |
21574.3 |
22258.7 |
22807.8 |
23449.8 |
23914.6 |
24286.9 |
24956.9 |
25676.6 |
26614.8 |
3.7% |
2.5% |
100.0% |
of which: OECD |
10999.0 |
10561.9 |
10992.3 |
10942.8 |
10950.2 |
10946.2 |
10891.4 |
10929.8 |
11013.7 |
11057.2 |
11233.6 |
1.6% |
0.1% |
42.2% |
Non-OECD |
9434.3 |
9707.4 |
10582.0 |
11315.9 |
11857.6 |
12503.6 |
13023.2 |
13357.1 |
13943.2 |
14619.4 |
15381.2 |
5.2% |
4.9% |
57.8% |
European Union |
3388.7 |
3224.4 |
3364.7 |
3299.2 |
3295.4 |
3269.6 |
3188.5 |
3236.7 |
3259.5 |
3290.4 |
3282.2 |
-0.2% |
-0.3% |
12.3% |
*Based on gross output. Less than 0.05%.
54 |
BP Statistical Review of World Energy 2019 |
vk.com/id446425943
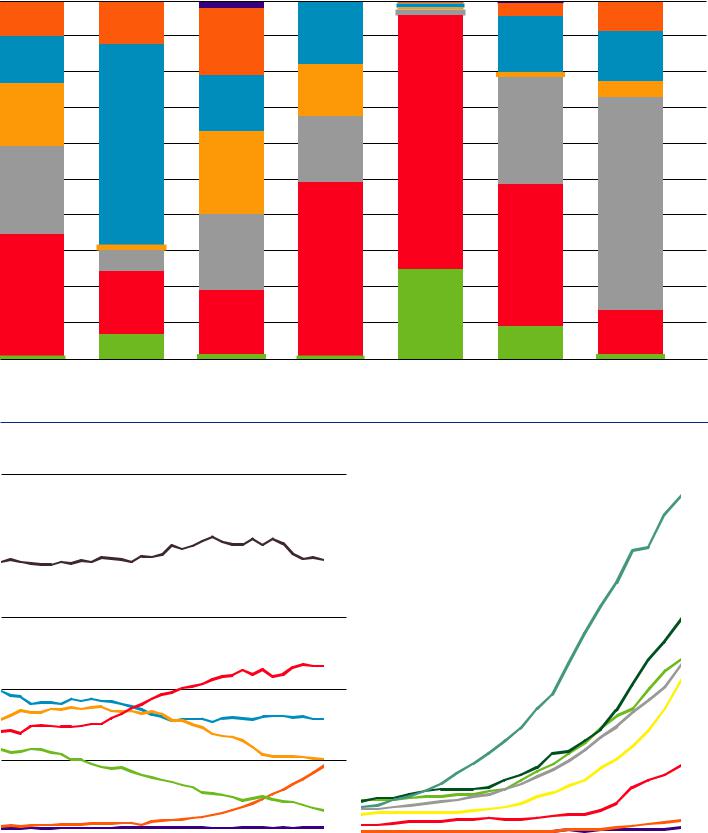
Regional electricity generation by fuel 2018
Percentage
|
Oil |
|
Nuclear |
|
Other (includes sources not specified elsewhere |
|
|
|
|||
|
|
|
|||
|
Natural gas |
|
Hydroelectricity |
|
e.g. pumped hydro, non-renewable waste and |
|
|
||||
|
|
||||
|
Coal |
|
Renewables |
|
statistical differences) |
|
|
||||
|
|
|
|
|
|
|
|
|
100 |
|
|
|
|
|
|
|
90 |
|
|
|
|
|
|
|
80 |
|
|
|
|
|
|
|
70 |
|
|
|
|
|
|
|
60 |
|
|
|
|
|
|
|
50 |
|
|
|
|
|
|
|
40 |
|
|
|
|
|
|
|
30 |
|
|
|
|
|
|
|
20 |
|
|
|
|
|
|
|
10 |
North America |
S. & Cent. America |
Europe |
CIS |
Middle East |
Africa |
Asia Pacific |
0 |
Natural gas is the dominant fuel for power generation in North America followed by coal. In South & Central America, hydro accounts for more than half of power generation. In Europe nuclear, coal, renewables and gas all have a prominent role. In CIS and the Middle East, natural gas is by far the most important fuel for power generation. In Africa, natural gas and coal account for almost 70% of the electricity generated. Coal remains the most important fuel in Asia Pacific.
Share of global electricity generation by fuel
Percentage
|
Oil |
|
Hydroelectricity |
|
Other |
50 |
|
|
|
||||
|
Coal |
|
Nuclear energy |
|
|
|
|
|
|
|
|
||
|
|
|
|
|
||
|
Natural gas |
|
Renewables |
|
|
|
|
|
|
|
|
||
|
|
|
|
|
|
|
|
|
|
|
|
|
40 |
30
20
10
Renewables share of power generation by region
Percentage
|
|
World |
20 |
|
|
|
|||
|
|
|
||
|
|
Asia Pacific |
|
|
|
|
|||
|
|
|||
|
|
Africa |
|
|
|
|
|||
18 |
||||
|
||||
|
|
Middle East |
||
|
|
|||
|
|
|
||
|
|
CIS |
|
|
|
|
|
||
|
|
Europe |
|
|
|
|
|
||
16 |
||||
|
|
S. & Cent. America |
||
|
|
|
||
|
|
North America |
|
|
|
|
|
||
|
|
|
|
|
|
|
|
14 |
|
|
|
|
|
|
|
|
|
12 |
|
|
|
|
|
|
|
|
|
10 |
|
|
|
|
|
|
|
|
|
8 |
|
|
|
|
|
|
|
|
|
6 |
|
|
|
|
|
|
|
|
|
4 |
|
|
|
|
|
|
|
|
|
|
|
|
|
|
|
|
|
|
|
|
|
|
2 |
|
|
|
|
|
|
|
|
|
|
|
|
|
|
|
|
|
|
|
|
|
|
|
86 |
90 |
94 |
98 |
02 |
06 |
10 |
14 |
18 |
0 |
98 |
00 |
02 |
04 |
06 |
08 |
10 |
12 |
14 |
16 |
18 |
0 |
|
At the global level, coal is the dominant fuel for power generation, accounting for 38%, the same share as 20 years ago. Gas is the second most used fuel with a share of 23.2%, higher than in 1998. The share of oil and nuclear has declined substantially over the same period. The share of renewables is 9.3%, up from only 3% 10 years ago. Regionally, there is significant variation in the penetration of renewables: Europe has the highest penetration at 18.7%, followed by South & Central America at 12%.
BP Statistical Review of World Energy 2019 |
55 |

vk.com/id446425943
Electricity generation by fuel*
|
|
|
|
|
2017 |
|
|
|
|
|
|
|
|
|
|
2018 |
|
|
|
|
|
|
|
|
|
Natural |
|
Nuclear |
|
Hydro |
Renew- |
|
|
|
|
|
Natural |
|
Nuclear |
|
Hydro |
Renew- |
|
|
|
||
Terawatt-hours |
Oil |
Gas |
Coal |
energy |
electric |
ables |
Other‡ |
Total |
|
Oil |
Gas |
Coal |
energy |
electric |
ables |
Other‡ |
Total |
||||||
Canada |
3.2 |
59.6 |
60.1 |
100.4 |
396.5 |
42.1 |
0.8 |
662.7 |
|
3.2 |
58.7 |
59.3 |
100.0 |
387.3 |
45.3 |
0.6 |
654.4 |
||||||
Mexico |
38.9 |
196.3 |
30.9 |
10.9 |
31.8 |
19.1 |
1.1 |
329.1 |
|
36.8 |
196.7 |
29.2 |
13.6 |
32.4 |
21.4 |
2.2 |
332.1 |
||||||
US |
23.0 |
1394.0 |
1310.0 |
847.3 |
296.8 |
417.8 |
13.7 |
4302.5 |
|
26.4 |
1578.5 |
1245.8 |
849.6 |
288.7 |
458.5 |
13.3 |
4460.8 |
||||||
Total North America |
65.1 |
1649.9 |
1401.0 |
958.6 |
725.2 |
479.0 |
15.6 |
5294.4 |
66.3 |
1833.9 |
1334.3 |
963.2 |
708.4 |
525.2 |
16.0 |
5447.3 |
|||||||
Argentina |
11.6 |
80.8 |
2.0 |
6.1 |
41.5 |
3.0 |
0.5 |
145.6 |
6.4 |
85.3 |
2.0 |
6.9 |
41.6 |
3.8 |
0.5 |
146.6 |
|||||||
Brazil |
15.5 |
65.6 |
25.8 |
15.7 |
370.9 |
94.5 |
– |
588.0 |
11.5 |
46.8 |
21.9 |
15.6 |
387.7 |
104.5 |
– |
588.0 |
|||||||
Other S. & C. America |
80.4 |
98.0 |
49.7 |
|
– |
308.0 |
41.9 |
0.1 |
578.0 |
72.2 |
95.8 |
52.6 |
|
– |
302.0 |
48.0 |
† |
570.6 |
|||||
Total S. & C. America |
107.5 |
244.3 |
77.5 |
21.8 |
720.4 |
139.4 |
0.6 |
1311.6 |
90.2 |
227.9 |
76.5 |
22.5 |
731.3 |
156.3 |
0.5 |
1305.3 |
|||||||
Germany |
5.6 |
86.7 |
241.9 |
76.3 |
20.2 |
196.2 |
26.7 |
653.7 |
5.2 |
83.0 |
229.0 |
76.1 |
16.9 |
209.2 |
29.3 |
648.7 |
|||||||
Italy |
11.5 |
140.3 |
35.1 |
|
– |
34.4 |
67.7 |
6.8 |
295.8 |
10.9 |
127.2 |
36.6 |
|
– |
45.9 |
66.0 |
4.1 |
290.6 |
|||||
Netherlands |
1.2 |
57.9 |
31.3 |
3.4 |
0.1 |
17.4 |
6.1 |
117.3 |
0.6 |
57.3 |
30.0 |
3.5 |
0.1 |
18.6 |
7.4 |
117.5 |
|||||||
Poland |
2.0 |
10.0 |
133.8 |
|
– |
2.6 |
21.6 |
0.5 |
170.5 |
1.2 |
12.4 |
134.7 |
|
– |
2.0 |
19.5 |
0.4 |
170.1 |
|||||
Spain |
15.8 |
64.0 |
46.3 |
58.1 |
18.8 |
69.5 |
3.1 |
275.6 |
15.6 |
57.2 |
38.4 |
55.6 |
35.2 |
70.7 |
2.3 |
275.0 |
|||||||
Turkey |
1.2 |
110.5 |
97.5 |
|
– |
58.2 |
29.0 |
0.8 |
297.3 |
0.6 |
92.2 |
111.7 |
|
– |
59.5 |
37.7 |
0.8 |
302.5 |
|||||
Ukraine |
1.4 |
9.1 |
46.7 |
85.6 |
8.7 |
1.9 |
1.9 |
155.4 |
0.5 |
12.1 |
47.7 |
84.4 |
9.9 |
2.6 |
2.2 |
159.4 |
|||||||
United Kingdom |
1.6 |
136.8 |
22.5 |
70.3 |
5.9 |
93.4 |
8.0 |
338.6 |
1.7 |
131.5 |
16.8 |
65.1 |
5.5 |
105.6 |
7.8 |
333.9 |
|||||||
Other Europe |
21.6 |
172.0 |
233.3 |
642.4 |
436.1 |
220.4 |
31.9 |
1757.6 |
19.8 |
158.5 |
217.8 |
652.8 |
467.2 |
231.1 |
32.3 |
1779.5 |
|||||||
Total Europe |
61.9 |
787.5 |
888.5 |
936.1 |
584.9 |
717.1 |
85.8 |
4061.8 |
56.0 |
731.3 |
862.7 |
937.5 |
642.1 |
761.1 |
86.6 |
4077.3 |
|||||||
Kazakhstan |
1.9 |
19.8 |
69.9 |
|
– |
11.2 |
0.4 |
– |
103.1 |
1.7 |
24.2 |
70.2 |
|
– |
10.3 |
0.7 |
– |
107.1 |
|||||
Russian Federation |
10.7 |
515.9 |
168.9 |
203.1 |
185.3 |
1.1 |
4.4 |
1089.6 |
11.4 |
521.5 |
177.5 |
204.5 |
190.2 |
1.3 |
4.4 |
1110.8 |
|||||||
Other CIS |
1.8 |
127.5 |
12.7 |
2.6 |
43.6 |
0.5 |
0.3 |
189.0 |
0.5 |
140.4 |
11.3 |
2.1 |
44.3 |
0.6 |
0.3 |
199.5 |
|||||||
Total CIS |
14.4 |
663.2 |
251.4 |
205.8 |
240.1 |
2.0 |
4.7 |
1381.7 |
13.7 |
686.1 |
259.0 |
206.6 |
244.8 |
2.5 |
4.7 |
1417.4 |
|||||||
Iran |
28.9 |
251.2 |
0.5 |
7.1 |
17.2 |
0.3 |
– |
305.2 |
|
23.0 |
269.1 |
0.5 |
7.0 |
10.8 |
0.4 |
– |
310.8 |
||||||
Saudi Arabia |
156.9 |
225.1 |
– |
|
– |
|
– |
0.1 |
– |
382.1 |
|
150.6 |
233.0 |
– |
|
– |
|
– |
0.2 |
– |
383.8 |
||
United Arab Emirates |
1.6 |
132.4 |
– |
|
– |
|
– |
0.5 |
– |
134.6 |
1.6 |
134.4 |
– |
|
– |
|
– |
1.0 |
– |
136.9 |
|||
Other Middle East |
134.8 |
232.3 |
22.3 |
|
– |
3.6 |
4.5 |
† |
397.5 |
135.7 |
241.9 |
20.8 |
|
– |
4.4 |
5.9 |
0.1 |
408.9 |
|||||
Total Middle East |
322.1 |
841.0 |
22.8 |
7.1 |
20.8 |
5.5 |
† |
1219.3 |
310.9 |
878.5 |
21.3 |
7.0 |
15.2 |
7.4 |
0.1 |
1240.4 |
|||||||
Egypt |
27.7 |
149.4 |
– |
|
– |
13.4 |
2.7 |
– |
193.2 |
22.1 |
160.9 |
– |
|
– |
13.5 |
3.5 |
– |
200.0 |
|||||
South Africa |
0.1 |
1.9 |
221.4 |
15.8 |
0.9 |
10.6 |
4.5 |
255.1 |
0.1 |
1.9 |
225.0 |
11.1 |
0.9 |
12.4 |
4.7 |
256.0 |
|||||||
Other Africa |
56.0 |
173.6 |
27.4 |
|
– |
110.3 |
13.6 |
0.4 |
381.3 |
55.3 |
176.6 |
31.0 |
|
– |
118.4 |
16.0 |
0.4 |
397.7 |
|||||
Total Africa |
83.8 |
324.9 |
248.8 |
15.8 |
124.6 |
26.9 |
4.9 |
829.6 |
77.6 |
339.3 |
255.9 |
11.1 |
132.8 |
31.9 |
5.1 |
853.7 |
|||||||
Australia |
5.3 |
55.2 |
159.1 |
|
– |
13.5 |
25.7 |
0.2 |
259.0 |
5.3 |
50.2 |
156.6 |
|
– |
17.3 |
31.9 |
0.2 |
261.4 |
|||||
China |
10.7 |
202.8 |
4445.5 |
248.1 |
1165.1 |
492.4 |
39.8 |
6604.5 |
10.7 |
223.6 |
4732.4 |
294.4 |
1202.4 |
634.2 |
14.0 |
7111.8 |
|||||||
India |
10.1 |
73.5 |
1117.6 |
37.4 |
135.7 |
95.8 |
0.3 |
1470.3 |
10.1 |
74.3 |
1176.3 |
39.1 |
139.7 |
121.5 |
0.2 |
1561.1 |
|||||||
Indonesia |
18.9 |
55.7 |
148.0 |
|
– |
18.6 |
13.4 |
– |
254.6 |
20.2 |
59.6 |
156.4 |
|
– |
16.4 |
14.8 |
– |
267.3 |
|||||
Japan |
65.7 |
401.5 |
361.8 |
29.1 |
79.2 |
98.8 |
14.0 |
1050.1 |
60.0 |
386.9 |
347.2 |
49.1 |
81.0 |
112.1 |
15.3 |
1051.6 |
|||||||
Malaysia |
5.0 |
65.1 |
67.7 |
|
– |
23.1 |
1.3 |
† |
162.3 |
2.3 |
66.4 |
74.1 |
|
– |
24.2 |
1.5 |
† |
168.4 |
|||||
South Korea |
13.1 |
128.0 |
261.7 |
148.4 |
2.8 |
17.6 |
4.8 |
576.4 |
9.1 |
160.4 |
261.3 |
133.5 |
2.9 |
21.9 |
5.1 |
594.3 |
|||||||
Taiwan |
12.8 |
93.4 |
125.9 |
22.4 |
5.4 |
5.3 |
5.0 |
270.3 |
8.4 |
94.8 |
126.6 |
27.7 |
4.5 |
6.4 |
5.2 |
273.6 |
|||||||
Thailand |
0.3 |
121.0 |
35.7 |
|
– |
4.7 |
14.9 |
– |
176.7 |
0.2 |
116.3 |
35.8 |
|
– |
7.6 |
17.8 |
– |
177.6 |
|||||
Vietnam |
0.7 |
44.4 |
76.1 |
|
– |
70.9 |
0.3 |
– |
192.5 |
0.7 |
44.3 |
86.7 |
|
– |
80.7 |
0.5 |
– |
212.9 |
|||||
Other Asia Pacific |
72.4 |
201.6 |
116.9 |
8.4 |
130.4 |
31.1 |
0.8 |
561.5 |
61.0 |
209.0 |
137.5 |
9.9 |
141.9 |
33.4 |
0.9 |
593.6 |
|||||||
Total Asia Pacific |
215.1 |
1442.1 |
6916.2 |
493.8 |
1649.4 |
796.6 |
65.0 |
11578.2 |
188.0 |
1485.8 |
7290.8 |
553.6 |
1718.5 |
996.0 |
40.9 |
12273.6 |
|||||||
Total World |
870.0 |
5952.8 |
9806.2 |
2639.0 |
4065.4 |
2166.5 |
176.7 |
25676.6 |
802.8 |
6182.8 |
10100.5 |
2701.4 |
4193.1 |
2480.4 |
153.8 |
26614.8 |
|||||||
of which: OECD |
202.9 |
3053.8 |
2989.8 |
1959.6 |
1390.4 |
1344.8 |
115.8 |
11057.2 |
188.2 |
3194.0 |
2881.1 |
1971.4 |
1419.8 |
1460.3 |
118.9 |
11233.6 |
|||||||
Non-OECD |
667.1 |
2899.0 |
6816.3 |
679.4 |
2675.1 |
821.7 |
60.9 |
14619.4 |
|
614.6 |
2988.8 |
7219.4 |
730.1 |
2773.3 |
1020.1 |
34.9 |
15381.2 |
||||||
EU |
56.9 |
660.6 |
694.8 |
830.0 |
298.0 |
673.5 |
76.6 |
3290.4 |
|
52.5 |
619.7 |
655.2 |
827.4 |
344.8 |
705.5 |
77.1 |
3282.2 |
||||||
*Based on gross output.
‡Includes sources not specified elsewhere e.g. pumped hydro, non-renewable waste and statistical discrepancies. Less† than 0.05.
56 |
BP Statistical Review of World Energy 2019 |