


7
Street geometry
Andrew Cameron, WSP
Chapter aims
•Advise how the requirements of different users can be accommodated in street design.
•Summarise research which shows that increased visibility encourages higher vehicle speeds.
•Describe how street space can be allocated based on pedestrian need, using swept path analysis to ensure that minimum access requirements for vehicles are met.
•Describe the rationale behind using shorter vehicle stopping distances to determine visibility requirements on links and at junctions.
•Recommend that the design of streets should determine vehicle speed.
•Recommend a maximum design speed of 20 mph for residential streets.
7.1Introduction
7.1.1 Several issues need to be considered in order to satisfy the various user requirements detailed in Chapter 6, namely:
•street widths and components;
•junctions;
•features for controlling vehicle speeds;
•forward visibility on links; and
•visibility splays at junctions.
4800 4100 2750
5500
7.2Street dimensions
7.2.1The design of new streets or the improvement of existing ones should take into account the functions of the street, and the type, density and character of the development.
7.2.2Carriageway widths should be appropriate for the particular context and uses of the street. Key factors to take into account include:
•the volume of vehicular traffic and pedestrian activity;
•the traffic composition;
•the demarcation, if any, between carriageway and footway (e.g. kerb, street furniture or trees and planting);
•whether parking is to take place in the carriageway and, if so, its distribution, arrangement, the frequency of occupation, and the likely level of parking enforcement (if any);
•the design speed (recommended to be 20 mph or less in residential areas);
•the curvature of the street (bends require greater width to accommodate the swept path of larger vehicles); and
•any intention to include one-way streets, or short stretches of single lane working in two-way streets.
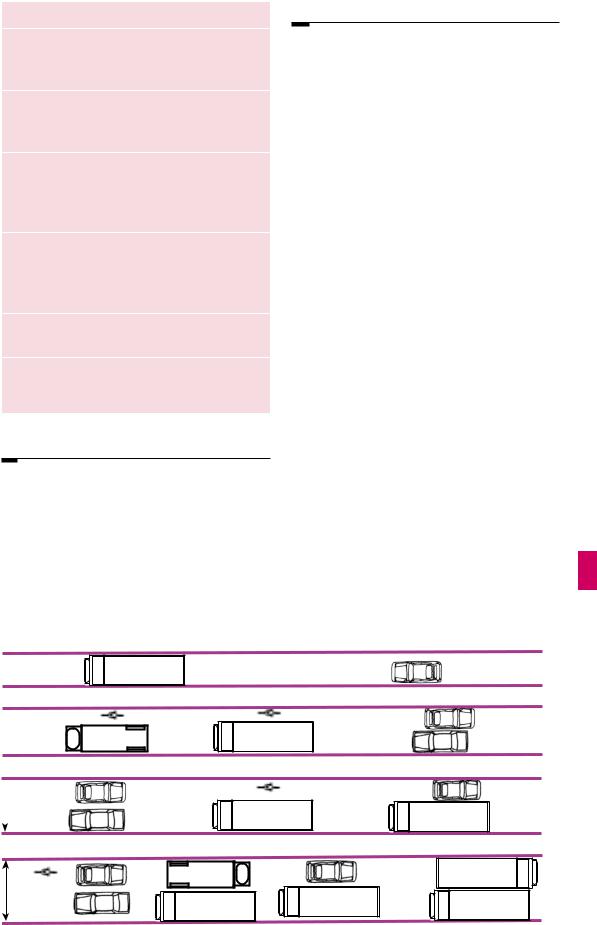
7.2.3In lightly-trafficked streets, carriageways may be narrowed over short lengths to a single lane as a traffic-calming feature. In such single lane working sections of
Figure 7.1 Illustrates what various carriageway widths can accommodate. They are not necessarily recommendations.
Manual for Streets |
79 |
street, to prevent parking, the width between constraining vertical features such as bollards should be no more than 3.5 m. In particular circumstances this may be reduced to a minimum value of 2.75 m, which will still allow for occasional large vehicles (Fig. 7.1). However, widths between 2.75 m and 3.25 m should be avoided in most cases, since they could result in drivers trying to squeeze past cyclists. The local Fire Safety Officer should be consulted where a carriageway width of less than 3.7 m is proposed (see paragraph 6.6.3)
7.2.4 Each street in the network is allocated a particular street character type, depending on where it sits within the place/movement hierarchy (see Chapter 2) and the requirements of its users (see Chapter 6). Individual streets can then be designed in detail using the relevant typical arrangement as a starting point. For example, one street might have a fairly high movement status combined with a medium place status, whilst another might have very little movement status but a high place status. The typical arrangement for each street character type can then be drawn up. This may be best
a |
Local centre |
|
Case study |
|
|
Newhall, Harlow |
|
|
|
||
|
|
|
|
|
|
School |
|
b
c
|
|
|
– 5.5 m |
|
|
|
0.3 m 2 m 2 m 4.8 |
2 m 0.3 m |
|||||
|
|
|
|
|
|
|
11.4 |
– 12.1 m |
|
|
|
||
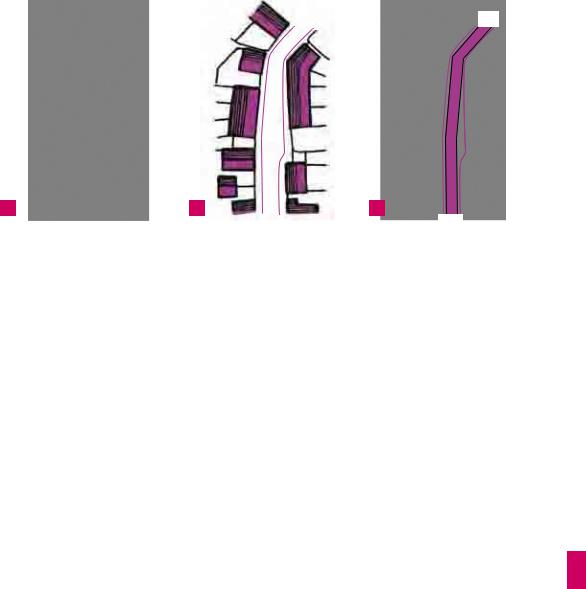
Figure 7.2 Typical representation of a street character type. This example shows the detail for minor side street junctions. Key plan (a) shows the locations,
(b) is a cross-section and (c) the plan.
Una McGaughri, Llewelyn Davies Yeang
Figure 7.3 On-street parking and shallow gradient junction table suitable for accommodating buses.
Newhall demonstrates that adherence to masterplan principles can be achieved through the use of design codes (Fig. 7.3) that are attached to land sales and achieved by covenants.
A list of key dimensions was applied:
•Frontage to frontage – min 10.5 m;
•Carriageway width – min 4.8 m, max 8.8 m;
•Footway width – min 1.5 m;
•Front gardens – min 1.5 m, max 3 m;
•Reservation for services – 1 m; and
•Design speed – 20 mph.
The design is based on pedestrian priority and vehicle speeds of less than 20 mph controlled through the street design.
80 |
Manual for Streets |
a |
b |
c |
Figure 7.4 Left to right: (a) the buildings and urban edge of a street help to form the place; (b) the kerb line can be used to reinforce this; and (c) the remaining carriageway space is tracked for movement and for the provision of places where people may park their vehicles.
represented using a plan and cross-section as illustrated in Figure 7.2.
7.2.5 These street types can be defined in a design code, as demonstrated at Newhall, Harlow (see Newhall, Harlow box).
Swept path analysis
7.2.6Swept path analysis, or tracking, is used to determine the space required for
various vehicles and is a key tool for designing carriageways for vehicular movement within the overall layout of the street. The potential layouts of buildings and spaces do not have to be dictated by carriageway alignment – they should generally be considered first, with the carriageway alignment being designed to fit within the remaining space (Fig. 7.4).
7.2.7The use of computer-aided design (CAD) tracking models and similar techniques often proves to be beneficial in determining how the street will operate and how vehicles will move within it. Layouts designed using this approach enable buildings to be laid out to suit the character of the street, with footways and kerbs helping to define and emphasise spaces. Designers have the freedom to vary the space between kerbs or buildings. The kerb line does not need to follow the line of vehicle tracking if careful attention is given to the combination of sightlines, parking and pedestrian movements.
Shared surface streets and squares
7.2.8In traditional street layouts, footways and carriageways are separated by a kerb. In a street with a shared surface, this demarcation is absent and pedestrians and vehicles share the same surface. Shared surface schemes work best in relatively calm traffic environments. The key aims are to:
• encourage low vehicle speeds;
• create an environment in which pedestrians can walk, or stop and chat, without feeling intimidated by motor traffic;
• make it easier for people to move around; and
• promote social interaction.
7.2.9In the absence of a formal carriageway, the intention is that motorists entering the area will tend to drive more cautiously and negotiate the right of way with pedestrians on a more conciliatory level (Fig. 7.5).
7.2.10However, shared surfaces can cause problems for some disabled people. People with cognitive difficulties may find the environment difficult to interpret. In addition, the absence of a conventional kerb poses problems for blind or partially-sighted people, who often rely on this feature to find their way around. It is therefore important that shared surface schemes include an alternative means for visually-impaired people to navigate by.
Manual for Streets |
81 |

Bob White, Kent County Council
Figure 7.5 A shared surface in a residential area
7.2.11 Research published by the Guide Dogs for the Blind Association in September 2006 illustrated the problems that shared surfaces cause for blind or partially-sighted and other disabled people. Further research to be carried out by the Guide Dogs for the Blind Association will consider how the requirements of disabled people can be met, with a view to producing design guidance in due course.
7.2.12Consultation with the community and users, particularly with disability groups and access officers, is essential when any shared surface scheme is developed. Early indications are that, in many instances, a protected space, with appropriate physical demarcation, will need to be provided, so that those pedestrians who may be unable or unwilling to negotiate priority with vehicles can use the street safely and comfortably.
7.2.13When designing shared surface schemes, careful attention to detail is required to avoid other problems, such as:
•undifferentiated surfaces leading to poor parking behaviour;
•vulnerable road users feeling threatened by having no space protected from vehicles; and
•the positioning and quantity of planting, street furniture and other features creating visual clutter.
7.2.14Subject to making suitable provision for disabled people, shared surface streets are likely to work well:
•in short lengths, or where they form cul-de-sacs (Fig. 7.6);
•where the volume of motor traffic is below 100 vehicles per hour (vph) (peak) (see box); and
•where parking is controlled or it takes place in designated areas.
1The Guide Dogs for the Blind Association (2006)
Shared Surface Street Design Research Project. The Issues: Report of Focus Groups. Reading: The Guide Dogs for the Blind Association
a |
|
b |
Andrew Cameron, WSP |
Duchy of Cornwall and Leon K ier |
Figure 7.6 (a) and (b) A shared-surface square in Poundbury, Dorset.
82 |
Manual for Streets |

2I York, A Bradbury, S Reid, T Ewings and R Paradise (2007) The Manual
for Streets: redefining residential street design.
TRL Report No. 661. Crowthorne: TRL.
3Transport Act 2000. London: TSO.
Tim Pharoah, Llewelyn Davies Yeang |
Franz Otto Novotny, Northmoor Urban Art Project |
Figure 7.7 A shared surface scheme. Beaulieu Park, |
Figure 7.8 Children playing in a Home Zone, |
Chelmsford. |
Northmoor, Manchester. However, this type of |
|
bollard would cause problems for disabled people. |
7.2.15 Shared surface streets are often constructed from paviours rather than asphalt, which helps emphasise their difference from conventional streets. Research for MfS has shown that block paving reduces traffic speeds by between 2.5 and 4.5 mph, compared with speeds on asphalt surfaces (Fig. 7.7).
Home Zones
7.2.16 Home Zones are residential areas designed with streets to be places for people, instead of just for motor traffic. By creating a high-quality street environment, Home Zones strike a better balance between the needs of the local community and drivers (Fig. 7.8). Involving the local community is the key to a successful scheme. Good and effective consultation with all sectors of the community, including young people, can help ensure that the design of individual Home Zones meets the needs of the local residents.
Research on shared space streets
A study of public transport in London Borough Pedestrian Priority Areas (PPAs) undertaken by TRL for the Bus Priority Team at Transport for London concluded that there is a selflimiting factor on pedestrians sharing space with motorists, of around 100 vph. Above this, pedestrians treat the general path taken by motor vehicles as a ‘road’ to be crossed rather than as a space to occupy. The speed
7.2.17Home Zones often include shared surfaces as part of the scheme design and in doing so they too can create difficulties for disabled people. Research commissioned by the Disabled Persons Transport Advisory Committee (DPTAC) on the implications of Home Zones for disabled people, due to be published in 2007, will demonstrate those concerns. Design guidance relating to this research is expected to be published in due course.
7.2.18Home Zones are encouraged in both the planning and transport policies for new developments and existing streets. They are distinguished from other streets by having signed entry and exit points, which indicate the special nature of the street.
7.2.19Local traffic authorities in England and Wales were given the powers to designate roads as Home Zones in section 268 of theTransport Act 2000.2 The legal procedure for creating a
of vehicles also had a strong influence on how pedestrians used the shared area. Although this research project concentrated on PPAs, it is reasonable to assume that these factors are relevant to other shared space schemes.
The relationship between visibility, highway width and driver speed identified on links was also found to apply at junctions. A full description of the research findings is available in Manual for Streets: redefining residential street design.3
Manual for Streets |
83 |
4Statutory Instrument 2006 No. 2082, the Quiet Lanes and home Zones (England) Regulations 2006. London: TSO.
5Department for Transport (2006) Circular 02/2006
– The Quiet Lanes and Home Zones (England) Regulations. London:
TSO.
6Department for Transport (2005) Home Zones: Challenging the future of our streets.London: Department for Transport
7IHIE (2002) Home Zones Design Guidelines.
London: IHIE
Nodal form |
T |
Y |
Cross/ |
Multi |
Square |
Circus |
Crescent |
||||
staggered |
armed |
||||||||||
|
|
|
|
|
|
|
|
|
|||
Regular |
|
|
|
|
|
|
|
|
|
||
|
|
|
|
|
|
|
|
|
|||
|
|
|
|
|
|
|
|
|
|||
|
|
|
|
|
|
|
|
|
|
|
|
|
|
|
|
|
|
|
|
|
|
|
|
|
|
|
|
|
|
|
|
|
|
|
|
|
|
|
|
|
|
|
|
|
|
|
|
|
|
|
|
|
|
|
|
|
|
|
|
|
|
|
|
|
|
|
|
|
|
|
|
Irregular
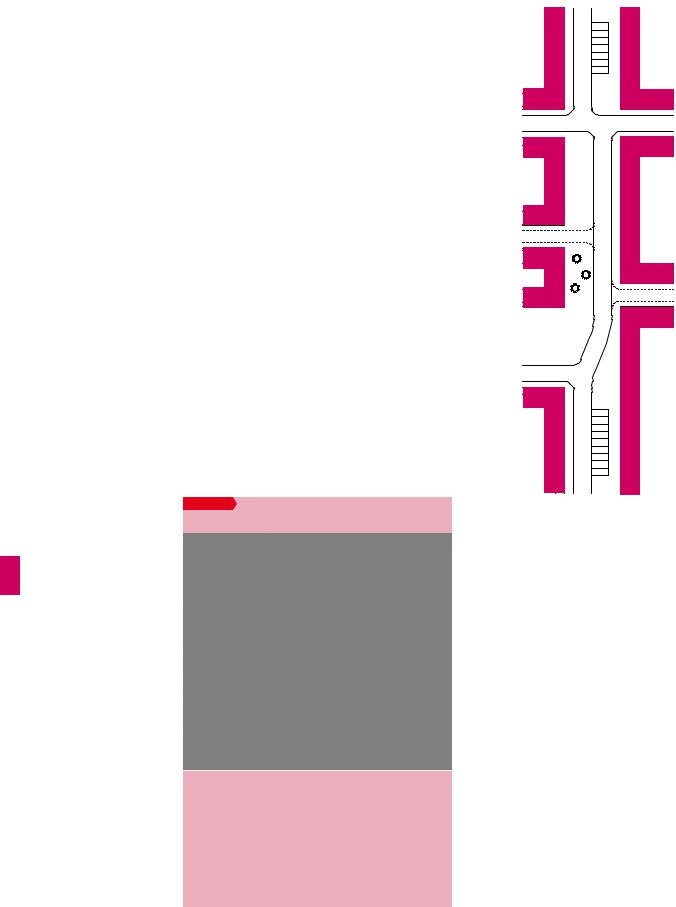
Fig. 7.9 Illustrative junction layouts.
Home Zone in England is set out in the Quiet Lanes and Home Zones (England) Regulations 20064 and guidance is provided in Department for Transport Circular 02/2006.5 Procedure regulations are yet to be made in Wales, but traffic authorities may still designate roads as Home Zones.
7.2.20Developers sometimes implement ‘Home Zone style’ schemes without formal designation. However, it is preferable for the proper steps to be followed to involve the community in deciding how the street
will be used.
7.2.21In existing streets, it is essential that the design of the Home Zone involves significant participation by local residents and local access groups. In new-build situations, a partnership between the developer and the relevant authorities will enable prospective residents to be made aware of the proposed designation of the street as a Home Zone. This will pave the way for the formal consultation procedure once the s treet becomes public highway.
7.2.22Further guidance on the design
of Home Zones is given in Home Zones: Challenging the Future of Our Streets,6 the Institute of Highway Incorporated Engineers’ (IHIE) Home Zone Design Guidelines7 and on the website www.homezones.org.uk.
7.3Junctions
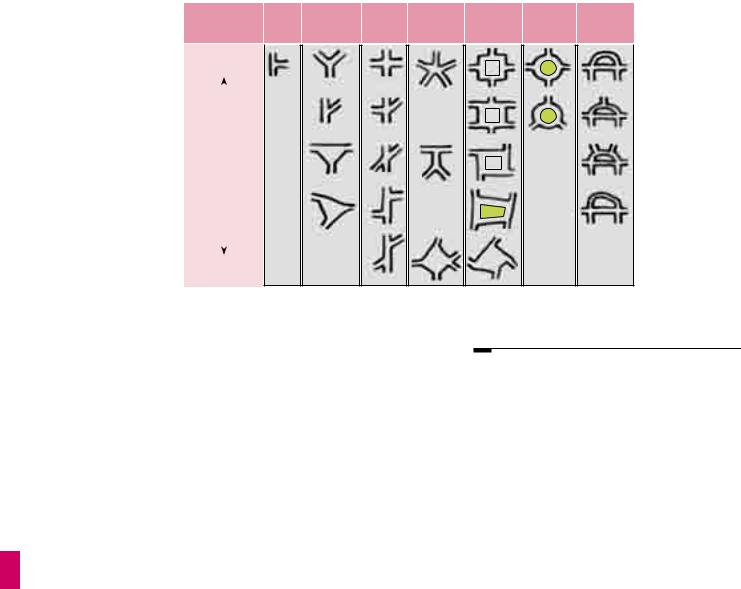
7.3.1 Junctions that are commonly used in residential areas include:
•crossroads and staggered junctions;
•T and Y junctions; and
•roundabouts.
Figure 7.9 illustrates a broader range of junction geometries to show how these basic types can be developed to create distinctive places.
Mini-roundabouts and shared surface squares can be incorporated within some of the depicted arrangements.
7.3.2Junctions are generally places of high accessibility and good natural surveillance. They are therefore ideal places for locating public buildings, shops and public transport stops, etc. Junctions are places of interaction among street users. Their design is therefore critical to achieving a proper balance between their place and movement functions.
7.3.3The basic junction forms should be determined at the masterplanning stage. At the street design stage, they will have to be considered in more detail in order to determine how they are going to work in practice. Masterplanning and detailed design will cover issues such as traffic priority arrangements, the need, or otherwise, for signs, markings and kerbs, and how property and building lines are related.
84 |
Manual for Streets |
7.3.4The resulting spaces and townscape should ideally be represented in three dimensions – see box.
7.3.5Often, the key to a well-designed junction is the way in which buildings are placed around it and how they enclose the space in which the junction sits. Building placement should therefore be decided upon first, with the junction then designed to suit the available space.
7.3.6Junction design should facilitate direct pedestrian desire lines, and this will often mean using small corner radii. The use of swept path analysis will ensure that the junctions are negotiable by vehicles (Fig. 7.11).
 Una McGaughrin, Llewelyn Davies Yeang
Figure 7.11 Quadrant kerbstones used instead of large radii at junctions reduce the dominance of the carriageway. This is reinforced by the placement and form of the adjacent buildings and the absence of road markings. However, note the lack of dropped kerbs and tactile paving.
Drawing in three dimensions
Presenting design layouts in three dimensions is an important way of looking at aspects of engineering and urban design together
(Fig. 7.10). It enables street furniture, lighting, utility equipment and landscaping to be clearly shown. Three-dimensional layouts are also useful in consultation with the public.
Street cross-sections and plans should be developed initially. Perspective or axonometric drawings can then be produced to add clarity and to assist designers in visualising and refining their ideas. Such three-dimensional representation is fairly easy to achieve both by hand and using CAD software. For more complex schemes, a computer-generated ‘walk-through’ presentation can be used to demonstrate how the proposal will work in practice. It is also a powerful tool for resolving design issues.
d
c e
b
a
d
a b c
e
30 

Figure 7.10 Example of three-dimensional presentations.
30 |
J Davis |
|
|
||
Colin |
|
|
|
|
Manual for Streets |
85 |
7.3.7Junctions can be marked to indicate which arms have priority, but on quieter streets it may be acceptable to leave them unmarked.
A lack of marked priority may encourage motorists to slow down to negotiate their way through, making the junction more comfortable for use by pedestrians. However, this approach requires careful consideration (see Chapter 9).
7.3.8Crossroads are convenient for pedestrians, as they minimise diversion from desire lines when crossing the street. They also make it easier to create permeable and legible street networks.
7.3.9Permeable layouts can also be achieved using T and Y junctions. Y junctions can increase flexibility in layout design.
7.3.10Staggered junctions can reduce vehicle conflict compared with crossroads, but may reduce directness for pedestrians. If it is necessary to maintain a view point or vista, and if there is sufficient room between buildings, staggered junctions can be provided within continuous building lines. (Fig. 7.12).
Case study
Hulme, Manchester: speed tables
Tim Pharoah, Llewelyn Davies Yeang
Figure 7.13 Raised tables at junction in Hulme. The table has been raised almost to kerb height.
A distinctive feature of the Hulme development is the adherence to a linear grid form. Raised tables at junctions reduce speeds and facilitate pedestrian movement (Fig. 7.13).
Figure 7.12 – Using staggered junctions to maintain a view point or vista.
7.3.11Where designers are concerned about potential user conflict, they may consider placing the junction on a speed table (see Hulme, Manchester box). Another option might be to close one of the arms to motor traffic (while leaving it open for pedestrians and cyclists).
7.3.12Conventional roundabouts are
not generally appropriate for residential developments. Their capacity advantages are not usually relevant, they can have a negative impact on vulnerable road users, and they often do little for the street scene.
7.3.13 Larger roundabouts are inconvenient for pedestrians because they are deflected from their desire lines, and people waiting to cross one of the arms may not be able to anticipate easily the movement of motor vehicles on the roundabout, or entering or leaving it.
86 |
Manual for Streets |

8Department for Transport and County Surveyors’ Society (CSS) (2006)
Mini-roundabouts: Good Practice Guidance.
London: CSS.
9Davies D,G. Taylor, MC, Ryley, TJ, Halliday,
M. (1997) Cyclists at Roundabouts – the Effects of ‘Continental’ Design on Predicted Safety and Capacity. TRL Report No.
285. Crowthorne: TRL.
10DETR (1997) Traffic Advisory Leaflet 9/97
– Cyclists at Roundabouts: Continental Design Geometry. London: DETR.
11I York, A Bradbury, S Reid, T Ewings and R Paradise (2007) The Manual
for Streets: redefining residential street design. TRL Report no. 661. Crowthorne: TRL.
Peter O’Brien, Llewelyn Davies Yeang
Figure 7.14This street avoids the use of vertical traffic-calming features, but the irregular alignment is unsightly and unlikely to have much speed-reducing effect, because of the width of the carriageway. It also results in irregular grassed areas that create a maintenance burden while contributing little to street quality.
7.3.14Roundabouts can be hazardous for cyclists. Drivers entering at relatively high speed may not notice cyclists on the circulatory carriageway, and cyclists travelling past an arm are vulnerable to being hit by vehicles entering or leaving the junction.
7.3.15Mini-roundabouts may be more suitable in residential areas, as they cause less deviation for pedestrians and are easier for cyclists to use. In addition, they do not occupy as much land.
Practitioners should refer to Mini-roundabouts: Good Practice Guidelines.8
7.3.16Continental-style roundabouts are also suitable for consideration. They sit between conventional roundabouts and mini-roundabouts in terms of land take. They retain a conventional central island, but differ in other respects – there is minimal flare at entry and exit, and they have a single-lane circulatory carriageway. In addition, the circulatory carriageway has negative camber, so water drains away from the centre, which simplifies drainage arrangements. Their geometry is effective in reducing entry, circulatory and exit speeds.9 They are safer for cyclists because of the reduced speeds, together with the fact that drivers cannot overtake on the circulatory carriageway. Their use is described in Traffic Advisory Leaflet 9/97.10
Spacing of junctions
7.3.17The spacing of junctions should be determined by the type and size of urban blocks appropriate for the development. Block size should be based on the need for permeability, and generally tends to become smaller as density and pedestrian activity increases.
7.3.18Smaller blocks create the need for more frequent junctions. This improves permeability for pedestrians and cyclists, and the impact
of motor traffic is dispersed over a wider area. Research in the preparation of MfS11 demonstrated that more frequent (and hence less busy) junctions need not lead to higher numbers of accidents.
7.3.19Junctions do not always need to cater for all types of traffic. Some of the arms of a junction may be limited to pedestrian and cycle movement only.
7.4 Achieving appropriate traffic speeds
7.4.1 Conflict among various user groups can be minimised or avoided by reducing the speed and flow of motor vehicles. Ideally, designers should aim to create streets that control vehicle speeds naturally rather than having to rely on unsympathetic traffic-calming measures
(Fig. 7.14). In general, providing a separate pedestrian and/or cycle route away from motor traffic should only be considered as a last resort (see the hierarchy of provision in Chapter 4).
Manual for Streets |
87 |

12DETR (1999) Traffic Advisory Leaflet 9/99
- 20mph speed limits and zones. London: DETR.
13Department for Transport (2005) Traffic Advisory Leaflet 2/05 - Traffic calming Bibliography.
London: Department for Transport.
14J Kennedy, R Gorell, L Crinson, A Wheeler, M Elliott (2005)
‘Psychological’ traffic calming TRL Report No. 641. Crowthorne: TRL.
Andrew Cameron, WSP
Figure 7.15 Trees planted in the highway at Newhall, Harlow, help to reduce vehicle speeds.
7.4.2For residential streets, a maximum design speed of 20 mph should normally be an objective. The severity of injuries and the likelihood of death resulting from a collision at 20 mph are considerably less than can be expected at 30 mph. In addition, vehicle noise and the intimidation of pedestrians and cyclists are likely to be significantly lower.
7.4.3Evidence from traffic-calming schemes suggests that speed-controlling features are required at intervals of no more than 70 m in order to achieve speeds of 20 mph or less.12 Straight and uninterrupted links should therefore be limited to around 70 m to help ensure that the arrangement has a natural traffic-calming effect.
7.4.4A continuous link can be broken up by introducing features along it to slow traffic. The range of traffic-calming measures available act in different ways, with varying degrees of effectiveness:
• Physical features – involving vertical or horizontal deflection – can be very
effective in reducing speed. It is preferable to use other means of controlling speeds, if practicable, but there will be situations where physical features represent the optimum solution. Additional sources of advice on traffic calming can be found in Traffic Advisory Leaflet
2/05.13
• Changes in priority – at roundabouts and other junctions. This can be used to disrupt flow and therefore bring overall speeds down.
•Street dimensions – can have a significant influence on speeds. Keeping lengths of street between junctions short is particularly effective. Street width also has an effect on speed (see box).
•Reduced visibility – research carried out in preparation of MfS found that reductions in forward visibility are associated with reduced driving speeds (see box).
•Psychology and perception – street features and human activity can have an influence on the speed at which people choose to drive. Research14 suggests that features likely to be effective include the following:
–edge markings that visually narrow the road – speed reduction is likely to be greatest where the edging is textured to appear unsuitable for driving on;
–the close proximity of buildings to the road;
–reduced carriageway width;
–obstructions in the carriageway (Fig. 7.15);
–features associated with potential activity in, or close to, the carriageway, such as pedestrian refuges;
–on-street parking, particularly when the vehicles are parked in echelon formation or perpendicular to the carriageway;
–the types of land use associated with greater numbers of people, for example shops; and
–pedestrian activity.
88 |
Manual for Streets |
|
45 |
|
(mph) |
40 |
|
35 |
||
|
||
speed |
30 |
|
25 |
||
|
||
Average |
20 |
|
15 |
||
|
||
|
10 |
5
0
0 20
15I York, A Bradbury, S Reid, T Ewings and R Paradise (2007)
The Manual for Streets: Redefining Residential Street Design. TRL Report No. 661. Crowthorne:
TRL.
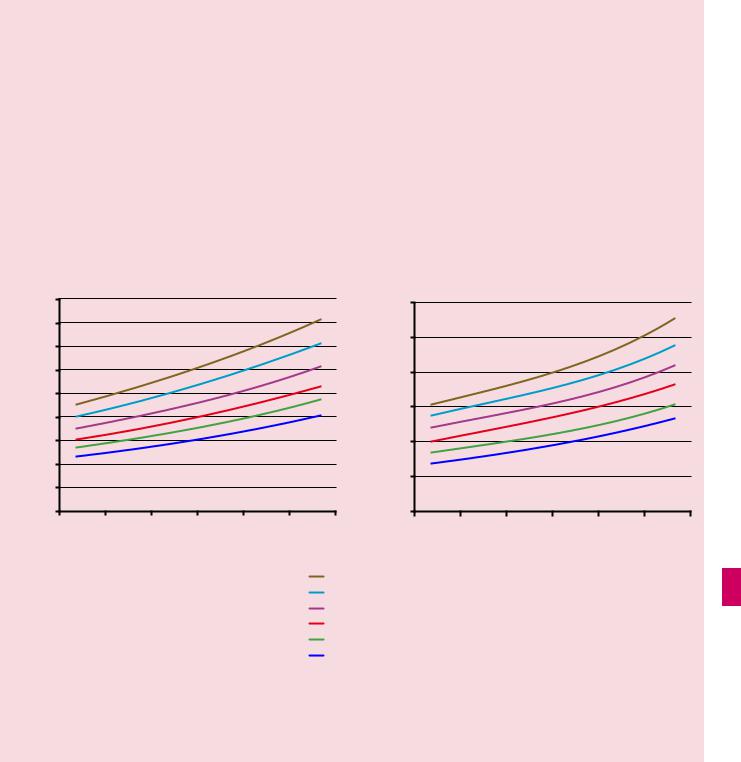
Influence of geometry on speed
Research carried out in the preparation of MfS considered the influence of geometry on vehicle speed and casualties in 20 residential and mixed-use areas in the UK. Two highway geometric factors stand out as influencing driving speed, all other things being equal. They are:
•forward visibility; and
•carriageway width.
60
(mph) |
50 |
|
speed |
40 |
|
|
||
percentile |
30 |
|
20 |
||
|
||
85th |
10 |
|
|
||
|
0 |
Improved visibility and/or increased carriageway width were found to correlate with increased vehicle speeds. Increased width for a given visibility, or vice versa, were found to increase speed. These data are summarised in
Fig. 7.16.
The relationship between visibility, highway width and driver speed identified on links was also found to apply at junctions. A full description of the research findings is available in TRL Report 661.15
40 |
60 |
80 |
100 |
120 |
0 |
20 |
40 |
60 |
80 |
100 |
120 |
Forward visibility (m) |
|
|
|
|
Forward visibility (m) |
|
|
||||
Road width = 10 m
Road width = 9 m
Road width = 8 m
Road width = 7 m
Road width = 6 m
Road width = 5 m
Figure 7.16 Correlation between visibility and carriageway width and vehicle speeds (a) average speeds and (b) 85th percentile speeds. These graphs can be used to give an indication of the speed at which traffic will travel for a given carriageway width/forward visibility combination.
7.4.5 Speed limits for residential areas are normally 30 mph, but 20 mph limits are becoming more common. If the road is lit, a 30 mph limit is signed only where it begins –
repeater signs are not used here. All other speed limits have to be signed where they start and be accompanied by repeater signs.
Manual for Streets |
89 |
16Highways Agency (1992)
Design Manual for Roads and Bridges London: TSO.
17Department of the Environment/Department of Transport (1977; 2nd edn 1992) Design Bulletin 32, Residential Roads and Footpaths - Layout Considerations. London: HMSO.
18D.W. Harwood, D.B. Fambro, B. Fishburn, H. Joubert, R. Lamm
and B. Psarianos.
(1995) International Sight Distance Design Practices, International Symposium on Highway Geometric Design Practices, Boston, Massachusetts Conference Proceedings. Washington USA: Transportation Research Board.
19Maycock G, Brocklebank P. and Hall, R. (1998)
Road Layout Design Standards and Driver Behaviour. TRL Report No. 332. Crowthorne: TRL
7.4.6A street with a 20 mph limit is not the same as a 20 mph zone. To create a 20 mph zone, it is a legal requirement that trafficcalming measures are installed to ensure that low speeds are maintained throughout. In such cases, the limit is signed only on entering the zone, and no repeater signs are necessary.
7.4.7Any speed limits below 30 mph, other than 20 mph limits or 20 mph zones, require individual consent from the Secretary of State for Transport. Designers should note that such approval is unlikely to be given.
7.4.8A speed limit is not an indication of the appropriate speed to drive at. It is the responsibility of drivers to travel within the speed limit at a speed suited to the conditions. However, for new streets, or where existing streets are being modified, and the design speed is below the speed limit, it will be necessary
to include measures that reduce traffic speeds accordingly.
7.4.9Difficulties may be encountered where a new development connects to an existing road. If the junction geometry cannot be made to conform to the requirements for prevailing traffic speeds, the installation of traffic-calming measures on the approach will allow the use of a lower design speed to be used for the new junction.
7.5Stopping sight distance
7.5.1This section provides guidance on stopping sight distances (SSDs) for streets where 85th percentile speeds are up to 60 km/h. At speeds above this, the recommended SSDs in the Design Manual for Roads and Bridges16 may be more appropriate.
7.5.2The stopping sight distance (SSD)
is the distance within which drivers need to be able to see ahead and stop from a given speed. It is calculated from the speed of the vehicle, the time required for a driver to
identify a hazard and then begin to brake (the perception–reaction time), and the vehicle’s rate of deceleration. For new streets, the design speed is set by the designer. For existing streets, the 85th percentile wet-weather speed is used.
7.5.3 The basic formula for calculating SSD (in metres) is:
SSD = vt + v2/2d where:
v |
= speed (m/s) |
t |
= driver perception–reaction time |
|
(seconds) |
d |
= deceleration (m/s2) |
7.5.4 |
The desirable minimum SSDs used in |
the Design Manual for Roads and Bridges are based on a driver perception–reaction time of 2 seconds and a deceleration rate of 2.45 m/s2 (equivalent to 0.25g where g is acceleration due to gravity (9.81 m/s2 )). Design Bulletin 3217 adopted these values.
7.5.5 Drivers are normally able to stop much more quickly than this in response to an emergency. The stopping distances given in the Highway Code assume a driver reaction time of 0.67 seconds, and a deceleration rate
of 6.57 m/s2.
7.5.6 While it is not appropriate to design street geometry based on braking in an emergency, there is scope for using lower SSDs than those used in Design Bulletin 32. This is based upon the following:
• a review of practice in other countries has shown that Design Bulletin 32 values are much more conservative than those used elsewhere;18
• research which shows that the 90th percentile reaction time for drivers confronted with a side-road hazard in a driving simulator is 0.9 seconds (see TRL Report 33219);
• carriageway surfaces are normally able to develop a skidding resistance of at least 0.45g in wet weather conditions.
Deceleration rates of 0.25g (the previously assumed value) are more typically associated with snow-covered roads; and
• of the sites studied in the preparation of this manual, no relationship was found between SSDs and casualties, regardless of whether the sites complied with Design Bulletin 32 or not.
90 |
Manual for Streets |
2000 max. |
600 min. |
|
Table 7.1 Derived SSDs for streets (figures rounded).
Speed |
Kilometres per |
16 |
20 |
24 |
25 |
30 |
32 |
40 |
45 |
48 |
50 |
60 |
|
hour |
|
|
|
|
|
|
|
|
|
|
|
|
Miles per hour |
10 |
12 |
15 |
16 |
19 |
20 |
25 |
28 |
30 |
31 |
37 |
SSD (metres) |
|
9 |
12 |
15 |
16 |
20 |
22 |
31 |
36 |
40 |
43 |
56 |
SSD adjusted for bonnet |
11 |
14 |
17 |
18 |
23 |
25 |
33 |
39 |
43 |
45 |
59 |
|
length. See 7.6.4 |
|
|
|
|
|
|
|
|
|
|
|
|
Additional features will be needed to achieve low speeds
7.5.7The SSD values used in MfS are based on a perception–reaction time of 1.5 seconds and a deceleration rate of 0.45g (4.41 m/s2). Table 7.1 uses these values to show the effect of speed on SSD.
7.5.8Below around 20 m, shorter SSDs themselves will not achieve low vehicle speeds: speed-reducing features will be needed. For higher speed roads, i.e. with an 85th percentile speed over 60 km/h, it may be appropriate
to use longer SSDs, as set out in the Design Manual for Roads and Bridges.
7.5.9Gradients affect stopping distances. The deceleration rate of 0.45g used to calculate the figures in Table 7.1 is for a level road. A 10% gradient will increase (or decrease) the rate by around 0.1g.
7.6Visibility requirements
7.6.1 Visibility should be checked at junctions and along the street. Visibility is measured horizontally and vertically.
7.6.2Using plan views of proposed layouts, checks for visibility in the horizontal plane ensure that views are not obscured by vertical obstructions.
7.6.3Checking visibility in the vertical plane is then carried out to ensure that views in the horizontal plane are not compromised by obstructions such as the crest of a hill, or a bridge at a dip in the road ahead. It also takes into account the variation in driver eye height
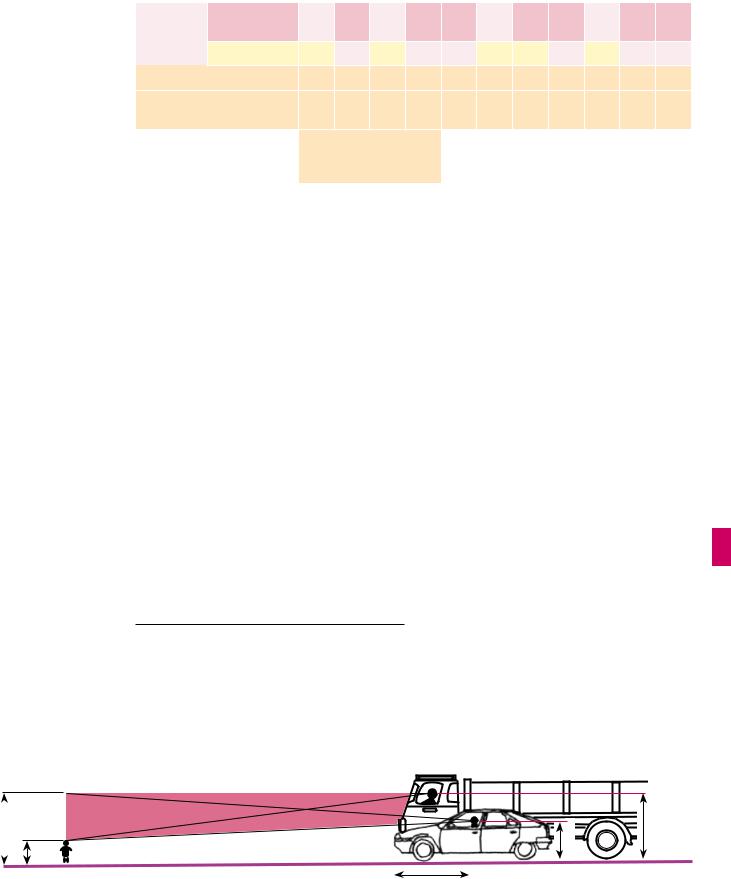
and the height range of obstructions. Eye height is assumed to range from 1.05 m (for car drivers) to 2 m (for lorry drivers). Drivers need to be able to see obstructions 2 m high down to a point 600 mm above the carriageway. The latter dimension is used to ensure small children can be seen (Fig. 7.17).
7.6.4The SSD figure relates to the position of the driver. However, the distance between the driver and the front of the vehicle is typically up to 2.4 m, which is a significant proportion of shorter stopping distances. It is therefore recommended that an allowance is made by adding 2.4 m to the SSD.
1050 min. |
2000 max. |
Typically 2400
Figure 7.17 Vertical visibility envelope.
Manual for Streets |
91 |

7.7Visibility splays at junctions
7.7.1The visibility splay at a junction ensures there is adequate inter-visibility between vehicles on the major and minor arms (Fig. 7.18).
7.7.2The distance back along the minor arm from which visibility is measured is known as the X distance. It is generally measured back from the ‘give way’ line (or an imaginary ‘give way’ line if no such markings are provided). This distance is normally measured along the centreline of the minor arm for simplicity, but in some circumstances (for example where there is a wide splitter island on the minor arm) it will be more appropriate to measure it from the actual position of the driver.
7.7.3The Y distance represents the distance that a driver who is about to exit from the minor arm can see to his left and right along the main alignment. For simplicity it is measured along the nearside kerb line of the main arm, although vehicles will normally be travelling a distance from the kerb line. The measurement is taken from the point where this line intersects the centreline of the minor arm (unless, as above, there is a splitter island in the minor arm).
7.7.4When the main alignment is curved and the minor arm joins on the outside of a bend, another check is necessary to make sure that an approaching vehicle on the main arm is visible over the whole of the Y distance. This is done by drawing an additional sight line which meets the kerb line at a tangent.
7.7.5Some circumstances make it unlikely that vehicles approaching from the left on the main arm will cross the centreline of the main arm – opposing flows may be physically
segregated at that point, for example. If so, the visibility splay to the left can be measured to the centreline of the main arm.
X distance
7.7.6An X distance of 2.4 m should normally be used in most built-up situations, as this represents a reasonable maximum distance between the front of the car and the driver’s eye.
7.7.7A minimum figure of 2 m may be considered in some very lightly-trafficked and slow-speed situations, but using this value will mean that the front of some vehicles will
protrude slightly into the running carriageway of the major arm. The ability of drivers and cyclists to see this overhang from a reasonable distance, and to manoeuvre around it without undue difficulty, should be considered.
7.7.8Using an X distance in excess of 2.4 m is not generally required in built-up areas.
7.7.9Longer X distances enable drivers to look for gaps as they approach the junction. This increases junction capacity for the minor arm, and so may be justified in some circumstances, but it also increases the possibility that drivers on the minor approach will fail to take account of other road users, particularly pedestrians and cyclists. Longer X distances may also result in more shunt accidents on the minor arm.
TRL Report No. 18420 found that accident risk increased with greater minor-road sight distance.
Y distance
7.7.10 The Y distance should be based on values for SSD (Table 7.1).
20Summersgill I., Kennedy, J. and Baynes, D. (1996)
Accidents at Three-arm Priority Junctions on Urban Single-carriageway Roads TRL Report no.
184. Crowthorne: TRL.
92 |
Manual for Streets |

aPossible features preventing vehicles from crossing centre line
Y distance
Alternative left-hand visibilty splay if vehicles approaching from the left are unable to cross the centre line
Y distance
X distance
Left-hand |
Right-hand |
visibility splay |
visibility splay |
bPossible feature preventing vehicles from crossing
centre line
Alternative left-hand visibility
|
|
splay if vehicles approaching |
|
|
|
|
from the left are unable to |
|
|
|
|
cross the centre line |
|
|
|
|
Visibility splays |
|
|
Tangent to kerb |
|
|
Tangent to kerb |
|
|
|
line (additional |
||
line (additional |
Y distance |
Y distance |
||
check) |
||||
check) |
|
|
||
|
|
|
||
|
|
|
X distance |
c
Possible feature preventing vehicles from crossing centre line
Y distance
Alternative left-hand visibility splay if vehicles approaching from the left are unable to cross the centre line
X distance
Y distance
Visibility splays
Figure 7.18 Measurement of junction visibility splays (a) on a straight road, (b) and (c) on bends.
Manual for Streets |
93 |
7.8Forward visibility
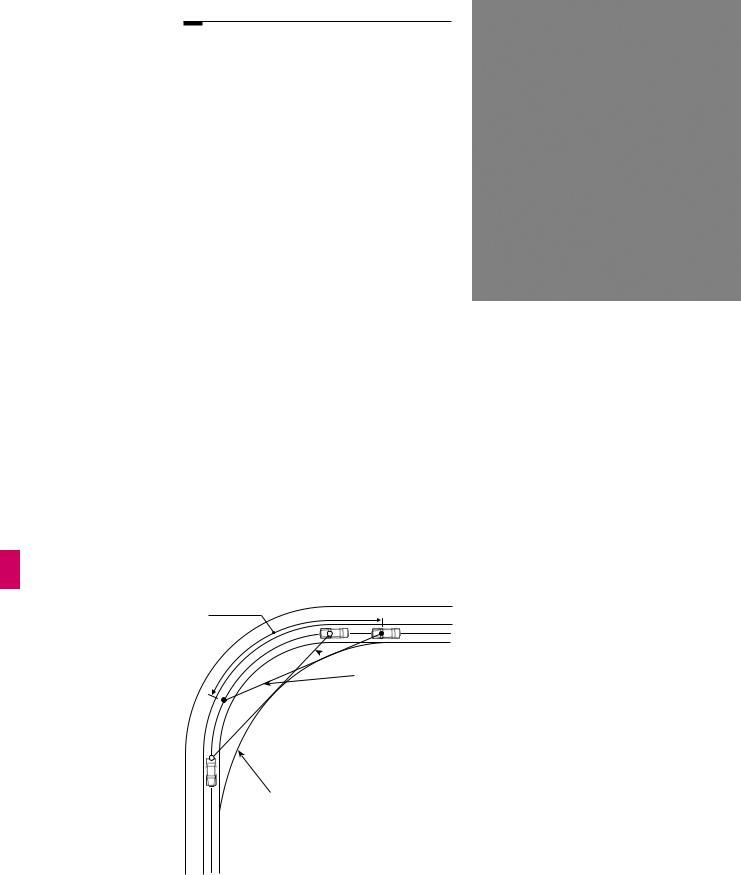
7.8.1Forward visibility is the distance a driver needs to see ahead to stop safely for obstructions in the road. The minimum forward visibility required is equal to the minimum SSD. It is checked by measuring between points on a curve along the centreline of the inner traffic lane (see Fig. 7.19).
7.8.2There will be situations where it is desirable to reduce forward visibility to control traffic speed – the Influence of geometry on speed box describes how forward visibility influences speed. An example is shown in Fig 7.20.
Visibility along the street edge
7.8.3 Vehicle exits at the back edge of the footway mean that emerging drivers will have to take account of people on the footway.
The absence of wide visibility splays at private driveways will encourage drivers to emerge more cautiously. Consideration should be given to whether this will be appropriate, taking into account the following:
•the frequency of vehicle movements;
•the amount of pedestrian activity; and
•the width of the footway.
Forward visibility measured along centre of inner lane
 Visibility splays
Visibility splay envelope
Figure 7.19 Measurement of forward visibility.
Andrew Cameron, WSP
Figure 7.20 Limiting forward visibility helps keep speeds down in Poundbury, Dorset.
7..8.4 When it is judged that footway visibility splays are to be provided , consideration should be given to the best means of achieving this in a manner sympathetic to the visual appearance of the street (Fig. 7.21). This may include:
•the use of boundary railings rather than walls (Fig. 7.22); and
•the omission of boundary walls or fences at the exit location.
Obstacles to visibility
7.8.5Parking in visibility splays in built-up areas is quite common, yet it does not appear to create significant problems in practice. Ideally, defined parking bays should be provided outside the visibility splay. However, in some circumstances, where speeds are low, some encroachment may be acceptable.
7.8.6The impact of other obstacles, such as street trees and street lighting columns, should be assessed in terms of their impact on the overall envelope of visibility. In general, occasional obstacles to visibility that are not large enough to fully obscure a whole vehicle or a pedestrian, including a child or wheelchair user, will not have a significant impact on road safety.
94 |
Manual for Streets |

Figure 7.21 Beaulieu Park, Chelmsford – low vegetation provides subtle provision of visibility at private driveway.
Tim Pharoah, Llewelyn Davies Yeang |
Tim Pharoah, Llewelyn Davies Yeang |
Figure 7.22 Beaulieu Park, Chelmsford: the visibility splays are provided by railings rather than boundary walls, although the railings could have followed the property boundary.
7.9Frontage access
7.9.1One of the key differences between streets and roads is that streets normally provide direct access to buildings and public spaces. This helps to generate activity and a positive relationship between the street and its surroundings. Providing direct access to buildings is also efficient in land-use terms.
7.9.2 The provision of frontage vehicle access onto a street should be considered from the viewpoint of the people passing along the street, as well as those requiring access (Fig. 7.23). Factors to consider include:
•the speed and volume of traffic on the street;
•the possibility of the vehicles turning around within the property – where this is possible, then vehicles can exit travelling forward;
•the presence of gathered accesses – a single access point can serve a number of properties or a communal parking area, for example. This may be acceptable where a series of individual accesses would not be; and
•the distance between the property boundary and the carriageway – to provide adequate visibility for the emerging driver.
7.9.3 In the past, a relatively low limit on traffic flow (300 vehicles per peak hour or some 3,000 vehicles per day) has generally been used when deciding whether direct access was appropriate. This is equivalent to the traffic generated by around 400 houses. Above this level, many local-authority residential road guidelines required the provision of a ‘local distributor road’.
Andrew Cameron, WSP
Figure 7.23 Frontage access for individual dwellings onto a main street into Dorchester.
Manual for Streets |
95 |

7.9.4Such roads are often very unsuccessful in terms of placemaking and providing for pedestrians and cyclists. In many cases, buildings turn their backs onto local distributors, creating dead frontages and sterile environments. Separate service roads are another possible design response, but these are wasteful of land and reduce visual enclosure and quality.
7.9.5It is recommended that the limit for providing direct access on roads with a 30 mph speed restriction is raised to at least 10,000 vehicles per day (see box).
Traffic flow and road safety for streets with direct frontage access
The relationship between traffic flow and road safety for streets with direct frontage access was researched for MfS. Data on recorded accidents and traffic flow for a total of 20 sites were obtained. All of the sites were similar in terms of land use (continuous houses with driveways), speed limit (30 mph) and geometry (single-carriageway roads with limited sideroad junctions). Traffic flows at the sites varied from some 600 vehicles per day to some 23,000 vehicles per day, with an average traffic flow of some 4,000 vehicles per day.
It was found that very few accidents occurred involving vehicles turning into and out of driveways, even on heavily-trafficked roads.
Links with direct frontage access can be designed for significantly higher traffic flows than have been used in the past, and there is good evidence to raise this figure to 10,000 vehicles per day. It could be increased further, and it is suggested that local authorities review their standards with reference to their own traffic flows and personal injury accident records. The research indicated that a
link carrying this volume of traffic, with characteristics similar to those studied, would experience around one driveway-related accident every five years per kilometre. Fewer accidents would be expected on links where the speed of traffic is limited to 20 mph or less, which should be the aim in residential areas.
7.10Turning areas
7.10.1Connected street networks will generally eliminate the need for drivers to make three-point turns.
7.10.2Where it is necessary to provide for three-point turns (e.g. in a cul-de-sac), a tracking assessment should be made to indicate the types of vehicles that may be making this manoeuvre and how they can be accommodated. The turning space provided should relate to its environment, not specifically to vehicle movement (see Fig. 7.24), as this can result
in a space with no use other than for turning vehicles. To be effective and usable, the turning head must be kept clear of parked vehicles. Therefore it is essential that adequate parking is provided for residents in suitable locations.
7.10.3Routeing for waste vehicles should be determined at the concept masterplan or scheme design stage (see paragraph 6.8.4). Wherever possible, routing should be configured so that the refuse collection can be made without the need for the vehicle having to reverse, as turning heads may be obstructed by parked vehicles and reversing refuse vehicles create a risk to other street users.
 7
7
 3
3
Figure 7.24 Different turning spaces and usable turning heads.
96 |
Manual for Streets |

7.11Overrun areas
7.11.1 Overrun areas are used at bends and junctions (including roundabouts). They are areas of carriageway with a surface texture and/ or appearance intended to deter overrunning by cars and other light vehicles. Their purpose is to allow the passage of large vehicles, such as buses and refuse vehicles, while maintaining ‘tight’ carriageway dimensions that deter smaller vehicles from speeding.
7.11.2 Overrun areas should generally be avoided in residential and mixed-use streets. They can:
•be visually intrusive;
•interfere with pedestrian desire lines (Fig. 7.25); and
•pose a hazard for cyclists.
However, they can help to overcome problems with access for larger vehicles and so may represent the best solution.
Tim Pharoah, Llewelyn Davies Yeang
Figure 7.25 The overrun area at this junction is hazardous for pedestrians and/or requires them to divert from their desire line. Notice also the unsightly placing of inspection covers. The layout is particularly hazardous for blind and partially-sighted pedestrians.
Manual for Streets |
97 |