

Drewett_1999_Field_Archaeology
.pdfFINDING ARCHAEOLOGICAL SITES |
47 |
count each type and leave them in situ. This may be determined by the law in a particular country or by the fact that many museums simply do not want hundreds of fragments of floor tile, for example. It is always better to discard artefacts on site rather than take them elsewhere, and then discard them to the confusion of future archaeologists.
For more intensive surveys the grid system is more appropriate. In this type of survey the area is gridded (see Chapter Four). The size of the grid square will depend on how detailed a survey you are aiming at. Usually the squares are 20 m or 30 m square, but they could be larger or smaller. The smaller the squares, however, the longer they will take to set out, more bags will be used, and analysis and plotting will take longer. Given the nature of material in ploughed fields, overdetailed recording is often a waste of time. For larger squares a team of archaeologists will line up on one side of the square and walk across the square in a line, picking up all artefacts they see. Given the way light shines on some artefacts, like flint flakes, they are often more visible from one direction than another. If time is available (which it rarely is) the squares can be walked from two directions. The number of walks across a square must, however, be the same for every square in the survey, or the quantification of the results becomes pointless.
Throughout this section on field walkingthe term artefact has been used.This was deliberate. Artefacts can usually be at least approximately dated, so prehistoric can be separated from historic or modern. Other materials like bones and shells create more of a problem, because individually they cannot often be dated. If they are directly associated with clusters of datable artefacts one can assume an association, but one can rarely be certain. Shell may have been brought to the area by hermit crabs or bones by scavenging animals.Adecision may be sensibly taken to ignore all this type of material. Bones in a ploughed field are always likely to be biased towards big bones from sheep, goats, cattle and the like, and against small fish and bird bones. Any attempt at quantification is therefore pretty meaningless. However, they may be important to indicate survival below the surface, or the position of plough-damaged human burials.All the time the field surveyor must weigh up time and cost against value of recovered information. If it is too biased, is it worth collecting?
Having recovered, recorded and identified archaeological material in ploughed fields, it should be quantified and represented in some graphic form to show variations in distribution. Either actual numbers of different classes of material can be plotted in some way, or a mean can be calculated for the whole survey area and distributions above the mean plotted.
For line surveys, densities of artefacts can be plotted by regular variation of thickness of line (Fig. 3.10). Thick lines will clearly show concentrations of artefacts while thin lines show just a thin spread.Agap in the line or a thin line would indicate either no artefacts of a particular class or none above the background mean. For gridded surveys a black circle of variable size to show quantity is often used (Fig. 3.11), but graded shading or dot-density could also be used. Contour maps of surface concentrations are an alternative way of plotting the data, but they are slightly more complex to produce, and as they involve interpolation may create somewhat spurious accuracy.

48 FIELD ARCHAEOLOGY
Figure 3.10 Field-walking by lines: graphic illustration of artefact densities.
Figure 3.11 Field-walking by squares: graphic illustration of artefact densities.
FINDING ARCHAEOLOGICAL SITES |
49 |
The interpretation of field-walking data must always be approached with extreme caution. The absence of artefacts does not necessarily indicate the absence of sites, and the presence of artefacts at a particular spot in the landscape does not necessarily mean the presence of human activity of that date in the past at that spot. Plough soils tend to be of more or less regular depth, depending on the type of plough, soil and crop to be planted. If the archaeology is below this depth it may simply not appear in the plough soil. Also, buried archaeology is unlikely to be at a constant depth, so if it is shallower at one point on the site it may appear in the plough soil, while where it is deeper it will not. If the landscape is undulating, artefacts will tend to move down slopes and accumulate in low spots like dry valleys. Movement of objects can be partly determined by the state of the objects. The more abraded they are, the more they are likely to have been moved either downslope or round and around in the soil. Fresh, unabraded pottery is unlikely to have moved far. Artefact spreads in plough soil usually, therefore, indicate activity at that spot or further uphill. The absence of artefact spreads does not, however, necessarily mean absence of sites.
A separate problem is interpreting the nature of the artefact spread, as the term site has been used to cover every type of activity area. A pottery concentration, for example, could represent a settlement site, a kiln site, a midden or rubbish dump adjacent to a settlement, or artefacts spread together with manure over fields well away from a settlement. Again the state of the artefact may help. Many small sherds mixed with other artefacts and ecofacts may represent a settlement area. If there are many misshapen sherds (wasters) in the assemblage it may represent a kiln site or waster dump. Many large, angular pot sherds with other rubbish could represent a midden, while small abraded sherds may represent manuring or simply erosion downslope from a midden. Field walking is therefore an excellent field survey method, but the interpretation of the data must always be within the local landscape context and treated with extreme caution.
Not all the landscape is, however, ploughed. Unploughed areas may contain archaeological sites surviving as earthworks or stone settings. These are more likely to show up on aerial photographs than will scatters of artefacts in ploughed fields. For a variety of reasons, however, not all earthworks or stone settings will show up on aerial photographs or if they do, they may not be recognizable. Ground surveys may therefore be required both to locate sites and to fill in details of sites recognized on aerial photographs.
Survey of sites surviving as humps and bumps, or stone settings, requires two main elements. Firstly the site has to be located, and then recorded and intepreted. The topographical survey of these sites will be considered in Chapter Four. Location of such sites should be approached in a systematic way to ensure area coverage. If the whole area to be surveyed is unploughed, parallel transect lines could be walked across the landscape, and whenever an unnatural-looking hump or bump is seen, or stone setting located, its position would be recorded and a simple record form filled in.At the very least the record form should include a unique reference number; site name (if there is one); cartographic reference; and type, date and condition of site. Thereafter
50 FIELD ARCHAEOLOGY
more and more detail can be recorded, depending on the nature of the survey. For example, altitude, geology, soil type, land use, aspect and orientation of site could be recorded.
Generally one is not dealing with entirely unploughed or undeveloped landscapes, and therefore earthworks only survive in woodland, nature reserves, parkland or slopes too steep for arable. Your survey design would therefore have to be geared to the specific landscape. Walking parallel transects in woodland, for example, is often not possible and yet in areas like Britain woodland often preserves the best earthworks. You may have to zig-zag through woodland, recording each change in direction with a prismatic compass.
Having located an earthwork site, it can either remain as a dot on a distribution map or be subjected to an interpretative survey. This is a highly skilled process requiring an archaeological surveyor as distinct from a straight topographical surveyor. Earthwork surveys produced by some topographical surveyors without the required archaeological knowledge, although no doubt perfectly accurate, often look like patterns of railway embankments. The interpretative survey involves looking at relationships between humps and bumps and dips. Which bit of the pattern was there first? Which bit overlies the earlier features? How were they modified through time? As with the interpretation of aerial photographs, the surveyor is looking for identifiable patterns and relationships to build up sequences from the palimpsests left in the landscape. A skilled archaeological surveyor undertaking an interpretative survey can often work out the sequence of development of a site without any damaging resort to excavation. Of course, not all archaeological features will show as humps or dips in the land surface. Even large pits and ditches could be so well filled that they simply do not show on the surface. They may also be overlain by a later bank for example. One way to look into the ground without resorting to excavationis touse the widerange of geophysical techniquesnow availableto field archaeologists.
Geophysical survey
Geophysical surveying techniques are part of the battery of remote sensing techniques which include aerial photography and satellite images. Like all remote sensing techniques, geophysical surveyingisa non-destructive methodof site investigation, sohas obviousadvantages over excavation when dealing with the finite archaeological resource.
Although General Pitt-Rivers used a primitive type of geophysics as early as 1893, the first use of instruments to record geophysical data was undertaken by Professor Richard Atkinson in 1946 at a site in Dorchester. Pitt-Rivers technique was simply to hit the ground with the end of a pick axe and listen to variations in the returning sound.Adull thud might indicate a ditch fill, while a ringing sound might represent the underlying solid geology just below the surface. It was a rough-and-ready technique which sometimes, especially on chalk, worked well. It never, however, had the same impact as Atkinson s work on the development of non-destructive field archaeology.Atkinson s first publication of resistivity surveying in English came in the second edition of his classic Field archaeology (Atkinson 1953). The remarkable advances in
FINDING ARCHAEOLOGICAL SITES |
51 |
archaeological geophysics since 1950 are amply charted in Anthony Clark s Seeing beneath the soil (Clark 1990).
Resistivity surveying remains perhaps the most important technique available to archaeologists, closely followed by magnetometry. Other techniques like ground-penetrating radar, acoustic reflection and thermal sensing, for a variety of reasons remain of more restricted use. The principles behind resistivity are relatively straightforward, although the physics and practice are more complex. Basically soils, which hold water, conduct electricity more than natural rocks like chalk, sandstone and granite. Therefore if you pass an electric current through the ground, solid materials will resist more than soil deposits. These variations in electrical resistance can be measured with a suitable meter, and patterns of variable resistance can be recorded. Solid features like walls, road surfaces and the bedrock, have a higher resistance than features filled with soil, like pits and ditches.
Although a number of instruments and probe configurations have been developed and tried since 1950, the two that have had the most success in archaeology are the Martin-Clark meter and the twin-electrode type like the Geoscan Research RM15, although the Martin-Clark meter is now rarely used.
The Martin-Clark resistivity meter is a four-terminal meter which is connected to equallyspaced steel probes pushed some six inches (15 cm) into the ground. Five probes are spaced at one-metre intervals in a straight line. Only four of the probes are active at any one time. Two of the probes pass alternating current into the ground, while the other two measure the voltage gradient created as the current passes through the ground. The advantage of having a fifth probe is that by using a turret switch on the meter, the end probe can be inactivated and leap-frogged over the other four, so only one probe has to be moved at a time rather than all four. The turret switch can be rotated one notch after each leap-frog so as to activate the moved probe and the three adjacent to it.
Two configurations of probes are generally used: the Wenner and the double dipole. In the Wenner configuration, the current is introduced into the ground through the outer two probes of the four active probes, and the resulting potential gradient is measured between the middle two. In the double-dipole configuration the current is passed through two adjacent probes and the potential gradient measured between the other two adjacent probes (Fig. 3.12). The Wenner configuration was designed for geological surveying of massive structures and creates some problems with narrow archaeological features. The Wenner configuration also produces double peaks over walls, making them appear much wider than they really are. The double-dipole configuration has the advantage of producing only a single peak, but has the disadvantage that penetration of the current into the soil is less than for the Wenner configuration. By using both together, the advantages of each can be gained. This is done by having a switch on the resistivity meter that can change the electrical configuration of the probes (Clark 1990).
The development of the twin-electrode configuration specifically for archaeology has led to considerable time saving in the field. This configuration is a variation of Wenner in which one of the currents and one of the potential probes are left fixed outside the survey area. The other two can then be attached to a simple frame and rapidly moved over the survey area (Fig. 3.13).

52 FIELD ARCHAEOLOGY
Figure 3.12 Geophysics: (1) Wenner configuration; (2) double-dipole configuration.
To undertake a resistivity survey, the area to be surveyed should be gridded (Chapter Four). For convenience 20 m- or 30 m-grid squares are usually used and laid out on a north south alignment. If using a twin-electrode machine on a frame, then one reading is taken in each metre square with the fixed probes outside the square (Clark 1990). The reading in each square can be recorded manually or, for greater spread, using a data logger. The data can then be presented in some graphic way ready for interpretation but we will return to this aspect of geophysics after looking at the other main methods, as finally they all produce patterns requiring similar interpretation by the field archaeologist.
The second major geophysical technique used by field archaeologists is magnetometry.This technique records minor variations in the earth s magnetic field. Many types of human activity will cause such variations in what will finally become archaeological features. Burning, where it affects clay, is particularly significant. On firing, clay becomes magnetic and retains the direction of a magnetic field of the earth at the time of firing.Also topsoil contains more magnetic oxides than subsoil, so soil silting into a ditch will locally affect the earth s magnetic field. Concentrations of iron oxides can be increased through general occupation activities resulting from burning and organic decomposition. Much of this affected material will accumulate in pits and other features,

FINDING ARCHAEOLOGICAL SITES |
53 |
Figure 3.13 Resistivity meter.
and so be detectable with a magnetometer. Obviously anything magnetic like iron fences, overhead cables, igneous geology, or even magnetic bits of the operator s clothing like metal zips, will create problems.
Proton magnetometry is based on the frequency with which hydrogen protons spin, which is affected by magnetic fields. Firstly, hydrogen protons in a liquid (water or alcohol) are aligned with the axis of a magnetic coil wound around the liquid s container. They are then allowed to realign themselves to the earth s magnetic field. The protons spin during this process and the frequency at which they do this is proportional to the earth s magnetic field. The spinning protons generate a voltage in the coil which varies with the local magnetic field, and so if readings are taken at regular intervals over the site, a magnetic plan of the site can be built up which will represent the buried features.
The proton magnetometer, however, measures the absolute value of the strength of the earth s magnetic field, so the results have to be filtered for the effects of geological background, the rising and setting of the sun, and more local problems like iron fences. The development of the gradiometer partly overcomes these problems by having two bottles, both of which record the big magnetic fields but only the lower one records the shallower features strongly. The electronics in the gradiometer subtract one bottle reading from the other, to produce surface readings.
Proton magnetometers and gradiometers both have the problem of discrete readings with no information recorded between reading spots. To rectify this problem the fluxgate gradiometer was developed which allows continuous output, making it ideal for rapidly scanning large areas

54 FIELD ARCHAEOLOGY
Figure 3.14 Grey-scale geophysical plot-out. (David Combes)
of ground. The fluxgate gradiometer is now the most frequently used type of magnetometer as its cycle of operation takes only one-thousandth of a second compared with five seconds required by a proton magnetometer (Clark 1990). The fluxgate gradiometer is a compact, lightweight instrument which measures magnetic intensity on a meter. It does this by having alloy strips which are driven in and out of magnetic saturation. As they come out of saturation, external magnetic fields can enter giving electric pulses proportional to the strength of the magnetic field. It is these variations in strength of magnetic field that are measured on a meter and can be recorded on a data logger.
The digital data recorded by both resistivity meters and fluxgate gradiometers can be transferred into graphics, showing patterns of subsurface features. This process is usually done by computer. From the 1960s until relatively recently, dot density has been the most commonly usedwayof showingpatterns graphically.Variations inresistivity or magnetic fieldarerepresented by denser or less dense concentrations of dots, producing a plan rather like a soil-mark aerial photograph. Computers can filter the dots to enhance features.
With the development of laser printers, a new graphic technique became possible. Instead of concentrations of dots of the same size, grey-scale plots can print dots of variable size on a fine regular grid (Fig. 3.14). This produces an image rather like a black-and-white photograph
FINDING ARCHAEOLOGICAL SITES |
55 |
printed in a book. Even more startling are three-dimensional-looking images produced by draping geophysical surveys over 3-D topographic models of the same area (Synnott 1996).
Whatever plotting system is used, the final result is a pattern of shapes on a computer monitor or printed page. Geophysical surveys do not tell field archaeologists exactly what is at a particular spot in the landscape. Like aerial photographs, the patterns need interpretation. As with crop marks, it is generally possible to determine whether the buried features are walls or ditches, pits or column bases, but only by knowing the range of likely sites in an area can the field archaeologist interpret the pattern as a Roman villa or a sunken house-pit of the Hudnut phase in the western USA.
A technique related to the use of magnetometers in the field is the technique of magnetic susceptibility. Magnetometers are essentially used to locate buried features and burnt areas, whereas magnetic susceptibility locates occupation areas because of the enhancement of susceptibility by the use of an area by humans. This technique is particularly important where occupation evidence survives only in topsoil, either in situ or having eroded down slopes (Clark 1990).
To undertake a magnetic susceptibility survey, the area of the survey is gridded and soil samples taken on a regular grid. These are dried and sieved to remove the coarse components like stones. The magnetic susceptibility is then measured using a sensor like the Bartington MS2B (Clark 1990).Areas of high susceptibility are likely to represent areas of human interference of the soil by enhancement through the introduction of organic rubbish or flecks of burnt material. This technique is particularly important in locating activity areas and the full extent of sites where rubbish, such as pottery, has been collected up and middened at the edge of sites, or even taken away and spread over fields with manure. Simple field walking would only find the artefact spreads which might, or might not, be close to the activity areas where this rubbish was actually generated.
The least-used of the major geophysical techniques is ground-penetrating radar. Although successfully used by the Division of Remote Sensing of the US National Parks Service since the 1970s, and on well-drained pumice-derived soils in Japan (Conyers and Goodman 1997) the equipment remains expensive, the technique is not good in wet soils, and the results are often difficult to interpret. It does, however, have some value in Britain during evaluation exercises in urban contexts as it can provide images 6 8 metres deep, in the way neither resistivity or magnetometry can (Stove and Addyman 1989).
Chemical survey
An entirely different way of locating human activity in the landscape is by locating changes in soil chemistry resulting from human occupation. It has been calculated that 100 people, carrying out a range of domestic and farming activities, deposit about 124 kg of phosphorus into the landscape annually (Proudfoot 1976).All living things absorb phosphorus and then discard it as organic waste. As most waste is likely to be disposed of at or near centres of activity, by
56 FIELD ARCHAEOLOGY
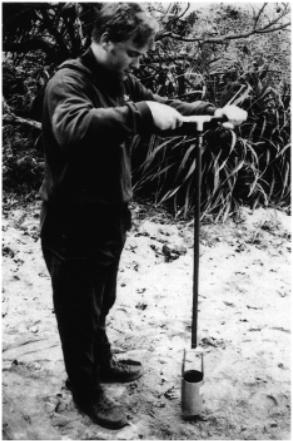
Figure 3.15 Auger survey collecting samples for phosphate analysis.
tracing concentrations of phosphorus (unless naturally occurring) in theory one can trace human activity areas. Generally this would be done where there is some other hint at human activity like aerial photographic evidence or a pottery scatter. The area to be surveyed is gridded. If the archaeology has been clearly brought up to the surface, by ploughing for example, then a soil sample is collected in each grid square. An alternative is to use an auger to take a deeper soil sample (Fig. 3.15).
Phosphorus which entered the soil with organic waste, having been released from the waste, becomes fixed in the soil. Fortunately for survey purposes, most modern phosphates used in agriculture do not fix in this way, so are lost out of the soil (to pollute streams and rivers). The organically-derived phosphates do not leach out of the soil and remain more or less where originally deposited. Each sample of about 300 g is carefully bagged and labelled. Back at the