

- •Management
- •Оглавление
- •Глава I. Коммуникативные, лексико-грамматические и синтаксические особенности профессионального и делового перевода. 13
- •Глава II. Профессиональные и деловые тексты и задания. 25
- •Глава III. Supplementary texts for translation 170
- •Введение
- •Глава I. Коммуникативные, лексико-грамматические и синтаксические особенности профессионального и делового перевода.
- •I.1Лексико-грамматические особенности профессионального и делового перевода.
- •I.1.1 Перевод will настоящим временем (habits and characteristics laws and rules, items of an agreement - неизменно, непременно, всегда)
- •I.1.2 Использование русских отглагольных существительных.
- •I.1.3 Закон семантической сочетаемости в. Г. Гака.
- •I.1.4 Перевод предложений со страдательным залогом (подлежащее выражено дополнением; неопределённо-личным предложением), случаи перевода действительного залога страдательным залогом и наоборот.
- •I.1.5 Прием смыслового развития.
- •I.1.6 Синонимические пары. Антонимический перевод.
- •I.1.7 Приём лексических опущений (компрессия).
- •I.1.8 Описательный перевод.
- •I.1.9 Терминологические словосочетания.
- •I.2 Синтаксические трансформации.
- •I.2.1 Подлежащее — фактическое обстоятельство времени.
- •I.2.2 Подлежащее — фактическое обстоятельство цели.
- •I.2.3 Подлежащее — фактическое обстоятельство места.
- •I.2.4 Подлежащее — фактическое обстоятельство причины.
- •I.2.5 Подлежащее - фактическое дополнение.
- •I.2.6 Передача предиката состояния предикатом действия.
- •I.2.7 Номинализация глагольного сказуемого, сказуемое - фактическое подлежащее.
- •I.2.8 Номинализация определения к подлежащему.
- •I.2.9 Восстановление имени при существительном в позиции подлежащего.
- •I.2.10 Членение и объединение высказываний.
- •Глава II. Профессиональные и деловые тексты и задания.
- •1.3. Answer the questions:
- •1.4. Fill in the blanks with one word chosen from the list below.
- •1.5. Translate the sentences which have actual adverbial modifier of time, place, reason and purpose.
- •2. Marketing concept
- •2.1. Read the text.
- •2.2. Answer the questions:
- •3. Market economy
- •3.1. Words to remember:
- •3.2. Read the text.
- •Mixed Economies
- •3.3. Answer the questions:
- •3.4. Now match the words (1-10) with the correct meaning.
- •3.5. Translate the sentences, where the subject - in fact another part of the sentence.
- •4. Letters of credit
- •4.1. Words to remember:
- •4.2. Read the text.
- •4.3. Answer the questions:
- •5. Bill of lading (b/l).
- •5.1. Words to remember:
- •5.2. Read the text.
- •5.3. Answer the questions:
- •5.4. Translate the sentences, where the subject - in fact another part of the sentence.
- •5.5. Translate the sentences, paying attention to the translation of will.
- •6. Starting a Business Means Getting Organized
- •6.1. Words to remember:
- •6.2. Match the words 1-10 with the definitions a- j.
- •6.3. Read the text.
- •6.4. Match the words with the definitions:
- •6.7. Read the text and decide whether the statements are true (t), false (f) or information is not available (n/a):
- •Individual proprietorship agreement partnership
- •6.9. Fill in the gaps.
- •6.10 Answer the questions:
- •6.11 Переведите в следующих предложениях состояние действием. Используйте и другие трансформации.
- •Unit II Competition
- •1. Business Means Competition
- •1.1.Words to remember:
- •1.2. Match the words with the definitions:
- •2. Idioms
- •2.1. Read the text.
- •Internal analysis of the organization
- •2.2. Examples:
- •2.3. The idioms are from sport in business. Which sports?
- •2.4. Which sports?
- •2.5. Translate the sentences, paying attention to the idioms.
- •2.6. Translate the sentences, using the transformation.
- •3. Jockeying for Position
- •3.1. Read the text.
- •3.2. Translate the text into English.
- •4. One company Targets Another
- •4.1. Read the text.
- •4.2. Read the text and decide whether these statements are true (t), false (f) or information is not available (n/a).
- •4.3. Complete each sentence with one of the following words or phrases.
- •4.4. Answer the questions.
- •4.5. Translate the sentences, where the subject - in fact adverbial modifier of time, place, cause or purpose.
- •5. How Competitive Forces Shape Strategy (Michael e. Porter)
- •5.1. Read the text.
- •5.2. Translate the following words and word-combinations from Russian into English as quickly as possible:
- •6. Internet Technologies
- •6.1. Match the words with the definitions:
- •6.3. Answer the questions:
- •7. The Price of Pleasure
- •7.1. Words to remember:
- •7.2. Match the words with the definitions.
- •7.3. Read the text.
- •7.4. Read the whole text and decide whether these statements are (t), (f) or (n/a).
- •7.5. Which of the following statements best expresses the main idea of the text?
- •7.6. Complete each sentence with one of the following words or phrases.
- •8. Big Return from a Small Investment
- •8.1. Words to remember:
- •8.2. Discuss the following with your partner:
- •8.3. Match the words with the definitions:
- •8.4. Read the text.
- •8.5. Read the text and decide whether these statements are true (t), false (f)
- •8.6. Which statements best expresses the main idea of the text?
- •8.7. Complete each sentence with one of the following words or phrases.
- •8.8. Answer the questions.
- •8.9. Translate the sentences, where the predicate is an actual subject.
- •9. Starting a Fish Farm
- •9.1. Words to remember:
- •9.2. Discuss the following with your partner:
- •9.3. Match the words with the definitions:
- •9.4. Look at the text. Mark the closest to the word need.
- •9.5. Read the text.
- •9.6. Decide what text refers to.
- •9.7. Answer the questions.
- •9.8. Read the whole text and decide whether these statements are true (t) or false (f).
- •9.9. Which of the following statements best expresses the main idea of the text?
- •9.10. Complete each sentence with one of the following words and phrases.
- •9.11. Translate the sentences, restoring a name at a noun in a position of a subject and using other transformations.
- •10. Foreign Students Financial Aid
- •10.1. Words to remember:
- •10.2. Match the words with the definitions:
- •10.3. Mark two answer choices closest in meaning to ‘close to’.
- •10.4. Mark the answer closest in meaning to the word ‘about’
- •10.5. Read the text: Four Kinds of Financial Aid
- •10.6. Answer the questions.
- •10.7. Read the text and decide whether these statements are true (t) or false (f).
- •10.8. Complete each sentence with one of the following words:
- •10.9. Translate the sentences, where the subject - in fact adverbial modifier of cause.
- •Unit III How to be successful
- •1. Punishment or Reward?
- •1.1. Words to remember:
- •1.2. Discuss the following with your partner:
- •1.3. Match the words with the definitions:
- •1.4. Which of the idioms on the left refer to the right?
- •1.5. Read the text: Punishment or Reward?
- •1.6. Decide whether these statements are true (t), false (f) or information is not available (n/a) in the text.
- •1.7. Comment the following statements.
- •1.8. Complete each sentence with one of the following words:
- •1.9. Discuss these questions with your partner.
- •1.10. Translate an objective and subjective infinitive turn.
- •2. How to avoid being accused of Plagiarism
- •2.1. Words to remember:
- •2.2. Match the words with the definitions:
- •2.4. Read the text:
- •2.5. Decide whether these statements are true (t), false (f) or information is not available (n/a) in the text.
- •2.6. Which of the following statements best expresses the main idea of the text?
- •2.7. Complete each sentence with one of the following words:
- •2.8. Discuss these questions with your partner. Use the phrases below.
- •3. Urbanization Problem
- •3.1. Words to remember:
- •3.2. Discuss the following with your partner.
- •3.3. Match the words with the definitions.
- •3.4. Mark the answer choice equal to:
- •4. Cities Now Home to More than Half of All People
- •4.1. Read the text:
- •4.2. Decide whether these statements are true (t) or false (f):
- •4.3. Where would it best fit in the text?
- •5. Business Plan
- •5.1. Words to remember:
- •5.2. Match the words with the definitions:
- •5.3. Which word is closest in meaning to:
- •5.5. Answer the questions:
- •5.6. Decide whether these statements are true (t) or false (f).
- •5.7. Which of the following statements best expresses the main idea of the text?
- •5.8. Complete each sentence with one of the following words:
- •5.9. Discuss these questions with your partner:
- •6. Fluidity means minimal bureaucracy
- •6.1. Words to remember:
- •6.2. Match the words with the definitions:
- •6.3. Give the translation analysis of sentences with the indication of receptions and variants of translation into Russian.
- •6.4. Read the text:
- •6.5. Complete each sentence with one of the following words:
- •6.6. Translate the sentences, using the method of semantic development.
- •Unit IV Market Technology Adoption
- •1. Increased technology adoption
- •1.1. Words to remember:
- •1.2. Match the words with the 7 market influences definitions:
- •1.3. Read the text.
- •1.4. Answer the questions:
- •1.5. Match
- •2. Marginal cost
- •2.1. Read the text.
- •2.2. Translate the sentences, paying attention to the synonymic couples.
- •2.3. Translate the text.
- •3. An Externality
- •3.1. Read the text.
- •3.2. Answer the questions:
- •4. An input-output model
- •4.1. Read the text.
- •4.2. Answer the questions:
- •4.3. Read the text.
- •5. Land Market influences
- •5.1. Words to remember:
- •5.2. Read the text.
- •Realtor
- •Consideration
- •Depreciation
- •6. Approaches to Determine Value
- •6.1. Read the text.
- •6.2. Complete each sentence with one of the following words:
- •6.3. Answer the questions:
- •7. Women’s Labor Market influences
- •7.1. Read the text.
- •7.2. Answer the questions:
- •8. Credit Market influences
- •8.1. Read the text.
- •Variety of investments
- •Central banking & Government influencing
- •8.2. Answer the questions:
- •9. Risk Market influences
- •9.1. Read the text.
- •9.2. Answer the questions:
- •9.3. Give the translation of logical-grammatical and lexical units. Then translate the sentences.
- •Unit V Households Constraints
- •1. Households
- •1.1. Words to remember:
- •1.2. Read the text.
- •2. Challenges of Seasonal Labor
- •2.1. Read the text.
- •2.2. Answer the questions:
- •3. Education as a Constraint to adoption
- •3.1. Read the text.
- •4. Household Labor Distribution
- •4.1. Read the text.
- •5. Implications of Constraints and How to Address them
- •5.1. Read the text.
- •6. Constraints adoption
- •6.1. Read the text.
- •6.2. Answer the questions
- •6.3. Complete each sentence with one of the following words:
- •6.4. Translate the sentences.
- •7. Meeting the Expected Profitability Condition
- •7.1. Read the text.
- •7.2. Answer the questions:
- •7.3. Complete each sentence with one of the following words:
- •Unit VI Market Technology
- •1. Defining a “Good” technology
- •1.1. Words to remember:
- •1.2. Read the text.
- •2. Fluidity indicator
- •2.1. Read the text.
- •2.2. Get ready for oral sequential translation of the text.
- •3. General Conditions of Delivery
- •3.1. Read the text.
- •3.2. Match the definition with the necessary term.
- •3.3. Make antonymous pairs.
- •4.2. Give the translational analysis of the sentences and alternative translations into English.
- •5. Economic development does not always mean socio-economic well-being of a people
- •5.1. Words to remember:
- •5.2. Match the definition with the necessary term.
- •5.3. Match the words with the definitions:
- •6. Gini coefficient
- •6.1. Read the text.
- •6.2. Answer the questions
- •6.3. Complete each sentence with one of the following words:
- •Unit VI Strategic Management
- •1. Strategic management
- •1.1. Words to remember
- •1.2. Match the words with the definitions:
- •1.3. Translate the texts and give the translational analysis. Strategic Action.
- •1.4. Answer the questions
- •1.5. Complete each sentence with one of the following words:
- •1.6. Match the words with the definitions:
- •2. Strategic Management as "identification
- •2.1. Read the text.
- •3. Finished products
- •3.1. Read the text.
- •4. Production output (works and services)
- •4.1. Read the text.
- •5. Shipment of goods
- •5.1. Read the text.
- •6. Acceptance
- •6.1. Words to remember: - также в табличке
- •6.2. Read the text.
- •6.3. Read the text.
- •Varieties of acceptances
- •6.4. Read the text. History
- •6.5. Read the text. Comparison with other drafts
- •7. The major items in the current account are:
- •7.1. Words to remember также в табличке
- •7.2. Answer the questions
- •Unit VIII Management in economics
- •1. Management in economics
- •2. Supply and demand
- •2.1. Read the text.
- •3. Scarcity
- •3.1. Read the text.
- •4. Economics and other disciplines
- •4.1. Read the text.
- •5. Welfare definition
- •5.1. Read the text.
- •6. Management Fundamentals of Business
- •6.1. Read the text.
- •Unit IX Auditing
- •1. "In God we trust, all others we audit"
- •2. Financial Audit
- •3. Internal, Governmental and External Audit
- •4. Process of Audit
- •4.1. Words to remember:
- •4.2. Read the text.
- •4.3. Answer the questions.
- •Unit X Tax
- •2. History of taxation
- •2.1. Read the text.
- •2.2. Answer the questions.
- •3. Types of Taxes
- •3.2. Read the text.
- •4. Income tax
- •4.1. Read the text.
- •5. Poll tax
- •5.1. Read the text.
- •6. Value added tax
- •6.1. Read the text.
- •6.2. Answer the questions.
- •Unit XI Сontracts and deliveries
- •1. Contracts and deliveries
- •2. Contracts and their performance
- •By road
- •Important documents and organizations which regulate trade.
- •General Conditions of Delivery
- •1. Basis and volume of delivery
- •2. Packing and Marking
- •Общие условия поставки
- •1. Содержание и объём поставки
- •2. Упаковка и маркировка
- •4. Sales letters.
- •Unit XII Law and economics
- •1. Law and economics
- •2. Two sides of social scitntists
- •2.1. Read the text.
- •3. ModelingCourts lewis a. Kornhauser
- •3.1. Words to remember
- •3.2. Read the text.
- •4. Formal models of adjudication and interpretations
- •4.1. Words to remember:
- •4.2. Read the text. A Variety of Court Models
- •4.3. Answer the questions.
- •4.4. Read the text.
- •5. Is There a Method to the Madness?
- •5.1. Words to remember
- •5.2. Read the text.
- •6. Constitutional design and metarules
- •6.1. Words to remember
- •6.2. Read th text.
- •7. Hume’s legal functionalism
- •7.1. Words to remember
- •7.2. Read the text.
- •A. The Artifice of Fictional Motives
- •8. Ideology and legal normativity
- •8.1. Words to remember
- •8.2. Read the text.
- •9. Legal normativity and ideological advertising
- •9.1. Words to remember:
- •9.2. Read the text.
- •10. Concluding remarks
- •10.1. Read the text.
- •11. Act versus Rule Utilitarianism and the Role of Social Practices
- •11.1. Read the text.
- •12. Law limitations and economics as an explanative theory
- •12.1. Read the text.
- •13. Internal and External Criticism
- •13.1. Read the text.
- •Internal Criticism
- •13.2. Read the text. External Criticism
- •Глава III. Supplementary texts for translation Tastes differ
- •Micrographics is no small business
- •Fresh approach to healthcare-information management
- •Logistics Operations &Production
- •Industry Level
- •Types of companies
- •Value chain
- •Transport and Logistics
- •State-owned corporations
- •Disadvantages
- •Приложения
- •Синонимические пары:
- •Cлова-ловушки, ложные друзья и коварные враги переводчика. –
- •Словарь «Ложные друзья и коварные враги переводчика»
- •Intrigue – Интрига, Возможность;
- •Полезные идиомы
- •Список наиболее частотных логико-грамматических лексических единиц, характерных для английского делового и профессионального текста:
- •Глоссарий
- •List of most basic latin ex-
- •List of most basic mathematical symbols
- •198095, Санкт-Петербург, ул. Розенштейна, д. 21.
6. Gini coefficient
6.1. Read the text.
Gini coefficient, also known as the Gini index or Gini ratio is a measure of statistical dispersionintended to represent the income distribution of a nation's residents. It was developed by theItalianstatisticianandsociologistCorrado Giniand published in his 1912 paper "Variability and Mutability".
The Gini coefficient measures the inequality among values of a frequency distribution(for example levels ofincome). A Gini coefficient of zero expresses perfect equality, where all values are the same (for example, where everyone has the same income). A Gini coefficient of one (or 100%) expresses maximal inequality among values (for example where only one person has all the income).http://en.wikipedia.org/wiki/Gini_coefficient - cite_note-US_Census_Bureau-3 However, a value greater than one may occur if some persons represent negative contribution to the total (e.g., have negative income or wealth). For larger groups, values close to or above 1 are very unlikely in practice.
There are some issues in interpreting a Gini coefficient. The same value may result from many different distribution curves. The demographic structure should be taken into account. Countries with an aging population, or with a baby boom, experience an increasing pre-tax Gini coefficient even if real income distribution for working adults remains constant. Scholars have devised over a dozen variants of the Gini coefficient.
Graphical representation of the Gini coefficient - Lorenz curve
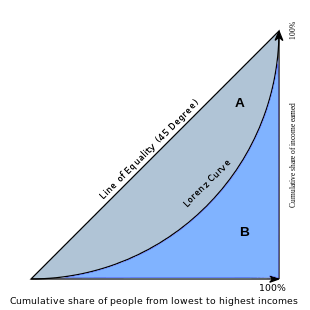
The Gini coefficient is usually defined mathematicallybased on theLorenz curve, which plots the proportion of the total income of the population (y axis) that is cumulatively earned by the bottom x% of the population (see diagram). The line at 45 degrees thus represents perfect equality of incomes. The Gini coefficient can then be thought of as theratioof theareathat lies between the line of equality and theLorenz curve(marked A in the diagram) over the total area under the line of equality (marked A and B in the diagram); i.e.,G = A (A + B).
If all people have non-negative income (or wealth, as the case may be), the Gini coefficient can theoretically range from 0 (complete equality) to 1 (complete inequality); it is sometimes expressed as a percentage ranging between 0 and 100. In practice, both extreme values are not quite reached. If negative values are possible (such as the negative wealth of people with debts), then the Gini coefficient could theoretically be more than 1. Normally the mean (or total) is assumed positive, which rules out a Gini coefficient less than zero.
A low Gini coefficient indicates a more equal distribution, with 0 corresponding to complete equality, while higher Gini coefficients indicate more unequal distribution, with 1 corresponding to complete inequality.
6.2. Answer the questions
1. What does Gini coefficient of zero express?
2. What does Gini coefficient of one (or 100%) express?
3. When does a value greater than one express?
4. Is a negative income or wealth common for persons or larger groups?
5. What do countries with an aging population, or with a baby boom, experience?
6. How is the Gini coefficient usually defined?
7. What does the line at 45 degrees represent?
8. How do you call the curve marked A in the diagram?
9. What is the difference between complete equality and complete inequality?