

106 CHINA’S RISE
Chairman Ben Bernanke, in his only speech on the Chinese economy, focused his remarks almost entirely on the case for rebalancing.3
But rebalancing the sources of economic growth has proven to be a much greater challenge than initially expected, and in certain respects China’s economic growth has become even more imbalanced since 2004. Although the growth of investment expenditures moderated slightly after 2004, net exports of goods and services soared. China’s external surplus ballooned to a global record in 2006 and continued to expand at a breakneck pace in 2007. Most importantly, private consumption expenditure as a share of GDP continued to fall through 2007.
Sources of China’s Economic Growth
China has been the fastest growing economy in the world for over three decades, expanding at 10 percent a year in real terms. As a result, real GDP in 2006 was about 13 times the level of 1978, when Deng Xiaoping launched China on the path of economic reform.4 China is now the world’s third largest trader and, measured at market exchange rates, its fourth largest economy. It is highly likely to move up a notch in each category in 2009. Given this stunning long-term success, why would China’s leadership seek to shift to a new growth paradigm? In global perspective, how imbalanced is China’s recent economic growth?
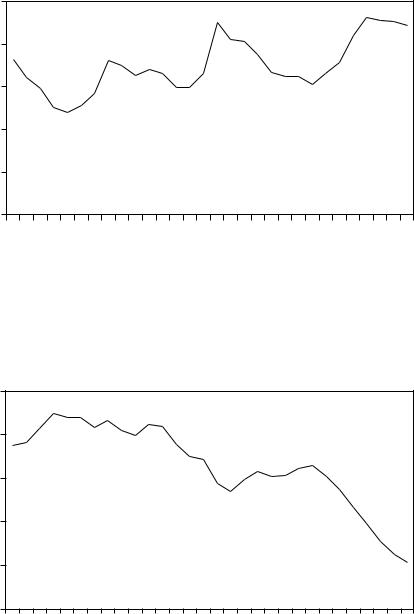
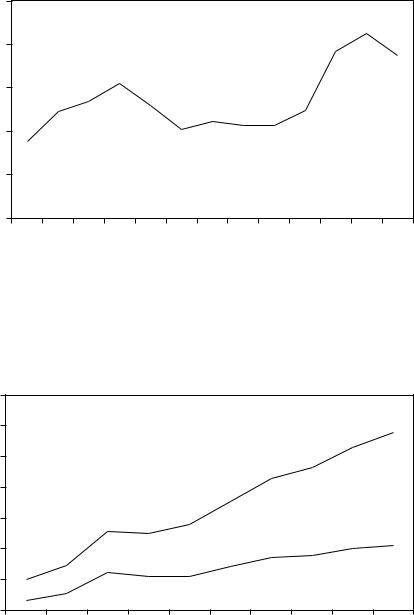
In all economies, the expansion of output is the sum of the change in three components: consumption (both private and government), investment, and net exports of goods and services. Expanding investment has been a major and increasingly important driver of China’s growth. As shown in figure 6.1, investment averaged 36 percent of GDP in the first decade or so of economic reform, relatively high by the standard of developing countries generally but not in comparison with China’s East Asian neighbors when their investment shares were at their highest.5 But since the beginning of the 1990s, China’s average investment rate has been higher and in 1993 and again in 2004–07 exceeded 40 percent of GDP, a level above the experience of China’s East Asian neighbors in their high growth periods.6 Rising investment has been fueled by a rise in the national saving rate, which reached an unprecedented level of more than half of GDP in 2006.7 Rising investment was particularly important in 2001–05, when on average it contributed just over half of China’s economic growth, an unusually high share by international standards.8
The growth of both household and government consumption has been rapid in absolute terms throughout the reform period. But in most years, growth of consumption has lagged the underlying growth of the economy, a lag that has become particularly noticeable since 2000. As shown in figure 6.2, in the 1980s household consumption averaged slightly more than half of GDP. This share fell to an average of 46 percent in the 1990s. But
Peterson Institute for International Economics | www.petersoninstitute.org
SUSTAINING ECONOMIC GROWTH IN CHINA 107
Figure 6.1 Investment as percent of GDP, 1978–2007
percent |
45 |
40 |
35 |
30 |
25 |
20 |
7 |
19781979198019811982198319841985198619871988198919901991199219931994199519961997199819992000200120022003200420052006200 |
Sources: National Bureau of Statistics of China, China Statistical Yearbook 2007; ISI Emerging Markets, CEIC Database.
Figure 6.2 Household consumption as percent of GDP, 1978–2007
percent |
|
|
55 |
|
|
50 |
|
|
45 |
|
|
40 |
|
|
35 |
|
|
30 |
|
|
3 |
6 |
|
197819791980198119821983198419851986198719881989199019911992199 199419951996199719981999200020012002200320042005200 |
2007 |
|
Sources: National Bureau of Statistics of China, China Statistical Yearbook 2007; ISI Emerging Markets, CEIC Database.
Peterson Institute for International Economics | www.petersoninstitute.org
108 CHINA’S RISE
Figure 6.3 Government consumption as percent of GDP, 1978–2007
percent |
17 |
16 |
15 |
14 |
13 |
12 |
11 |
10 |
197819791980198119821983198419851986198719881989199019911992199319941995199619971998199920002001200220032004200520062007 |
Sources: National Bureau of Statistics of China, China Statistical Yearbook 2007; ISI Emerging Markets, CEIC Database.
after 2000, household consumption as a share of GDP fell sharply—and by 2007 accounted for only 35 percent of GDP, the lowest share of any major economy in the world.9 In the United States, household consumption accounted for 70 percent of GDP in the same year.10 In the United Kingdom, it was 63 percent, and in India, 56 percent.11
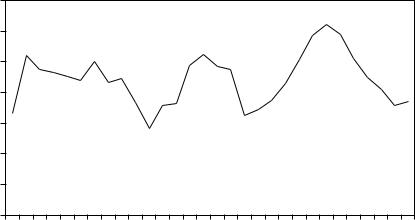
As shown in figure 6.3, government consumption as a share of GDP has been relatively stable, averaging around 14 percent throughout the reform period. But it declined from a peak of over 16 percent of GDP in 2001 to under 14 percent in both 2006 and 2007.
As a result of these trends in household and government consumption, the relative importance of consumption as a source of growth during the past two decades diminished substantially, particularly compared with that of investment. In the first half of the 1980s, consumption growth accounted for almost four-fifths of China’s economic expansion, whereas since 2003, this share has fallen to less than two-fifths.12
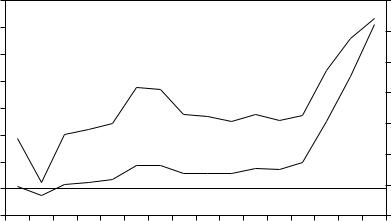
Beginning in 2005 the growth of net exports of goods and services also became, for the first time in almost a decade, a major source of economic growth. As shown in figure 6.4, net exports of goods and services in 2005 more than doubled to reach $125 billion, or 5.4 percent of GDP. They expanded rapidly in the ensuing two years, by 2007 reaching $305 billion, or 8.9 percent of GDP. On average, in 2005–07 the expansion of net exports accounted for over a fifth of China’s growth.13
Peterson Institute for International Economics | www.petersoninstitute.org
|
SUSTAINING ECONOMIC GROWTH IN CHINA 109 |
Figure 6.4 Net exports of goods and services, 1992–2007 |
|
billions of US dollars |
percent of GDP |
350 |
|
10 |
300 |
|
8 |
250 |
|
6 |
|
|
|
200 |
Percent |
4 |
|
||
150 |
of GDP |
|
|
|
|
100 |
|
2 |
Billions of |
|
|
|
0 |
|
50 |
US dollars |
|
|
|
|
0 |
|
–2 |
|
|
|
–50 |
|
–4 |
|
1992 1993 1994 1995 1996 1997 1998 1999 2000 2001 2002 2003 2004 2005 2006 2007 |
|
Sources: National Bureau of Statistics of China, China Statistical Yearbook 2007; ISI Emerging Markets, CEIC Database.
In sum, despite the decision of the Party in 2004 to increase the role of domestic consumption demand in sustaining economic growth, consumption as a share of GDP has continued to fall and its contribution to China’s economic growth has been modest. The government has been successful in slightly moderating the growth of investment. By 2007 the investment share of GDP had fallen by one percentage point and the contribution of investment to GDP expansion had fallen to about two-fifths, substantially less than the extraordinarily high average of 60 percent in 2003–04. On the other hand, net exports of goods and services have soared both absolutely and as a share of GDP, and thus their contribution to economic growth is currently unusually large, leading Premier Wen to opine at the National People’s Congress in the spring of 2006 that “we must strive to reduce our excessively large trade surplus.”
Rethinking China’s Growth Strategy
Several considerations informed the formal decision of China’s leadership in 2004 to rebalance the sources of growth. First, investment-driven growth, or what the Chinese sometimes call extensive growth, appeared to be leading to less efficient use of resources. By some metrics, as investment growth accelerated, the efficiency of resource use declined. Multifac-
Peterson Institute for International Economics | www.petersoninstitute.org
110 CHINA’S RISE
tor productivity growth, a critical contributor to economic expansion in all economies, averaged almost 4 percent per annum in the first 15 years of economic reform (1978–93) but has slowed to only 3 percent since 1993.14 In short, as the investment share of GDP rose, the contribution of productivity improvements to GDP growth fell. In the words of Martin Wolf, chief economics commentator for the Financial Times, the surprising thing about the Chinese economy in recent years is not, as is so frequently asserted, how fast it is growing but rather, given the outsized share of output devoted to investment, that it is not growing even faster.15
The second reason underlying the leadership decision to rebalance the sources of growth is the desire to increase personal consumption and alleviate or at least slow the pace of increasing income inequality. In 2005 personal consumption in China was 30 percent less in real terms than the level that would have been achieved if the household consumption share of GDP had remained at the 1990 level rather than falling by more than 10 percentage points. India offers a useful comparison. In 2004 China’s per capita GDP was two-and-a-half times that of India. But, because household consumption as a share of GDP was so much lower in China, per capita consumption exceeded that in India by only two-thirds.16 The ultimate purpose of economic growth everywhere is to improve human welfare. By this standard, China is falling far below potential.
Similarly, a portion of the increase in income inequality in recent years can be attributed to the highly imbalanced regional pattern of growth. The positive differential in the pace of growth in coastal provinces compared with the national average has increased along with the sharply higher pace of growth of foreign trade (particularly exports) that has occurred since 2000.17 Moving away from heavy reliance on export-led growth thus is consistent with President Hu Jintao’s emphasis on creating a more “harmonious society,” which requires, among other things, more balanced development between coastal and inland areas.
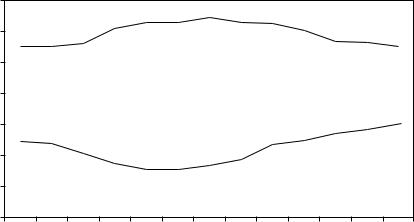
Third, China’s extensive development has generated very modest gains in employment. Between 1978 and 1993, employment expanded by 2.5 percent per annum, but between 1993 and 2004, when the investment share of GDP was much higher than in the 1980s, employment growth slowed to only slightly over 1 percent.18 The recent more capital-intensive pattern of growth contributed to a slower pace of job creation for the simple reason that the steel, aluminum, cement, and other investment goods industries employ far fewer workers per unit of capital than do consumer goods industries, not to mention the even less favorable comparison with services. But, as shown in figure 6.5, as investment boomed and the renminbi became increasingly undervalued, the share of investment in urban areas going to the services sector declined from 63 percent in 1999 and 2000 to 55 percent by 2007. Over the same period, the share of investment going to manufacturing doubled from 15 to 30 percent.19 This clearly slowed the
Peterson Institute for International Economics | www.petersoninstitute.org
SUSTAINING ECONOMIC GROWTH IN CHINA 111
Figure 6.5 Manufacturing and services share of urban investment, 1995–2007
percent |
|
|
|
|
|
|
|
|
|
|
|
|
70 |
|
|
|
|
|
|
|
|
|
|
|
|
60 |
|
|
|
Services |
|
|
|
|
|
|
|
|
50 |
|
|
|
|
|
|
|
|
|
|
|
|
40 |
|
|
|
|
|
|
|
|
|
|
|
|
30 |
|
|
|
|
|
|
|
|
|
|
|
|
20 |
|
|
|
|
|
|
|
|
|
|
|
|
10 |
|
|
|
|
|
|
Manufacturing |
|
|
|
||
|
|
|
|
|
|
|
|
|
|
|
|
|
0 |
|
|
|
|
|
|
|
|
|
|
|
|
1995 |
1996 |
1997 |
1998 |
1999 |
2000 |
2001 |
2002 |
2003 |
2004 |
2005 |
2006 |
2007 |
Note: Investment in services includes property development.
Sources: National Bureau of Statistics of China, China Statistical Yearbook 2007; ISI Emerging Markets, CEIC Database.
rate of growth of job creation compared with what would have occurred with more balanced growth.
The fourth reason China’s leadership wishes to transition to a more consumption-driven growth path is burgeoning energy consumption and its detrimental effects on the environment. Investment-driven growth has required the output of machinery and equipment, and the inputs to produce them, to grow much more rapidly than the output of consumer goods. Rapid growth of output of investment goods, in turn, disproportionately increases the demand for energy.20 China’s energy elasticity of GDP growth (the number of units of energy required to produce an additional unit of output) averaged a modest 0.4 in the 1980s and 1990s, leading over time to a substantial reduction in the amount of energy required to produce each unit of GDP. But this ratio almost tripled to an average of 1.1 in 2001–06.21 Although China continued to achieve energy efficiency gains in the production of virtually all products, from 2001 through 2006 these gains were no longer sufficient to offset the effect of the rapid expansion of the most energy-intensive sectors of manufacturing, especially steel, chemicals, and cement.22
Since two-thirds of China’s energy comes from coal, the burgeoning demand for energy generated by capital-intensive growth boosted coal con-
Peterson Institute for International Economics | www.petersoninstitute.org
112 CHINA’S RISE
sumption by two-thirds between 2000 and 2005. Coal consumption reached more than 2 billion tons in 2005, almost twice the level of coal consumption in the United States, even though China’s economy is only one-sixth the size of that of the United States. As a result, China is now the largest emitter of greenhouse gases. China is home to 16 of the 20 cities with the worst air pollution on the globe. Because of the massive increase in coal consumption, the State Environmental Protection Agency (SEPA) reported that rather than sulfur dioxide emissions declining in 2000–2005 by 10 percent to 18 million tons as planned, they rose to 25.5 million tons by 2005, 42 percent above the goal.23
A fifth factor motivating China’s leadership is less obvious but still important. Excessive reliance on investment and net exports to drive growth threatens to undo some of the progress China has made in recent years in developing a commercial banking system. A critical component of this process has been the injection of almost RMB4 trillion ($500 billion), mostly from the government, to cover past loan losses and to raise capital adequacy to meet prudential standards.24
Excess investment in some sectors of manufacturing could eventually lead to excess capacity and falling prices, which could create a new wave of nonperforming loans. These loans would erode the substantial improvements that state-owned banks have made in their balance sheets over the past few years and could push some city commercial banks, which on average are far weaker, into insolvency. An undervalued currency naturally raises profitability in the export sector—i.e., manufactur- ing—and thus tends to tilt investment in that direction. This has certainly been the case in China in recent years, where, as already noted, the share of investment going into manufacturing has doubled. Part of this shift of investment toward manufacturing reflects the increased demand for capital goods associated with the rapidly rising rate of investment in the first half of this decade (figure 6.1). But this shift has almost certainly been reinforced by the fillip to manufacturing profitability provided by an increasingly undervalued currency.
The National Development and Reform Commission (NDRC) has acknowledged that excess investment will have adverse financial consequences.25 In its report to the National People’s Congress in 2006, it pointed out that “adverse effects of surplus production capacity in some industries have begun to emerge. Prices for the products of these industries dropped and inventories grew, corporate profits shrank and losses mounted, and potential financial risk has increased.”
The rapid increase in the magnitude of financial losses of unprofitable industrial enterprises supports this analysis. As shown in figure 6.6, after several years of stability, losses more than doubled in 2003–06 and then fell slightly in 2007. Since net profits of all enterprises rose sharply in this period (see figure 6.7), the dispersion of the profitability of China’s industrial firms has apparently sharply increased over the past three years.
Peterson Institute for International Economics | www.petersoninstitute.org
SUSTAINING ECONOMIC GROWTH IN CHINA 113
Figure 6.6 Losses of unprofitable industrial enterprises, 1995–2007(e)
billions of renminbi
250 |
|
|
|
|
|
|
|
|
|
|
|
200 |
|
|
|
|
|
|
|
|
|
|
|
150 |
|
|
|
|
|
|
|
|
|
|
|
100 |
|
|
|
|
|
|
|
|
|
|
|
50 |
|
|
|
|
|
|
|
|
|
|
|
0 |
|
|
|
|
|
|
|
|
|
|
|
1995 |
1996 |
1997 |
1998 |
1999 |
2000 |
2001 |
2002 |
2003 |
2004 |
2005 |
2006 2007(e) |
(e) = estimate
Sources: National Bureau of Statistics of China, China Statistical Yearbook 2007; ISI Emerging Markets, CEIC Database; author’s calculations.
Figure 6.7 Industry profits as percent of GDP, 1998–2007(e)
percent |
|
|
|
|
|
|
|
|
|
14 |
|
|
|
|
|
|
|
|
|
12 |
|
|
|
|
|
|
|
|
|
10 |
|
|
|
|
|
|
|
|
|
8 |
|
|
|
All industrial |
|
|
|
|
|
|
|
|
|
enterprises |
|
|
|
|
|
6 |
|
|
|
|
|
State-owned and |
|
||
|
|
|
|
|
|
state-controlled |
|
||
4 |
|
|
|
|
|
industrial enterprises |
|
||
|
|
|
|
|
|
|
|
|
|
2 |
|
|
|
|
|
|
|
|
|
0 |
|
|
|
|
|
|
|
|
|
1998 |
1999 |
2000 |
2001 |
2002 |
2003 |
2004 |
2005 |
2006 |
2007(e) |
(e) = estimate
Sources: National Bureau of Statistics of China, China Statistical Yearbook 2007.
Peterson Institute for International Economics | www.petersoninstitute.org
114 CHINA’S RISE
The continued decline in the share of nonperforming loans in the banking system in the past few years is not necessarily a sign that all is well. By 2007, on the back of five consecutive years of double-digit growth and an increasingly undervalued currency, profitability in the tradable goods sector—i.e., manufacturing—had surged to unprecedented levels (see figure 6.7). Thus most corporates have been in a strong position to service their bank debt. Distress in the banking system could emerge, however, either from a slowdown in economic growth over the next few years or from a significant appreciation of the currency. The former would reduce profitability throughout the economy while the latter would concentrate the reduction in profits to firms producing tradable goods. In either case the ability of firms to service their bank debt could be impaired.26
A final factor underlining the leadership’s desire to transition to a more consumption-oriented growth path is that excessive reliance on expansion of net exports—i.e., a growing trade surplus—raises the prospect of a protectionist backlash in the United States, Europe, and other important markets for Chinese exports. China’s central bank, the People’s Bank of China, was perhaps the first to explicitly acknowledge this factor in its Report on the Implementation of Monetary Policy 2005Q2, in which it candidly stated that China’s excessive trade surplus “will escalate trade frictions.”27
In sum, for a variety of reasons China’s top political leadership and its leading economic advisory institutions came to the view by late 2004 that sustaining long-term rapid growth required a significant modification of the underlying growth strategy.
Implications for the Global Economy
If realized, China’s new growth strategy would have positive implications not only for China but also for the global economy. As shown in figure 6.8, China’s current account surplus has soared in recent years. In 2006 it reached $249 billion, making China, for the first time, the world’s largest global current account surplus country. The surplus expanded further to $372 billion, or 11 percent of GDP in 2007, both unprecedented for a large country that is not a large exporter of resources such as oil.28 In 2007 China’s current account surplus as a share of GDP was almost three times that of Japan in the mid-1980s when its current account surplus as a share of GDP peaked. China now is the second largest contributor to global economic imbalances, after only the United States, which has the world’s largest current account deficit. China’s successful transition to a pattern of growth driven more by domestic consumption demand necessarily entails a reduction in China’s national saving rate relative to its investment rate. That, in turn, would reduce China’s current account surplus. Thus rebalancing of China’s economic growth would contribute to a reduction of global economic imbalances as well.
Peterson Institute for International Economics | www.petersoninstitute.org