

EARTHEN BUILDING MATERIALS
Ex. 18A PARTICLE SIZE ANALYSIS: PART I / SIEVING PROCEDURE
REFERENCES: ASTM D422-63; BS1377: 1975, Test 7(B)
INTRODUCTION/AIM
A soil consists of an assemblage of discrete particles of various shapes and sizes. The types and relative proportions of these particles give the soil a particular character and behavior. The aim of particle size analysis (or particle size distribution tests) is to group these particles into separate ranges of sizes and so determine the relative proportions, by dry weight, of each size range.
Particle size distribution tests can be divided into two basic groups: sieving procedures for "coarse" particles (gravel and sand) and sedimentation procedures for "fine" particles (silt and clay). The procedure described below is a composite method for the analysis of soils containing both coarse and fine particles. Part I outlines the preparation of the sample and the sieving procedure. Part II describes the sedimentation procedure for fine particles.
DEFINITIONS
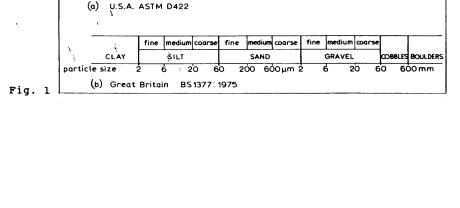
Particle size is usually given in terms of equivalent particle diameter. Definitions vary according to the standard consulted. The British Standard employs the following definitions:
−Gravel: Particles from 2 mm to 60 mm.
−Sand: Particles from 60 µm to 2 mm.
−Silt: Particles from 2 µm to 60 µm.
−Clay: Particles smaller than 2 µm.
The American (ATSM) standard is slightly different. A comparison of the ASTM with the British system is shown below.
73
Ex. 18A (continued)
EQUIPMENT/CHEMICALS
−Mortar with rubber-covered pestle
−Balance sensitive to 0.01 gram
−Standard drying oven
−A series of sieves, of square mesh woven wire cloth, ranging in size from 20 mm to 75 µm (see Procedure for exact sizes)
−Mechanical sieve shaker
−Sieve brushes
−Porcelain evaporation dish
−600 ml beaker
−250 ml cylinder
−Glass stirring rod
−Magnetic stirrer with teflon-coated stirring rod, 5 cm long
−4% Solution of sodium hexametaphosphate (40 grams dissolved in
1 liter of distilled water)
−Data sheet
PROCEDURE
1. Sample: The most important requirement for any test sample is that it be fully representative of the material from which it is taken. Both the quantity of the sample material and the selection procedure are extremely important in this regard.
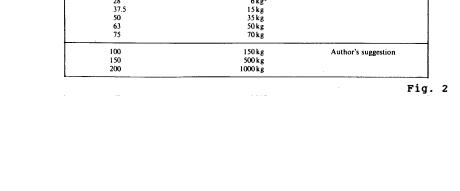
Quantity: For testing purposes, a sample smaller than the received sample is usually required. The actual quantity to be analyzed is usually determined by the size of the largest particles present. For clays, silts, and sand, a sample size of about 100 grams is sufficient; with gravel size particles, much larger quantities are required. The following table can be considered a guide to the minimum quantity of material required for particle size distribution tests. The recommendations relate to the maximum size of particle present in substantial proportion' (more than 10% of the total sample):
Ex. 18A (continued)
Selection: Once the desired quantity of test material has been established, select the test sample from the original material so that it is truly representative (a single scoopful from a bag of material does not, for example, truly represent the whole). With cohesive soils (silts and clays), this should be done by randomly spooning the soil and regularly remixing the remaining stock until the necessary quantity is obtained.
2.Sample Preparation: Once a suitable sample is selected, crush it lightly in a mortar with a rubber-covered pestle to break down aggregations of particles. The rubber-covered pestle prevents the crushing of individual particles which must remain intact for particle size analysis.
After crushing, place the sample in an evaporating dish and dry overnight in an oven maintained at 105-110°C. After drying to constant weight, allow the whole specimen to cool, and then weigh it to the nearest 0.01 g.*
*There is some disagreement about the effects of oven drying on test results. ASTM D421 recommends only air-drying of soil samples, as does the British Standard. Nevertheless, whereas oven drying may have a deleterious effect on samples used for the plastic limit test, it is usually not a significant factor for the normal use of the particle size curve. It can therefore be safely used in the preparation of samples for particle size analysis.
3.Pre-treatment/Dispersion of Sample: Clayey and silty soils must first be pre-treated for the subsequent sedimentation test. This pre-treatment involves the use of a dispersing agent to ensure complete separation (or dispersion) of discrete particles of soil in the silt to clay range.
Numerous substances have been tried as dispersing agents, butthe
usual choice is sodium hexametaphosphate (1.1 Na20 : 1 P205) known commercially as Calgon.
This is prepared in a standard 4% solution by mixing 40 grams of dry material with enough distilled water to make 1000 mL. The solution should be freshly mixed and never over 1 month old.
After weighing, transfer the dried and crushed sample material to a 600 mL beaker and cover with about 200 mL of 4% sodium h`exametaphosphate solution. Stir until the soil is completely wet and allow to stand for at least one hour (some standards recommend an overnight standing period).
After this standing period, complete the dispersion of the particles by using a magnetic stirrer. Successful results have been achieved by stirring the mixture at high speed for 15 minutes using a 5 cm Teflon-coated stirring bar.
74 |
75 |
|
Ex. 18A (continued)
4.Washing: Transfer the soil and solution to a 75 µm
(N°200) sieve nested on a receiver. Carefully wash the soil with a jet of distilled water until all fine material is washed through the sieve (until the water is clear). The amount of water should not exceed 500 mL. Be very careful not to lose any soil by splashing the material out of the sieve or by allowing the water to overflow.
The material collected in the receiver will be used for the appropriate sedimentation test (Particle Size Analysis: Part II). Put it aside.
5.Transfer (by backwashing) the material retained on the 75 µm sieve to a weighed evaporating dish and let it stand for a short period of time until the top of the suspension becomes clear. Pour off as much of the clear water as possible; then place the dish with the remaining soil/water suspension in the oven for drying.
6.Sieving Procedure:When the material in the evaporating dish is dry, allow it to cool and weigh it.
Immediately thereafter, run the sample through a stack of sieves varying from larger sizes to smaller sizes from the top down. A sieve stack usually consists of 6 or 7 sieves with the sizes approximately doubling in opening from the bottom to the top sieve (as 6, 12, 24 mm, ...). Some recommended sieve stacks (see footnotes) for sandy to fine-grained soils are shown below:
Brockville1 |
|
|
NBS2 |
|
|
N° 4 |
4.75 |
mm |
N°16 |
1.18 |
mm |
10 |
2.00 |
mm |
30 |
600 |
µm |
20 |
850 |
µm |
50 |
300 |
µm |
40 |
425 |
µm |
100 |
150 |
µm |
60 |
250 |
µm |
200 |
75 |
µm |
140 |
106 |
µm |
270 |
53 |
µm |
200 |
75 |
µm |
400 |
38 |
µm |
ASTM3 |
|
|
|
|
|
N° 4 |
4.75 |
mm |
|
|
|
8 |
2.36 |
mm |
|
|
|
16 |
1.18 |
mm |
|
|
|
30 |
600 |
µm |
|
|
|
50 |
300 |
µm |
|
|
|
100 |
150 |
µm |
|
|
|
200 |
75 |
µm |
|
|
|
Ex. 18A (continued)
Place the stack of sieves in a mechanical shaker for 5 to 10 minutes, depending on the quantity of material. If this is not available, shake by hand for about 10 minutes.
Remove the stack of sieves from the shaker and record the weight of material remaining on each sieve. Any particles lodged in the apertures of the sieve should be carefully removed with a sieve brush. Weights should be recorded to the nearest 0.01 g on the test sheet (attached).
Sum the weights and compare to the weight obtained at the beginning of Step 5. A loss of more than 2 percent by weight of the retained sample is considered unsatisfactory and the test should be repeated.
Any material passing the 75 µm sieve should be added to the material for the sedimentation test.
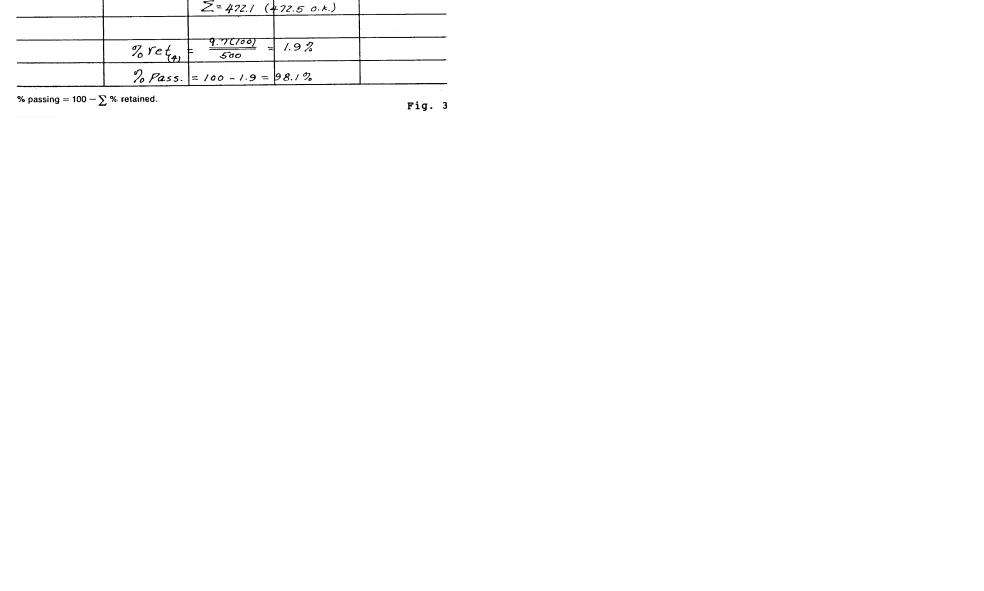
7.Calculations: In order to draw up a particle size distribution curve, it is necessary to calculate the cumulative percentage (by mass) of particles finer than each sieve aperture size -- that is, passing each sieve. This can be done in the following way (see sample data sheet: Fig. 3):
First: Compute the percent retained on each sieve by dividing the weight retained on each sieve by the original weight obtained in Step 2. Record on the attached data sheet.
Second: Compute the percent passing (or percent finer) by starting with 100 percent and subtracting the percent retained on each sieve as a cumulative procedure. For example, as seen in the sample
data sheet (Fig. 3), the quantity of 9.7 g was retained on the N°4 sieve; the percent retained is 9.7/500 g x 100 1.9%. The percent passing (not retained) = 100% - 1.9% or 98.1%.
On the N°10 sieve, 39.5 g were retained; the percent retained is 39.5/500 g x 100 7.9%. The percent passing is 98.1% (that retained on the previous sieve) - 7.9% =
90.2%. Stated simply:
Percent passing = Percent arriving - Percent retained
8.Graph: Make a semilogarithmic plot of grain size versus percent finer using the graph on the attached data sheet (see sample, Fig. 4).
9.Sedimentation Test: Using the portion of fine sample set aside
in S e p 4 (plus any particles that passed the 75 µm sieve during dry sieving), proceed to the sedimentation procedure: Exercise 18B: Particle Size Analysis/Part II.
76 |
77 |
Ex. 18A (continued) |
Ex. 18A (continued) |
SAMPLE DATA SHEET: GRAIN SIZE ANALYSIS-MECHANICAL
SAMPLE DATA SHEET: GRAIN SIZE DISTRIBUTION
79

Ex. 18A (continued)
FOOTNOTES (see Bibliography for complete references)
1.Brockville Laboratory Exercises, p. 41.
2.Clifton, James R. et al., p. 17.
3.ASTM, p. 118.
FIGURE CREDITS (see Bibliography for complete references)
1.Head, K.H., p. 146.
2.Head, K.H., p. 153.
3.Brockville Laboratory Exercises, p. 43.
4.Brockville Laboratory Exercises, p. 44. BIBLIOGRAPHY
ASTM. Annual Book of ASTM Standards 1985. Volume 04.08: Soil and Rock; Building Stones. Philadelphia, Pennsylvania: ASTM, 1985.
Clifton, James R. - Brown, Paul W. - Robbins, Carl R. Methods for characterizing adobe building materials. NBS Technical Note N°977.Washington, D.C.: U.S. Department of Commerce, 1978.
Head, K.H. Manual of soil laboratory testing. Volume 1: soil classification and compaction tests. London: Pentech Press, 1980.
St. Lawrence College. Laboratory exercises. St. Lawrence College, Brockville, Ontario, Canada.
80
Ex. 18A (continued)
DATA SHEET: GRAIN SIZE ANALYSIS-MECHANICAL
81

Ex. 18A (continued)
DATA SHEET: GRAIN SIZE DISTRIBUTION
Ex. 18B PARTICLE SIZE ANALYSIS: PART II SEDIMENTATION PROCEDURE: HYDROMETER METHOD
INTRODUCTION / SEDIMENTATION THEORY
The theory of sedimentation is based on the fact that large particles in suspension in a liquid settle more quickly than small particles, assuming that all particles have similar densities and shapes. The velocity which a falling particle eventually reaches is known as its terminal velocity. If the particles are approximately spherical, the relationship between terminal velocity (V) and the particle diameter
(D) is given by Stokes's Law (after the English physicist, Sir George Stokes, 1891). This law states that the terminal velocity is proportional to the square of the particle diameter or:
Though clay particles are certainly not spherical, the application of Stokes's Law provides a basis for the comparison of particle size distribution in fine soils which is sufficiently realistic for most practical purposes.l
SEDIMENTATION PROCEDURE: HYDROMETER METHOD
In a sedimentation procedure, a suspension of a known mass of fine soil particles of various sizes is made up in a known volume of water. The particles are allowed to settle under gravity. Since they settle at different rates, the number of each particle size in suspension will change as a function of time. Thus, by measuring the density of the suspension at a constant depth at known intervals of time and then applying Stokes's Law, we can assess the distribution of particle sizes.
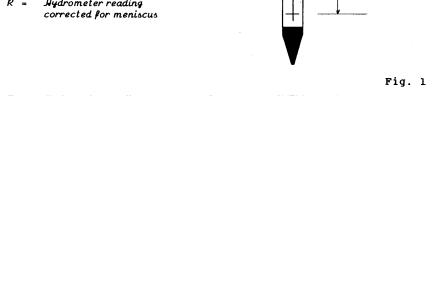
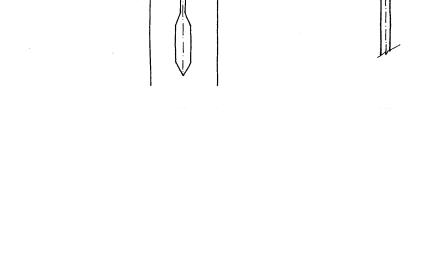
A special instrument called an hydrometer (Fig. 1) is used to measure the specific gravity of the soil-water suspension at a particular depth (the center of the hydrometer bulb). Any soil grains larger than those still in suspension in the zone known as L (the distance from the center of the bulb to the water surface) have fallen below the center of the volume, and this decreases the specific gravity (or density) of the suspension at the center of the bulb. Also, since the hydrometer is a constant weight, the lower the specific gravity of the suspension, the deeper the hydrometer will sink into the suspension. Temperature must be carefully controlled because the density of water decreases as the temperature rises (or falls) from 4°C. ;
83
82
Ex. 18B (continued)
EQUIPMENT
−Soil Hydrometer calibrated to read either specific gravity of the suspension or grams per liter of suspension. The latter type (specifically Model 152H) is recommended by ASTM:
−Two 1000 mL glass measuring cylinders about 330 mm high marked at 1000 mL, with stoppers or rubber bungs (also called hydrometer jars).
−Constant temperature bath (optional)
−Glass rod, about 12 mm in diameter and 400 mm in length
−Thermometer
−Stopwatch
−Plastic wash bottle
PROCEDURE |
|
1. Preparation___ of_ the _ Suspension: |
Take the suspension of |
pretreated soil which passed the 75 µm sieve in Part I (plus any material which passed the 75 µm sieve in dry sieving) and transfer to one of the 1000 mL sedimentation cylinders. Add distilled water2 to the 1000 mL mark.
Fill the second cylinder (the control cylinder for holding the hydrometer between readings) with distilled water.3
84
Ex. 18b (continued)
Place both cylinders in the constant temperature bath set at 25°C, until they have reached the bath temperature. If a bath is not available, make sure the distilled water temperature is adjusted so that both the sedimentation and control cylinders are at the same temperature.
Take a rubber stopper and cap the sedimentation cylinder to obtain a water-tight fit. Carefully shake the cylinder to obtain a uniform suspension. If necessary, stir the sediment with a .glass rod to make sure it all goes into suspension. Invert the cylinder for a few seconds and then place it in an upright position (in the constant temperature bath, if used).
Start the stopwatch.
2.Hydrometer Readings: Remove the rubber stopper from the sedimentation cylinder and steadily insert the hydrometer so that it floats freely in the suspension. It must not be allowed to bob up and down or to rotate when let go.
Take readings at the top of the meniscus level (see Fig. 2) at the following times from zero: 1/2, 1, 2, and 4 minutes. Also take a thermometer reading.
Slowly remove the hydrometer, rinse in distilled water, and place it in the control cylinder (which should be within 1°C of the soil-water suspension). Do the same with the thermometer. Take a meniscus reading in the control cylinder on the hydrometer.
Replace the rubber stopper in the sedimentation cylinder, reagitate the suspension, and take another set of 1/2, 1, 2, and 4 minute readings. Repeat until you obtain two sets of readings that agree within one unit of each other for all four readings. (Insert and withdraw the hydrometer carefully to avoid unnecessary agitation. Each operation should take about 10 seconds).
When agreement between readings is reached, take additional readings at elapsed times of 8, 15, 30, 60 minutes and 1, 2, 4, 8, 16, 32, 64, 96 hours. It is not necessary to keep rigidly to these times as long as the time of each reading is carefully recorded on the data sheet (attached).
Record the temperature of the soil-water suspension to the nearest 1°C for each hydrometer reading.
After each reading, remove both the hydrometer and the thermometer and place in the control cylinder (which should be at the same temperature).
85
Ex. 18B (continued)
3.Correction of Hydrometer Readings: Each hydrometer reading (Ra) must be subjected to four corrections. These are:
(a)Meniscus correction (Cm)
(b)Temperature correction (Ct)
(c)Dispersing agent correction (x)
(d)Correction for unit weight of solids (a)
These are obtained as described below.
(a) Meniscus Correction: A hydrometer is calibrated to
read correctly at the surface of the liquid in which it is immersed (bottom of the meniscus). Soil suspensions, however, are not clear enough to allow a reading at this level, so the scale has to be read at the upper rim of the meniscus. A meniscus correction (Cm) must therefore be added to each actual, reading (Ra) in order to obtain the true reading. The Cm is a constant for each hydrometer and is calculated as follows:
Insert the hydrometer in a 1000 mL cylinder three quarters full of distilled water. The plane of the surface of the liquid is seen as an ellipse from just below the surface. Raise the eye until the surface is seen as a straight line and take a reading
(A) (see Fig. 2). Take a second reading at the upper level of the meniscus (B). The meniscus correction is the difference between the two readings multipled by 1000.
The true hydrometer reading (R) = Ra (actual reading) - Cm
Ex. 18B (continued)
(b)Temperature correction (Ct): Hydrometers are calibrated at 20°C. If a test is carried out at a different temperature, both the density of the water and the density of the hydrometer (owing to thermal expansion of the glass) will be different. These factors are corrected by constant values
given in Table 1. The value of Ct is always added to the true hydrometer reading (R).
(c)Dispersing agent correction (x): The addition of the dispersing agent results in the density of the liquid in which sedimentation takes place being greater than that of water. The correction (x) can be determined in two ways:
1.To determine the correction (x), a volume of exactly 50 mL of the standard dispersing solution is placed in a weighed evaporating dish. The water is evaporated by oven drying at 105-110°C and the mass of the remaining dispersing agent (Md) is determined.
The correction (x) = 2Md
This is subtracted from the true hydrometer reading (R).
2.Alternatively, the correction (x) is determined by using a sedimentation cylinder of water from the same source, at the same temperature, and with the same quantity of dispersing agent as used in the soil-water suspension. A reading of less than zero in this standard cylinder of water is recorded as a (-) value; a reading between 0 and 60 is recorded as a (+) value. All readings are taken at the top of the meniscus. Again, the correction (x) is subtracted from (R).This is also called the "zero correction".
(d)Correction for unit weight of solids (a): The hydrometer
is calibrated to read grams of soil of a value of Gs = 2.65 in 1000 cm3 of suspension at a temperature of 20°C.If the
specific gravity(Gs) of the soil grains is not 2.65, a correction factor (a) must be computed.Typical values are given in Table 2.
To facilitate calculations, a combined correction factor
(K) which combines both temperature and unit weight of solids is usually adopted. (K) values are shown in Table 3.
87
86
Ex. 18B (continued)
4. Calculations:
(a) Apply the meniscus correction to the hydrometer readings and use Table 4 to obtain values of L (effective depth). Record these on the attached data sheet.
(b)If Gs is not known, assume a reasonable value between 2.68 and
2.74.With Gs and the test temperature for any hydrometer reading, use Table 3 to obtain the K value.
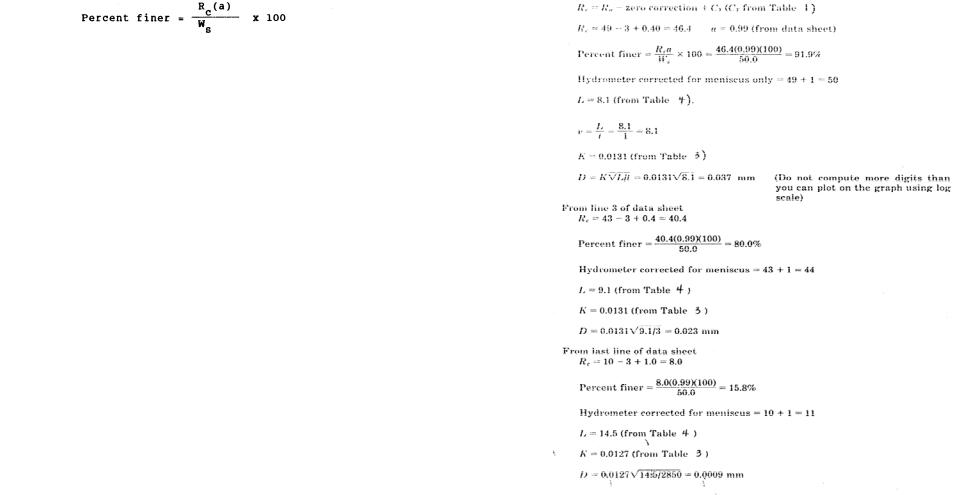
(c)With the values of K, L and the elapsed time (t), compute the values of D (particle diameter) using the following equation:
Use sample computations (Fig. 3) and sample data sheet (Fig. 4) as a guide.
Record values for each (t) on the data sheet.
(d) Calculate a corrected value of Rc using the equation: Rc = Ractual - zero correction (x) + Ct (Table 1)
(e)Calculate the percent finer for the corresponding particle diameters (D) by using the formula:
where Rc = corrected hydrometer reading
Ws = weight of original soil sample in suspension a = unit weight of solids correction (Table 2)
Record values on the data sheet.
(f)Using the data from steps (a) to (e) above, plot the percent finer versus grain size either on the graph used for the dry sieve analysis or on a new graph.
88
Ex. 18B (continued)
Fig. 3 SAMPLE COMPUTATIONS
89
Ex. 18B (continued) |
Ex. 18B (continued) |
Fig. 4 SAMPLE DATA SHEET |
CORRECTION TABLES 1,2,3 |
|
90

Ex. 18B (continued)
CORRECTION TABLE 4
Table 4: Values of L (Effective Depth) for Use in Stokes's Formula for Diameters of Particles for ASTM Soil Hydrometer 152H
Ex. 18B (continued)
FOOTNOTES (see Bibliography for complete references)
1.Head, K.H., pp. 182-183.
2.ASTM recommends the use of distilled water, as does the British Standard. Other authors (see Brockville laboratory exercises) feel that tap water is satisfactory for most laboratory purposes.
3.Some authors recommend using the dispersant solution in the control cylinder as well as the sedimentation cylinder (see Brockville laboratory exercises).
FIGURE CREDITS (see Bibliography for complete references)
Fig. 2 Head, K.H., p. 202.
Fig. 3 Brockville laboratory exercises, p. 56.
Fig. 4 Brockville laboratory exercises, p. 57.
Table 1. Brockville laboratory exercises, p. 58.
Table 2. Brockville laboratory exercises, p. 58.
Table 3. Brockville laboratory exercises, p. 59.
Table 4. Brockville laboratory exercises, p. 59.
BIBLIOGRAPHY
ASTM. Annual Book of ASTM Standards 1985. Volume 04.08: Soil and Rock; Building Stones. Philadelphia, Pennsylvania: ASTM, 1985.
Clifton, James R. - Brown, Paul W. - Robbins, Carl R. Methods
for characterizing adobe building materials. |
NBS Technical |
Note N°977. Washington, D.C.: U.S. Department of Commerce, 1978.
Head, K.H. Manual of soil laboratory testing. Volume 1: soil classification and compaction tests. London: Pentech Press, 1980.
St. Lawrence College. |
Laboratory exercises. |
St. Lawrence |
College, Brockville, Ontario, Canada. |
|
|
93
92

Ex. |
18B (continued) |
Ex. 18B (continued) |
DATA |
SHEET: GRAIN SIZE ANALYSIS-HYDROMETER METHOD |
DATA SHEET: GRAIN SIZE DISTRIBUTION |
94
EX. 19 PLASTIC LIMIT OF SOILS
REFERENCES: ASTM D4318-84; BS1377: 1975, Test
3 INTRODUCTION
The behavior of soil is related to the amount of water in its structure. At high water contents, soils are suspensions with the flow properties of liquids. As the water content decreases, the soil becomes consecutively pastelike, sticky, then plastic; at a low water content, the soil has the properties of a solid. The physical state of a soil at a given water content is termed consistency, which is a measure of the resistance of a soil to flow.
In 1911, the Swedish scientist Dr. A. Atterberg defined the boundaries in a soil's condition as "limits". The liquid limit, plastic limit, and shrinkage limit are the standard tests for determining these boundaries. The following exercise outlines the procedures for the plastic limit test.
(The plastic limit test can be performed on cohesive and semi-cohesive soils such as organic and inorganic clays, tuff or fine grain materials, adobe, etc. It is not possible to make a plastic limit test on sand or gravel, peat or similar materials.)
DEFINITIONS
Plastic Limit: The plastic limit of a soil is the water content, expressed as a percentage of the mass of the oven-dried soil, at the boundary between the plastic and semi-solid states. The water content at this boundary is arbitrarily defined as the lowest water content at which the soil can be rolled into threads 3 mm (1/8") in diameter without the threads' breaking into pieces.
EQUIPMENT
−The most important piece of apparatus is the HAND of the operator which should be clean and free from grease
− Spatula (blade about 75 mm x 2 0 mm)
−Surface for rolling: ground glass plate or non-absorbent paper
−Soil sample containers
−Evaporating dish
−Balance sensitive to 0.01 g
−A short length (about 100 mm) of 3 mm diameter metal rod
−Distilled water.
Ex. 19 (continued)
PROCEDURE
1.Preparation of the sample: Take about 15-20 grams of the soil sample that has passed the N°40 (425 µm) sieve, obtained according to the Sample Preparation. Method in Appendix A.
2.Rolling into a ball: Place the air-dried soil in an evaporation dish and thoroughly mix with distilled water until the mass becomes plastic enough to be easily shaped into a ball (without sticking .to the fingers excessively when squeezed). Take a portion of this ball weighing about 8 g (or about half of the sample) for the test sample.
3.Rolling into threads: Squeeze and form the 8 g test sample into a round ellipsoidal-shaped mass.
Roll the sample between the fingers of one hand and the ground glass plate (or piece of non-absorbent paper) which should be lying on a smooth horizontal surface. Use sufficient pressure to roll the mass into a thread of uniform diameter across its length. Move your hand (with fingers outstretched) across the sample to develop this uniformity in diameter.
The rate of rolling should be between 80 and 90 strokes per minute. A stroke is counted as one complete motion of the hand forward and back to starting position again.
The pressure should reduce the diameter of the thread to about 3 mm after between 5 and 10 strokes. It is important to maintain a uniform rolling pressure as the thread approaches 3 mm.
When the diameter of the thread becomes 3 mm (use the metal rod as a guide), break the thread into 6 or 8 pieces. Squeeze these pieces together between the thumbs and fingers of both hands into a rough ball and repeat the entire process again. You will note that water from the sample is evaporating into the air; the sample is thus becoming progressively drier.
Continue this alternate rolling to a 3 mm (1/8") diameter thread, gathering together, kneading and rerolling, until the thread crumbles under the pressure required for rolling and the soil can no longer be rolled into a thread. The first crumbling point is the plastic limit.
The crumbling may occur when the thread has a diameter greater\than 3R mm. This should be considered a satisfactory end point, provided the soil has been previously rolled into a 3 mm diameter thread. (If the soil thread breaks before it has initially been rolled down to the 3 mm
97
96
Ex. 19 (continued)
diameter, the moisture content is less than that for the plastic limit and more water should be added to the sample.) Crumbling will manifest itself differently in different types of soil.
Some soils will fall apart in very small particles.
Other soils form an outside tubular layer that starts splitting at both ends. The splitting progresses toward the middle and finally the thread falls apart in many small plate-like particles.
Heavy clay soils will require considerable pressure to deform the threads, particularly as they approach the plastic limit. This type of soil usually breaks into a series of barrel-shaped segments each about 6 mm (1/4") to 9 mm (3/8") in length.
4.Moisture Content Measurement: When the plastic limit has been reached, place the crumbled soil samples in a numbered and weighed
moisture content container (M1). Cover the container immediately to avoid change in weight of the sample by evaporation.
Weigh the container and the soil and record the combined mass (M2) on the attached data sheet. Place the container, with the cover removed, in an oven (the vents of the oven must be open to allow the moisture to escape to the outside air).
Dry the soil to constant mass at 110°C ± 5°C. Normally, a drying period of 24 hours is satisfactory.
Remove the sample from the oven, replace the cover on the container and allow it to cool at room temperature. Weigh the container and oven-dried sample on the same balance previously used. Record the
mass (M3) on the data sheet. Record the loss in mass as the mass of water (M2 - M3).
5.Calculations: Calculate the plastic limit, expressed as the water content in percentage of the mass of the oven-dry soil, as follows:
Plastic limit |
mass of water |
x 100 |
|
|
|
mass of oven-dry soil |
|
Record |
the plastic limit to the nearest whole number on the data |
||
sheet. |
|
|
|
6.Repeat Tests: It is usually desirable to obtain three determinations which can be averaged to give the plastic
limit. Thus, repeat steps 2 through 5 for three other samples of the subject soil. The standard deviations should be within 10 percent of the average values.
98
Ex. 19 (continued)
BIBLIOGRAPHY
ASTM. Annual Book of ASTM Standards 1985. Volume 04.08: Soil and Rock; Building Stones. Philadelphia, Pennsylvania: ASTM, 1985.
Clifton, James R. - Brown, Paul W. - Robbins, Carl R. Methods for characterizing adobe building materials. NBS Technical Note N°977. Washington, D.C.: U.S. Department of Commerce, 1978.
Head, K.H. Manual of soil laboratory testing. Volume 1: soil classification and compaction tests. London: Pentech Press, 1980.
Soiltest, Inc. Test for plastic limit and plasticity index of soils (slide/tape set). Chicago, Illinois: Soiltest, Inc., 1963.
99

Ex. 19 (continued)
DATA SHEET: PLASTIC LIMIT OF SOILS
Ex. 19 (continued)
APPENDIX A: PREPARATION OF SAMPLE FOR LIQUID/PLASTIC LIMIT TESTS
1. Expose the soil sample from the field to the air at room temperature until it is thoroughly dry. (Samples should
not be oven-dried prior to testing. Even controlled temperatures can alter the soil in various ways.)
2. If necessary, break up the aggregations of soil in a mortar with a rubber-covered pestle.
3. Sieve the pestled soil by hand through a 425 pm sieve nested on a receiving pan. About 250 grams of sieved dry soil is necessary for the two tests.
* If the soil is predominantly clay, it is preferable to take the soil in its natural state (without drying) and to remove coarse particles by hand during the mixing process. organic soils, and most tropical soils, should always be tested in their natural condition.
Natural soil can be cut up into smali pieces with a cheese grater.
101
100

Ex. 20 LIQUID LIMIT OF SOILS
REFERENCES: ASTM D4318-84; BS1377: 1975, Test 2
DEFINITIONS
Liquid Limit: The water content, expressed as a percentage of the oven-dried soil, at the boundary between the liquid and plastic states. The water content at this boundary is arbitrarily defined as the water content at which two halves of a soil cake placed in a Casagrande device flow together for a distance of 1/2 inch (12.7 mm) along the bottom of the groove separating the two halves, when the cup is dropped 25 times for a distance of 1 cm (0.3937 inch) at the rate of 2 drops/second.
EQUIPMENT
−Porcelain evaporating dish (about 115 mm in diameter)
−Mixing spatulas (blade about 100 mm x 30 mm)
−Casagrande device and grooving tool (see below)
−Aluminum soil sample containers
−Balance sensitive to 0.01 gram
−Stopwatch
−Distilled water.
−
PROCEDURE:
1. Adjustment of the Apparatus: The Casagrande Device (named after A. Casagrande who designed it in 1932) must be clean and the cup must be dry and oil-free. Check that the cup moves freely but without too much side-play. Make sure the screws connecting the hanger arm are tight and that a groove has not
been worn into the bowl through long usage.
102
Ex. 20 (continued)
Check the grooving tool to be sure that it conforms to the dimensions shown in Fig. 2 below.
Place the machine on a firm solid base so that it will not wobble. Using the rectangular element on the handle of the gauging tool and the adjustment plate, adjust the height to which the cup is lifted so that it is exactly 1 cm above the base (Fig. 3). Check the adjustment by revolving the crank rapidly several times. If the adjustment is correct, a slight ringing sound will be heard when the cam strikes the cam follower.
103

Ex. 20 (continued)
2.Sample: Take about 100 grams of the sample material that has passed the N°40 (425 µm) sieve, obtained according to the Sample Preparation Method in Appendix A.
3.Mixing: In the evaporating dish, thoroughly mix the soil sample with 15-20 mL of distilled water by alternately stirring, kneading, and chopping with a spatula. Add more water, in increments of 1-3 mL, until the sample is a thick homogeneous paste.
4.Placing: Make sure the cup of the Casagrande device rests on the base. Place a portion of the mixed sample in the cup. Using the spatula, press it from the middle outwards into the position shown in Fig. 4 to prevent trapping any air bubbles in the mass. Use as few strokes of the spatula as possible. Level the surface of the soil paste (again using the spatula) and trim it to a depth of 1 cm at the point of maximum thickness. Return excess soil to the evaporating dish.
5. Cutting Groove: Divide the soil in the cup into two equal halves by firm strokes of the grooving tool along the centerline of the cam follower. Starting near the hinge, draw the grooving tool toward the front in a continuous circular motion, always keeping the tool normal to the surface of the cup (Fig. 5).
Each stroke should penetrate a little deeper until the last stroke gently scrapes the bottom of the cup clean. Make the groove with as few strokes as possible (no more than 6). The completed groove is shown in Fig. 6.
Ex. 20 (continued)
6. Dropping the Cup: Lift and drop the cup by turning the crank handle at a rate of two revolutions per second (practice with a stopwatch to obtain the correct speed). Continue turning until the groove is closed (i.e. until the two halves of the soil sample come into contact at the bottom of the groove) along a distance of 13 mm. The back end of the standard grooving tool serves as a gauge length. Record the number of drops (1) required to reach this condition. If this exceeds 50, mix in a little more water and repeat steps 4 to 6.
Note: The groove should close because of the plastic flow of the soil, not as a result of sliding on the surface of the cup. If sliding occurs, this should be recorded and the result discarded.
7.Moisture Content Measurement:Remove a slice of soil approximately the width of the spatula, extending from edge to edge of the soil cake at a right angle to the groove and including that zone of the groove where the two portions flowed together. Place
in a suitable tared container (M1). Weigh and record the combined mass (M2) on the attached data sheet. Oven dry the soil to a constant mass at 110 ± 5°C (overnight drying is usually sufficient); reweigh as soon as it has cooled. Record this mass
(M3) on the data sheet. Record the loss in mass due to drying as the mass of water (M2 - M3).Refer to Fig. 7: Sample Data Sheet.
8.Repeat Tests: Transfer the soil still in the cup to the remaining soil paste in the evaporating dish. Wash and dry the cup, grooving tool, and spatula. Reattach and adjust the cup for the next trial.
Repeat steps 4 to 7 at least three more times with the soil collected in the evaporating dish, adding a little more water each time. The object of this procedure is to obtain samples of such consistency that the number of drops required to close the groove will be roughly evenly spaced over the range from 50 to 10. Ideally, there should be at least two results on either side of 25. The test should always proceed from the drier (50 drops) to the wetter (10 drops) condition.
9.Calculations: Calculate the water content of the soil (Wn) for each, drop count, expressed as a percentage of the weight of the oven-dried soil:
104
105

Ex. 20 (continued)
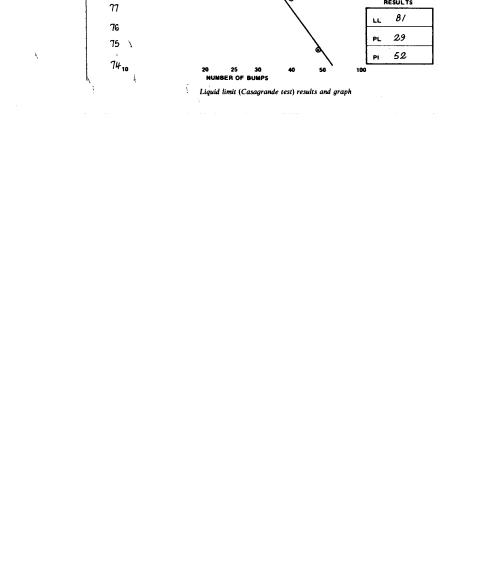
10.Flow Curve: On a semi-logarithmic chart, plot the moisture content as ordinates (linear scale) against the corresponding number of drops as abscissae (logarithmic scale). The "flow curve" is the best straight line that can be drawn through the plotted points (see Fig. 7).
11.Liquid Limit: The liquid limit is read as the moisture content corresponding to the intersection of the flow curve with the 25-drop ordinate.
12.Plasticity Index*: The difference between the liquid limit and the plastic limit (see Ex. 19) is calculated to give the plasticity index of the soil:
Plasticity index = Liquid limit - Plastic limit
The plasticity index is also reported to the nearest whole number.
When the liquid limit or plastic limit cannot be determined, report the plasticity index as NP (nonplastic).
When the plastic limit is equal to, or greater than, the liquid limit (e.g. in soils with a high mica content), report the plasticity index as NP.
*The plasticity index depends largely on the amount of clay present. The strength of the soil increases as the plasticity index increases. However, the tendency of a clay to expand when wet and shrink when dried also increases as the plasticity index increases.
FIGURE CREDITS (see Bibliography for complete references)
1.ASTM, p. 126 (1979 edition).
2.Head, K.H., p. 78.
3.Head, K.H., p. 77.
4.Head, K.H., p. 79.
5.Head, K.H., p. 79.
6.ASTM, p. 126 (1979 edition).
7.Head, K.H., p. 82.
FOOTNOTES
1. ASTM uses the word "drop" to indicate one falling motion of the Casagrande cup. Other standards use the word "blow" or "bump".
Ex. 20 (continued)
BIBLIOGRAPHY
ASTM. Annual Book of ASTM Standards 1985. Volume 04.08: Soil and Rock; Building Stones. Philadelphia, Pennsylvania: ASTM, 1985.
Clifton, James R. - Brown, Paul W. - Robbins, Carl R. Methods for characterizing adobe building materials. NBS Technical
Note N°977.Washington, D.C.: U.S. Department of Commerce, 1978.
Head, K.H. Manual of soil laboratory testing. Volume 1: soil classification and compaction tests. London: Pentech Press, 1980.
Soiltest, Inc. Test for plastic limit and plasticity index of soils (slide/tape set). Chicago, Illinois: Soiltest, Inc., 1963.
107
106
Ex. 20 (continued)
APPENDIX A: PREPARATION OF SAMPLE FOR LIQUID/PLASTIC LIMIT TESTS
1. Expose the soil sample from the field to the air at room temperature until dried thoroughly. (Samples should not b oven dried prior to testing. Even controlled temperature can alter the soil in various ways.)
2. If necessary, break up the aggregations of soil in a mortar with a rubber-covered pestle.
3. Sieve the pestled soil by hand through a 425 µm sieve nested on a receiving pan. About 250 grams of sieved dry soil is necessary for the two tests.
* If the soil is predominantly clay, it is preferable to take the soil in its natural state (without drying) and t remove coarse particles by hand during the mixing process Organic soils, and most tropical soils, should always b tested in their natural condition.
Natural soil can be cut up into small pieces with a cheese grater.
Ex. 20 (continued)
Fig. 7: SAMPLE DATA SHEET
109
108
Ex. 20 (continued)
DATA SHEET: LIQUID LIMIT OF SOILS
STONE. BRICK AND MORTARS
1 10
Ex. 21 MORTAR ANALYSIS: SIMPLE METHOD
INTRODUCTION/AIM
The following test is a simple method for determining the proportions of the three principal components of an historic mortar: (1) the binder (basically calcium carbonate (CaCO3), soluble in acid); (2) the fines (finely-textured. impurities such as clays); and (3) the sand or aggregate. The analysis gives approximate information and should be carried out together with other analyses (i.e. mineralogical, microscopic, etc.) in order to derive the maximum possible information from the mortar sample, either for the purposes of historical research or to prepare a restoration mortar compatible with the original.
As regards the latter, it should be remembered that several important factors that affect the condition and performance of a mortar are not revealed in mortar analysis. These include the original water: binder ratio, the mixing and placing method, the rate of drying, and the cleanliness and condition of the aggregates. In some ways, the most useful aspect of mortar analysis is the identification of aggregates for matching.
EQUIPMENT/CHEMICALS
Oven, balance, mortar and pestle, beakers, funnel, wash bottle, filter paper, glass rods, heat lamp, sieve set, 14% solution of hydrochloric acid, deionized water.
PROCEDURE
A.Collection/ Examination/ Dissolution of Binder
1.Collect a sample of adequate size (about 40-50 grams).
2.Examine the sample and record the following characteristics: color, texture, inclusions, hardness.
3.Powder half of the sample (20-25 grams) with a mortar and pestle; leave the other half for further analysis.
4.Dry the powdered sample in the oven at 110°C for 24 hours
and then weigh it (W1) with a balance (0.01 g precision). Record the weight on the attached data sheet.
5.Place the sample in a 600 mL beaker and moisten it with water,
6.Immerse the moistened sample in a 14% solution of hydrochloric aced in order to dissolve the binder.
Observe the reaction and record observations.
113
Ex. 21 (continued)
B.Separation/ Filtration/ Sieving
1.Label the filter paper to be used, weigh it (W2), and record the weight on the data sheet.
2.Fold the paper into quarters and place it in a funnel. Position the funnel so that it will drain into a large flask.
3.Add a few drops of hydrochloric acid (HCl) to the sample to verify complete acid digestion of the binder (i.e. that the reaction initiated in Step 6 above is complete).
4.Slowly add water to the remaining sample material.
5.Swirl with a glass rod to suspend the fines.
6.Slowly pour the liquid with suspended material through the filter, being careful to keep solid particles (sand) at the bottom of the beaker.
7.Repeat process (steps 4-6) until the water added to the beaker remains clear.
8.Dry the fines collected on the filter paper with a heat lamp.
9.Wash the sand with water several times and leave it to dry for 24 hours.
10.Weigh the filter paper with the dry fines (W3). Subtract the weight of the paper (W2) to determine the weight of the fines (W3 - W2). Record both values on the data sheet.
11.Weigh the dry sand (W4) and record the weight on the data sheet.
12.Express the amount of sand as a w/w percentage of the whole sample. Express the amount of fines in the same manner. The
amount of dissolved binder is calculated by summing up the percentages of sand and fines and subtracting from 100%.*
C.Characterization of Sand
1.Examine the sand with a binocular microscope. Record characteristics: color, particle shape and size, etc.
114
Ex. 21 (continued)
2.Sieve the sand in a standard sieve set to determine the particle size distribution. Express the amount of each particle size as a percentage of the whole (see Ex. 18A).
*The limitations of mortar analysis should always be considered. For example, calcareous aggregates will be dissolved with calcareous binder material and present misleading binder :aggregate proportions. Similarly, clay minerals present as impurities may not be readily distinguishable from the silicates present in hydraulic cement (see Ashurst, p. 20).
BIBLIOGRAPHY
Ashurst, John. Mortars, plasters and renders in conservation. London: Ecclesiastical Architects' and Surveyors' Association, 1983.
Columbia |
University, |
Historic |
Preservation |
Program. |
Laboratory exercises.
National Park Service, North Atlantic Preservation Center. Mortar analysis methodology.
115

Ex. 21 (continued)
MORTAR ANALYSIS: DATA SHEET
116
Ex. 22 ANALYSIS OF CALCIUM CARBONATE CONTENT IN MORTARS: CALCIMETER
METHOD
AIM
Somewhat different from the previous test, this method defines the 3 principal components of a mortar as carbonates, solubles (those substances soluble in acid without producing carbon dioxide) and sand. The proportions of each are determined with the use of a special instrument called a calcimeter.
In actual practice at ICCROM, the test has proved less reliable and consistent than simple mortar analysis. This may be due to problems with the instrument or with the formula and constant used for calculations. Nevertheless, the procedure has been included to illustrate alternative methodologies and to promote further experimentation with the technique.
EQUIPMENT/CHEMICALS
Oven, dessicator, calcimeter, balance (0.01 g precision), aluminum cups, filter paper, funnel, flask, plastic gloves, 17% solution of hydrochloric acid, silica gel, distilled water.
PROCEDURE
1.Take a well-preserved and representative sample.
2.Powder part of the sample, about 20 g.
3.Dry the powdered sample in the oven for 48 hours at 60°C. After this period, put it in the dessicator to cool and then weigh it (W).
4.Measure the room pressure and temperature.
5.Close "E" (see figure); record the volume in "C".
6.Pour the sample in "A"; carefully put the hydrochloric acid solution in the test tube (use plastic gloves).
7.Put the test, tube in "A" without dripping any HC1 on the sample. Close "A", then shake it up and down in
order to dissolve the binder (CaCO3) with the HC1.
117
Ex. 22 (continued)
8.The carbon dioxide (CO2) of the reaction will pass through "B" into “C”.
9.When the reaction is complete, record the new volume in "C", i.e. the height reached by the water on the cc scale.
10.Carefully remove the small test tube from "A". Stir the remaining solution with a glass rod and then carefully transfer the solution together with light suspensions and precipitates to a dry beaker. The sand should remain at the bottom of vessel "A".
11.Wash the sand with water several times (the water is discarded) and leave it to dry for 24 hours.
12.Weigh the dry sand.
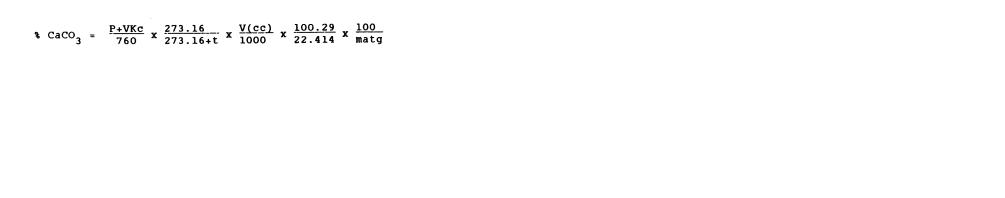
13.Calculate the % of CaCO3 with the following formula:
where:
P = room pressure
V = volume change in "C" t = room temperature
Kc = constant of instrument (0.221)** matg = grams of material in sample
** This constant must be calculated for each instrument. A control test using pure CaCO3 (in which the formula can be set equal to 100%) should permit the necessary adjustment of the formula.
14.The amount of sand is expressed as a simple w/w percentage of the whole sample. The "solubles" are calculated by summing up the percentage of carbonates and sands, and subtracting them from 100 percent.
BIBLIOGRAPHY
Jedrzejewska, Hanna. Old mortars in Poland: a new method of investigation. In: Studies in Conservation, Vol. 5, N°4, 1960, pp. 132-138.
Ex. 23 MIXING MORTARS FOR CONSERVATION
AIM
This exercise indicates the potential range of mixes to be used in the conservation of ancient masonry. Factors such as consistency, workability and shrinkage of mortars will be examined.
EQUIPMENT
Small vessels and tools for mixing mortars, paper cups for measuring volume, wooden molds, adhesive labels.
MATERIALS
Vaseline, lime putty, hydraulic lime, hydrated lime, white cement, portland cement, sand, pozzolana, brick dust, organic additives (eggs, urea, sugar, horse dung, yoghurt, powdered skim milk), water.
1.Ensure that the wooden mold is clean. Grease it with vaseline to prevent adhesion of the sample mortars.
2.Examine the list of mortars on page 121. Choose one sample mortar from each of the six categories (A-F).
3. For each s a m p l e mortar chosen, mix the components, adding only the amount of water necessary to achieve a homogeneous paste and good workability. Do not add water to mixes made with lime putty. Record your observations regarding work-ability in the data sheet.
4.Pour the mix into one of the greased mold compartments and label it, indicating your name and the type of mortar.
119
118
Ex. 23 (continued)
5.Wash out the mixing vessel and proceed to the next mortar sample.
6.When the six sample mortars have been prepared, leave the mold to set at 20°C and about 50% relative humidity for a period of 48 to 72 hours.
7.After this initial setting period, evaluate and compare the mortar samples noting characteristics such as shrinkage, setting time, degree of carbonation, hardness (abrasion resistance) and cohesion. Record your observations in the data sheet.
8.Open the wooden molds. If possible, remove the samples and allow them to set for another period of 5 to 7 days Re-evaluate and record your observations.
BIBLIOGRAPHY
Ashurst, John. Mortars for the repair of historic masonry surfaces. London: Department of the Environment.
120
Ex. 23 (continued)
SAMPLE MORTARS (parts by volume)
121

Ex. 24 CLEANING BUILDING STONE
AIM
This exercise will introduce various materials and methods for cleaning building stone. It aims to provide a general overview of the options available when it has been determined that cleaning is advisable.
EQUIPMENT/MATERIALS
Paper pulp, attapulgite, "AB 57", plastic wrap, air-abrasive equipment, water nebulizer.
PROCEDURE
After reading the following descriptions of the various cleaning methods, practice applying them to the stone objects and fragments given to you. Compare ease of use, cleaning results, and collateral effects of each treatment on the stone.
1. ATTAPULGITE: A hydrated aluminum-magnesium silicate, having the typical structure of a clay mineral; the chief ingredient of fuller's earth.
Cleaning principle: Because of its crystalline structure, this clay has a high surface area and absorption potential. Salt solutions can thus be absorbed by the clay and extracted from the stone.
Use: Mix clay and distilled water (1:1) into a paste. Apply packs of wet clay to the stone and cover with plastic film. After a few hours, remove the plastic wrap to permit evaporation of water from the clay. (It is possible to add some paper pulp to the clay to prevent cracking of the compress during drying.) When the pack has dried, carefully remove it from the subject area. Repeat if necessary.
Recommended: (a) To extract soluble salts. (b) To remove stains caused by organic materials such as oils. In the latter cases, it is necessary to use an organic solvent (carbon tetrachloride, dichloromethane, white spirit, etc.) instead of water.
Inadvisable: When the stone surface is in bad condition. Application of the clay compresses could lead to detachment of loose fragments.
122 |
123 |
Ex. 24 (continued)
2. "AB 57": A solution of slightly basic salts with chelating agents added to surfactants, fungicides and thixotropic substances to form a paste (developed by P. and L. Mora; see Bibliography). The ratio of the water to thixotropic agents always remains the same, while the quantity of the other components can be varied according to necessity. A typical mixture is obtained by mixing the ingredients in the following proportions:
Water |
1000 mL |
|
Ammonium bicarbonate |
30 |
g |
Sodium bicarbonate |
50 |
g |
Disodium salt of EDTA |
25 |
g |
Desogen (10% solution) |
10 |
mL |
Carboxymethyl cellulose |
60 |
g |
Cleaning principle: The ammonium and sodium bicarbonates and the EDTA (ethylene diamine tetra acetic acid, a chelating agent) facilitate the dissolution of calcium salts (especially gypsum); Desogen (Ciba-Geigy) is a surfactant (reduces surface tension) with a disinfecting action. The carboxymethyl cellulose gives the paste the needed bulk (to prevent flow on vertical surfaces) and prevents the solution from penetrating too deeply into the stone.**
Use: Make a solution of the bicarbonates and the EDTA in water. Add the Desogen and then, slowly, the cellulose. Mix constantly to form a homogeneous paste.
Apply packs of the paste, covered with plastic wrap, to the surface to be cleaned. Leave in place for 1 to 12 hours (depending on the condition of the stone), then remove. Removal should be accomplished by delicate scraping (using scalpels) of the subject area followed by careful washing with water to eliminate sodium and ammonium salts. As a final phase, damp, absorbent compresses can be applied to completely eliminate the salt residues.
Recommended: When the stone surface is covered with a layer of soot rich in gypsum and other salts.
Inadvisable: When the stone surface is in bad condition and fragments might be detached.
**It is possible to use micronized silica instead of carboxymethyl cellulose, thus creating a paste that can be more easily removed at the end of the treatment. It should be noted, however, that the adhesive strength of micronized silica is lower than that of carboxymethyl cellulose, so its cleaning action on surface crusts is slower and often less effective.
124
Ex. 24 (continued)
3.NEBULOUS SPRAYS or NEBULIZED WATER: a very fine water spray, or mist.
Cleaning principle: The solvent action of water (with respect to water-soluble materials) is enhanced by the high surface area of the droplets. Cleaning is thus accomplished without mechanical action.
Use: Using a nozzle which creates a fine mist, spray water in such a way that it wets the subject stone surfaces but is not aimed directly at them.
Recommended: To remove dust and relatively soft layers of soot, rich in water-soluble materials.
Inadvisable: When the stone is so heavily damaged by the presence of water-soluble salts that the hydration process (triggered by the penetration of water into the stone) could produce spalling and cracking.
4. AIR _ ABRASIVE __ CLEANING: Micro-sandblasting using glass microspheres (diameter 0.001 mm) or a fine powder of aluminum oxide.
Cleaning principle: Cleaning is accomplished by the mechanical action of a compressed air jet containing an abrasive. Because of the small size of the spray and the low hardness of the powders used, the cleaning action is slow and fairly easy to control.
Use: Turn the air-abrasive equipment to the lowest pressure setting, aim the pencil at the subject surface and begin cleaning. Adjust the pressure of flow and the distance between the pencil and surface based on the response of the material to the abrasion.
Recommended: To clean rather thick crusts from sound stone or to clean consolidated stone.
Inadvisable: When the Stone surface is in bad condition or the operator unskilled in the use of the air-abrasive apparatus.
125
Ex. 24 (continued)
BIBLIOGRAPHY
Ashurst, J. Cleaning stone and brick. (Technical Pamphlet N°4). London: Society for the Protection of Ancient Buildings, 1977.
ICCROM, Scientific Principles of Conservation Course. |
Course |
exercises, 1 9 7 7 . |
|
Mora, P. and Mora-Sbordoni, L. Metodo per la rimozione di incrostazione su pietre calcaree e dipinti murali. In: Problemi di Conservazione, Bologna: Editrice Compositori, 1975, pp. 339-344.
Ex. 25 REPOINTING OF STONE AND BRICKWORK
AIM
Mortar joints in masonry have the function of bonding the units together and levelling any irregularity. The finishing of joints at surface level is known as pointing. The pointing condition of a building is an important factor in its appearance and maintenance. Before beginning repointing work, it is important to determine the cause of mortar decay, as repointing alone will not cure the fault. Previous to any repointing, the original mortar should be analyzed in order to replace it with a compatible new mortar (see Exercises 21 and 22).
EQUIPMENT
Chisels, hammers, bristle brushes, trowels, pointing tools.
MATERIALS
Binders (lime putty, hydrated lime, hydraulic lime, etc.), sand, tap water.
PROCEDURE
1.Remove the defective or decayed mortar from the joints until sound material is reached. For rubble stone work, the areas to be repointed must be raked out to a depth of at least 40 to 100 mm. For brickwork, the corresponding depths are 12 to 25 mm. If the joint cannot easily be raked back to 10 mm, then repointing is premature. Raking out of old mortars should be carried out with a suitable tool, such as an old wood chisel, so as not to damage the adjacent masonry.
2.Once raking out is complete, thoroughly wash out the joints (using bristle brushes) to remove any remaining loose and dusty material. At the same time, wet the surfaces of the stone or brick which are to receive the new mortar, thus reducing the absorption of moisture from the pointing when applied.
3.Mix the appropriate mortar to be used for repointing.
4.Apply the mortar to the joints which have been washed out and thoroughly wetted. The mortar should be rammed well into the joint with a suitable pointing tool (not a trowel), so that it fills the joint and adheres firmly to the sides, leaving no voids.
5.The joint should be ;finished just sufficiently far back from the surface of the stone or brick to avoid encroachment of the mortar over worn arises, which will result in
127
126

Ex. 25 (continued)
weak and vulnerable feather edges to the joint. A bristle brush or a water spray may be used to roughen the surface of the joint.
6. Repointed areas should be protected from the drying effect of strong sun or wind by wet sacking or a similar damp material. If frosts are expected, the work should be covered overnight.
BIBLIOGRAPHY
Hawkins, Bob. Repointing of stone and brickwork. Matlock, Derbyshire, England, Design and Conservation Section, County Planning Department.
128
Ex. 26 INVESTIGATION OF THE CARBONATION PROCESS IN LIME MORTARS BY MEANS OF PHENOLPHTHALEIN
AIM
Knowledge about the carbonation process in lime mortar can only be achieved by practice. Literature and technology today deal mostly with cement and hydraulic binders, which behave quite differently. This exercise will show how temperature, relative humidity, air circulation, and water can influence the carbonation of lime mortar samples placed in different climatic conditions. It should be pointed out that it would be easy to expand this simple investigation to test other mixtures, other surface treatments, etc. It is also important to remember that though this test does not have the accuracy of a scientific investigation, it could be very useful as part of a preliminary survey, as a comparative work site test (see appendix: modified procedure for in-situ investigation), or as an educational exercise.
EQUIPMENT
Thermohygrograph, room or chamber with controlled climate, thermometer, hair hygrometer, fan, plastic ring molds, pipets, small vessels for mixing, felt-tip pen, absorbent paper.
MATERIALS
Lime putty, sand, vaseline, distilled water, acetic acid, 1% solution of phenolphthalein (in 95% alcohol).
PREMISES
Lime mortar hardens in two major steps:
1.The mortar dries as the excess water soaks into the substrate and the rest evaporates. This dry lime mortar is hard enough to take a little stress. Like dry clay, it will be dissolved by water.
2.The dry lime mortar (calcium hydroxide) reacts with the carbon
dioxide in the air and carbonates, forming calcium carbonate or limestone:
This produces a mortar that is almost insoluble in water. There is also a considerable rise in strength.
The problem is that the carbonation process is rather delicate and varies according to the temperature, moisture, presence of CO2, etc., as well as the physical characteristics of the material, such as pore structure, thickness, and so on.
129
ex. 26 (continued)
Thus it can easily happen that carbonation does not take place within a reasonable period of time. It can take years (tens and even hundreds of years!) instead of days or weeks. Another problem is that you cannot see if a lime mortar is carbonated or not, unless you use some kind of chemical indicator.
Phenolphthalein can be used for this purpose because it reacts with a sharp red color to alkaline materials and is colorless in a neutral or acid environment. Since calcium hydroxide is highly alkaline (basic) and calcium carbonate is almost neutral, phenolphthalein can be used to check the progress of the carbonation process.
Slaked lime (calcium hydroxide) is somewhat soluble in water and thus gives a clear alkaline reaction: phenolphthalein turns sharp red.
The carbonated lime (calcium carbonate) is almost insoluble in water which results in a neutral reaction.
The carbonation process starts from the surface of the mortar as this is the first place reached by the CO2 in the air. The same process also starts from the surface of the lime crystals and works inward. This means that until the crystals are completely carbonated, you will have an alkaline reaction in a mortar that is not completely dry. If the mortar is dry, you will have no reaction in those parts of the sample having partly carbonated lime (i.e. where the crystals are transformed to calcium carbonate on the surface). If these crystals still contain calcium hydroxide in their innner parts, you will observe an alkaline reaction from those internal parts after a few minutes. The reason is that even the purest alcohol (in which the phenolphthalein is dissolved) contains water which, after a while, dissolves the alkaline calcium hydroxide in the uncarbonated parts of the crystals.
In a mortar that is not completely dry, the alkalinity is high enough even in the partly carbonated parts to give an immediate sharp red reaction.
A fully carbonated mortar will give no red reaction, regardless of whether it is wet or dry.
With phenolphthalein and distilled water, it is thus possible to test if a lime-bound mortar is carbonated or not, or if it is in an intermediary stage.
130
Ex. 26 (continued)
PROCEDURE
1.Prepare a mortar of lime putty and sand, 1:3 parts by volume.
2.Grease the plastic ring molds with vaseline to prevent the mortar from sticking.
3.Place the molds on at least 4 layers of absorbent paper to soak excess water from the specimens.
4.Fill the molds with lime mortar. Check for complete filling also at the bottom. Remove excess mortar, leaving the surface of all samples in the same grade of smoothness.
5.Leave the samples in the laboratory at approximately 50% relative humidity and 20°C for 24 hours. When the mortar has set, carefully lift away the molds and put a number from 1 to 9 on the top surface of all samples. Use a felt-tip pen for the numbering.
6.Place the samples (with the number upwards) on flat movable wooden boards with a minimum distance of 2 cm between samples.
7.Place samples 1-7 in the internal climatic conditions specified below. Place samples 8 and 9 outside, one in the sun and the other in the shade, using a thermohygrograph tc record external temperature and humidity conditions.
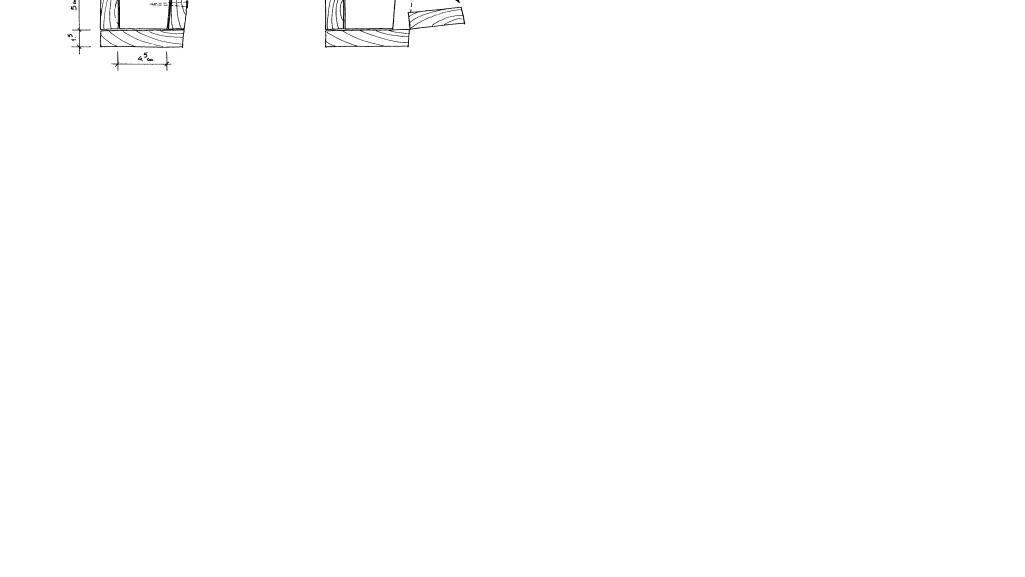
8.The extent of carbonation is indicated by the reduction of alkalinity observed by dripping indicator solutions (i.e. Phenolphthalein) on freshly broken surfaces of the mortar samples. Break all: samples after 4 days as shown in Fig. la. Test with phenolphthalein on piece 1 and compare. If a bright red color appears, the sample is not yet carbonated.
131
Ex. 26 (continued)
9.After 3 more days, break the samples as shown in Fig. lb; test again on piece 2 and compare. If the sample is not yet carbonated, wait a week and then repeat the procedure on piece 3.
10.Note the effect of temperature, humidity (in the specimen and in
the surrounding air), wind (natural or by fan) and CO2 content on the carbonation process. Note the difference between exposed and hidden surfaces (top and bottom of samples, etc.).
BIBLIOGRAPHY
British Research Establishment. Carbonation of concrete made with dense natural aggregates.. Watford: B.R.E., 1978.
Holmstom, Ingmar. Lecture notes. ICCROM International Architectural Conservation Course, 1981.
132
Ex. 26 (continued)
APPENDIX: MODIFIED PROCEDURE FOR IN-SITU INVESTIGATION
On a building site, proceed as follows (see diagram below):
1.Drill a hole in the dry lime mortar (rendering, joint, etc.) down to the substrate (e.g. brick wall) using a nail or small screwdriver. If possible, choose a hidden place for the drilling. The drill site, however, should be representative of the total subject area in terms of climate, drying conditions, etc.
2.Clean the hole of grains and dust by blowing. This is most easily done with a drinking straw.
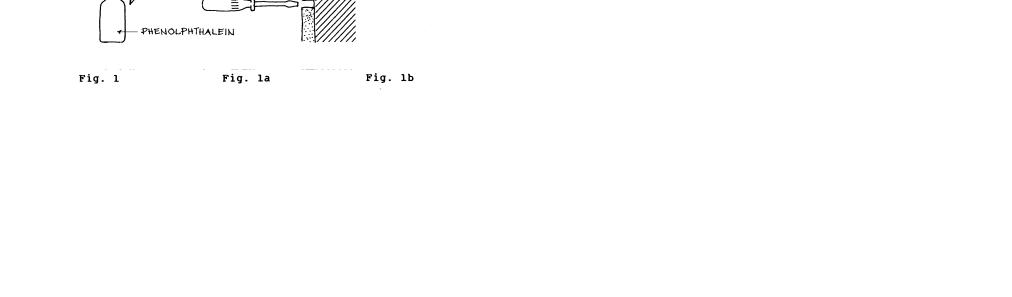
3.Apply phenolphthalein in the hole. A few drops are sufficient; application is most easily accomplished with a pipet. Be careful not to contaminate the pipet with drill dust, etc.
4. Observe the reaction. If the hole turns completely red, there is no carbonation or the carbonation process has started but the mortar is too rich in moisture.
In many cases, you will see no reaction near the surface and a sharp red reaction behind it. This tells you that the carbonation process has started in the outer parts but has not yet reached the inner parts.
5.If there is no reaction, apply a few drops of distilled water. Still no reaction means that the mortar is fully carbonated; a red reaction with the water means that carbonation has started all over but is not yet completed.
6.To remove tie red discoloration immediately, apply acetic acid. If you leave the discoloration, it will disappear in time.
7.Mend the drill hole with an appropriate mortar.
133
Ex. 26 (continued)
If the observed carbonation process is not satisfactory, investigate the possible reasons for the problem:
Were the conditions too wet, too dry, or too cold? Adjust the conditions by heating, by ventilation, or by creating shade.
Test again in new holes and compare results.
ARCHITECTURAL SURFACES:
RENDERS. PLASTER (INTONACO). PAINT
134
Ex. 27 SAMPLING OF ARCHITECTURAL SURFACE MATERIALS
AIM
The aim of this exercise is to provide general guidelines for the sampling of architectural surface materials such as renders, plasters (intonaco), and paints.
EQUIPMENT
Drawings, photographs or blueprints of the subject building, camera, soft bristle brushes, scalpel, chisel, mallet, sample containers, labels.
PROCEDURE
A.Fundamental Principles:
1.Complete documentary research should be carried out before sampling is begun.
2.The objectives of the sampling should be clearly defined from the outset.
3.The number and size of the samples should be kept to the minimum that will provide the desired information. Samples must be representative but should be taken, where possible, from areas where they cause least damage to the structure. In the case of paints and renders, undisturbed areas (such as just under the cornice) yield the most information.
Remember -- you need to know what you are looking for!!!
B.Description/Documentation:
1.Prior to sampling, the subject building must be carefully documented. This should include a thorough description, both written and visual, of:
a.The building's environment.
b.The building form and structure.
c. The types of building materials and their characteristics: color, texture, particle size, etc.
d.The condition of the various materials; zones of obvious deterioration due to weathering, biological attack, or other causes.
e.Previous restoration, repair, substitution, interventions.
2.The areas to be sampled should be photographed before, during, and after sampling.
137
Ex. 27 (continued)
C.Sampling Methodology:
1.A sample of surface material generally consists of a series of strata representing various finish layers, subsequent interventions, and surface deposits. A truly representative sample should include all the existing layers in addition to the substrate. The thickness of the sample will thus differ in each
case, depending on the type of material and, the building history. No sample, however, should be larger than 3 cm3.
2.Samples should be taken with appropriate tools, chosen according to the consistency of the surface materials. In general, the most commonly employed sampling instruments are:
a.Soft bristle brushes for powdery material.
b.Scalpels or exacto-blades for paints and more coherent finishes.
c.Chisels and mallets for harder renders and plasters.
3.Samples should be collected in small containers of appropriately inert materials which can be labelled and sealed tightly. Plastic test tubes, measuring about 6 cm in length and having a fitted stopper have proved useful for this purpose. Avoid sheets of paper, cardboard, paper envelopes ... in short, any fragile material that might deteriorate. Put only one sample in each container.
The sample label should include the name of the sampler, the date, the name of the building, and the number of the sample. It is best to number samples sequentially; each number should also be indicated on a corresponding photograph or drawing of the subject building. In this way, it is not only possible to locate the area from which a sample was taken but also to retrace the chronology of the sampling procedure.
Conserve the samples in their containers until they can be appropriately prepared for laboratory analysis.
BIBLIOGRAPHY
Istituto Centrale del Restauro. Corso sulla manutenzione di dipinti murali, mosaici, stucchi (DIMOS), Part I, Modulo 4: Tecnica delle sezioni stratigrafiche. Rome: Istituto Centrale del Restauro, 1978.
Italian Normal Committee. NORMAL - 3/80: Materiali lapidei: campionamento.
Ex. 28 IMBEDDING A SAMPLE FOR CROSS SECTION
AIM
In order to be subject to microscopic analysis, a sample of plaster or paint must be:
1.Imbedded in a cold-setting resin
2.Cut in cross section
3.Polished and
4.Inserted in a container for observation and conservation.
The following two exercises will outline the process of sample preparation.
EQUIPMENT
Molds, plastic cups, mixing rod, plastic gloves, vacuum pump, dessicator.
MATERIALS
Polyester resin*, catalyst for resin, release agent for mold. *
The chosen resin must:
1.Be perfectly transparent
2.Have a low index of refraction (ideal value 1.54)
3.Not yellow or darken as it ages
4.Not "depolymerize" in time
5.Not react with the sample material (i.e. must not liberate acidic substances)
6.Be cold-setting.
The polyester resin "SNIATRON 5119", a product of SNIA, has been found to meet all these requirements. It is particularly adapted to use at ambient temperatures utilizing cobalt octoate (cobalt 2 - ethylhexoate) as the catalyst and methyl ethyl ketone peroxide as the hardener. However, any other polyester resin that meets the stated requirements could be used to imbed the samples.
PROCEDURE (see illustrations which follows)
1. Work on a sheet of paper
2Preparation of Mold:
a. Prepare a mold to retain the liquid resin until it has set into a solid: Molds that have been used successfully are:
− 35 mm film containers (type without screw lids)
−polythene ice cube trays (cubes about 2 cm2).
138 |
139 |
Ex. 28 (continued)
b.Use a release agent* for all types of molds except polythene to prevent the resin from sticking. Possible release agents are:
−vaseline
−thick oil
−grease
−polyester release agent.
*Preliminary testing is required to assure that the chosen release agent does not react with the resin.
c.Make sure that the sample and mold are completely prepared before mixing the resin. The mold should have a label indicating the provenance and number of the sample, the date, and the name of the experimenter.
3.Mixing the resin: For each sample, use about 12-25 cc of polyester resin, depending on the sample size. Put the resin in a plastic cup. Measure and add the correct amount of catalyst. Mix well and the resin is ready for use.
Table of Catalyst Quantities for Polyester 5119
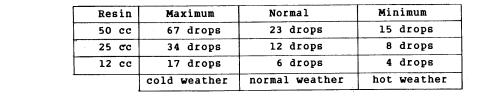
Quantity of catalyst in weight: Maximum 3%, Normal 1%, Minimum 0.5%; 45 drops = 1 cc.
4.Imbedding Samples:
a.Put a 3 to 4 mm layer of resin at the bottom of the mold. When this layer has partially set to a gel state, place the sample with the painted side up in the center of the partly-set resin. Press lightly to make it adhere. Pour another layer of resin on top to cover the sample.
b.Experience will assure the proper timing. If the first layer of resin is allowed to set too long, the two layers of resin will not stick together. If the first layer of resin is not left long enough, the sample will sink to the bottom of the mold.
Note: If desired, extra catalyst may be added to increase the setting speed. About three extra drops of catalyst are usually sufficient. Again, experience will dictate the optimum proportions.
Ex. 28 (continued)
5.Creating a Vacuum: To assure penetration of the resin into the pores of the sample and to remove any air bubbles from the resin, put the filled mold for about ten minutes in a dessicator that is connected to an hydraulic vacuum pump.
6.Removing Imbedded Samples: When the resin is hard*, remove the imbedded sample from the mold by a sharp tap with the palm of the hand. For the polythene molds, simply press gently on the bottom of the mold to eject the imbedded sample.
*Setting time is normally about 1/2 hour to the gel state and 24 hours to harden.
7.Label the sample immediately.
8.Clean your hands and the working area with a solvent (such as acetone). The sample is ready to be cut in cross section.
BIBLIOGRAPHY
ICCROM, Scientific Principles of Conservation Course, Course exercises.
Istituto Centrale del Restauro. Corso sulla manutenzione di dipinti murali, mosaici, stucchi (DIMOS), Part I,Modulo 4: Tecnica. delle sezioni stratigrafiche. Rome: Istituto Centrale del Restauro, 1978.
141
140

Ex. 28 (continued)
IMBEDDING A SAMPLE FOR CROSS SECTION
Ex. 29 CUTTING AND POLISHING A CROSS SECTION OF SURFACE MATERIAL: OBSERVATION OF THE SAMPLE
AIM
Once imbedded in the synthetic resin, a sample must be cut in cross section and then polished with various grades of abrasive paper of diminishing coarseness. It can then be examined under a microscope. This exercise outlines the cutting and polishing procedure.
EQUIPMENT/MATERIALS
Vice, hand saw, rough file, mineral oil (a liquid petroleum derivative), emery papers (grades 240, 320, 400, 600), microscope slide covers, Canada balsam, stereo binocular microscope (with photographic attachment if possible).
PROCEDURE (see illustrations)
1.Work on a sheet of paper.
2.Cutting:*
a.Clasp the embedded sample firmly in a vice.
b.With the metal hand-saw, cut it to reveal the cross section (obtaining a parallelepiped). The cut should be made along an oblique plane with respect to the horizontal surface of the sample in order to obtain a good legible stratigraphy.
c.With a file, roughly flatten the cut surface. The sample is ready for polishing.
*The cutting procedure can also be done with a mechanical low-speed saw with diamond blade, if available.
3.Polishing:
a.This process requires a series of 3 to 4 grades of emery paper mounted on a flat board which can be inserted in a bath of mineral oil. The grades most commonly used are 240, 320, 400, and 600 (see Fig. 4).
b.Using the apparatus described above (or a grinder, if available), polish the sample with the varying grades of wet every paper (starting from 240) using mineral oil as the lubricant. It is important to exert a uniform pressure on the sample block in order to avoid deformation of the sample surface.
A good method is to move the sample in one direction on the first emery paper, then to turn it 90° between each successive paper. Do not use the next finer paper until
143
142
Ex. 29 (continued)
all the scratches of the previous paper have disappeared. (This can be periodically checked under a stereo-binocular microscope with a magnification of about 10x). Wash the sample with mineral oil between each successive grade of paper.
c.The polishing operation is complete when microscopic observation reveals that all scratches and surface imperfections have disappeared. The point of this procedure is, in fact, to obtain a plane surface adapted to observation under reflected light.
4.Mounting the cross section in a container for conservation:
a.Mounting a cross section serves several purposes. It:
−protects the sample surface from dust
−facilitates the handling of the section
−facilitates observation of the section with an optical microscope
−permits the application of reference marks
−simplifies storage and recording.
The container illustrated in Fig. 4 has been used successfully for the storage of cross sections. It consists of a plexiglass block (8 x 3 x 1 cm) having a circular cavity (roughly 2-3 cm in diameter and 7-8 mm in height) at its center.
b.To prepare the sample for mounting, glue an ordinary .glass cover slide to the polished surface of the cross section using a thin layer of Canada Balsam.* To avoid the formation of air bubbles, rest the cover slide first on one edge of the cross section and then gently press it against the layer of balsam. Once it is in place, press again on the cover slide with a rectangular block to eliminate any bubbles and excess balsam. Allow it to harden.
*Canada Balsam, obtained from the North American balsam fir, is commonly used because it has an index of refraction (1.52 - 1.54) close to that of both the cover slide and of the lens. Thus it does not interfere appreciably with microscopic observation of the sample.
c.When the cross section is dry, fit it with the attached cover slide into the cavity of the plastic container described above in (a). Fix the edges of the cover slide to the container to avoid the accumulation of dust in the cavity. Normal adhesive tape is sufficient as a fixative.
d.Label the plastic container, including the sample number, date, and provenance of the sample.
Ex. 29 (continued)
e.So mounted, the cross section is ready for observation with a stereo-binocular microscope.
5.Observation of the Cross Section:
a.Observe the cross section with a stereo-binocular microscope under reflected normal light. Note the sequence of layers. For each individual layer, note:
−thickness
−color
−distribution of particles (uniformity, density, etc.)
−discontinuity of adhesion or cohesion
−penetration of superimposed substances; inclusions.
b.Record your observations on the attached sample form.
c. If the required equipment is available, make a photo-micrograph of the magnified cross section to accompany your written data. In the absence of photographic equipment, the cross section should be drawn to scale on millimeter paper to provide an indication of the thickness and relative position of the layers.
BIBLIOGRAPHY
ICCROM, Scientific Principles of Conservation Course, Course exercises.
Istituto Centrale del Restauro. Corso sulla manutenzione di dipinti murali, mosaici, stucchi (DIMOS), Part I, Modulo 4: Tecnica delle sezioni stratigrafiche. Rome: Istituto Centrale del Restauro, 1978.
Perrault, Carole L. "Techniques employed at the North Atlantic Historic Preservation Center for the sampling and analysis of historical architectural paints and finishes." Bulletin of the Association for Preservation Technology, Vol. X, N°2, 1978, pp. 6-46.
145
144
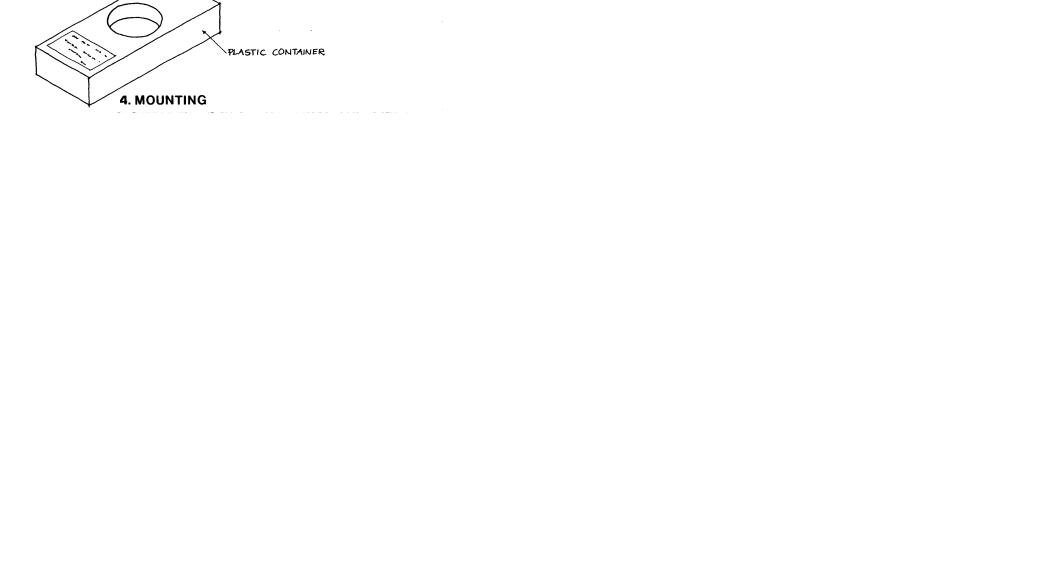
Ex. 29 (continued)
Ex. 29 (continued)
SAMPLE OBSERVATION SHEET
CUTTING AND POLISHING A CROSS SECTION
Name of Sampler:
Site:
Location:
Date:
Photograph or Drawing of the Cross Section
146 |
147 |
|
Ex. 30 SIMPLIFIED METHOD FOR IMBEDDING AND POLISHING A CROSS SECTION OF PLASTER OR PAINT
AIM
Though not as sophisticated as the procedure described in Exercises 28 and 29, the following simplified method (developed by Laura and Paolo Mora) is perfectly adequate for the preparation of most cross sections of architectural surface materials. It is quick, requires a much smaller quantity of resin, eliminates the need for cutting the sample, and allows all procedures to be carried out with only the simplest equipment. In addition, this method facilitates storage, making it possible to keep several samples from the same building or site in one container.
EQUIPMENT
Mixing vessels for resin, mixing rods, plastic 'stick' molds, files, varying grades of emery paper (240, 320, 400, 600), vice, microscope slide covers.
MATERIALS
Modelling clay, polyester resin, catalyst for resin, Canada balsam.
PROCEDURE (see illustrations below)
1.Imbedding the Sample
a. Work on a sheet of paper.
b. Put a layer of modelling clay (gray or white is best) in the bottom of the plastic 'stick' mold to serve as a support for the samples.
c. Stand the samples on edge, in the modelling clay, making sure:
− |
to leave a |
sufficient amount of space between |
|
samples; |
|
− |
that a portion of the sample protrudes above the |
|
|
lip of the |
plastic stick. |
d. Using adhesive labels on the plastic stick, indicate the date, number and provenance of each sample.
eMix the polyester resin and catalyst in proper proportions (see Ex. 28).
148
Ex. 30 (continued)
f. Pour the well-mixed resin into the groove in the plastic stick so as to completely fill it (thus surrounding the samples with resin). Be sure that the resin is level with the top edge of the groove.
g.Allow the resin to harden overnight.
2. Polishing
a. Clasp the plastic stick containing the hardened resin firmly in the vice.
b. Using the file, .flatten the surface of the sample until it is roughly level with the top edge of the plastic stick.
c. Starting with the coarsest emery paper (240), polish the sample surface with increasingly fine grades of emery paper until all scratches and surface imperfections have disappeared. Again, it is important to exert a uniform pressure on the sample block in order to avoid deformation of the sample surface. Similarly, a finer paper should not be used until all the scratches of the previous one have disappeared.
3. Mounting
a. When the polishing operation is complete, glue an ordinary glass cover slide to the surface of each cross section using a thin layer of Canada balsam. Gently press on the cover slide with a piece of soft cloth to eliminate any air bubbles and excess balsam. Allow it to harden.
b. When the balsam has dried, the cross sections are ready for observation with a stereo-binocular microscope.
c. Upon completion of the investigation, the samples can be easily stored. A simple archival system, such as a number code attached to each plastic stick, is recommended.
BIBLIOGRAPHY
Mora, L. and Pi. Unpublished methodology for the imbedding and polishing of cross sections, 1985.
149
Ex. 30 (continued) |
Ex. 30 (continued) |
|
|
IMBEDDING AND POLISHING A SAMPLE FOR CROSS SECTION: |
SAMPLE OBSERVATION SHEET |
SIMPLIFIED METHOD |
Name of Sampler: |
|
|
|
Site: |
|
Location: |
|
Date: |
|
Photograph or Drawing of the Cross Section |
151
150
WOOD
Ex. 31 WOOD STRUCTURE
AIM
Wood is a heterogeneous material characterized by specific elements and having different properties in each of its three directions. This exercise should provide an introduction to the typical structures of hard and soft woods as viewed under the microscope.
EQUIPMENT/ MATERIALS
Stage microscope, wood samples.
PROCEDURE
1. The three directions of wood:
Three sections of the same species of wood will be given to you. Identify under a microscope (40x and 100x magnification) the cross, tangential, and radial sections. Mark them C, T, and R.
Observe: - cross section: annual growth ring
−tangential section: longitudinal cells
−radial section: radial rays (cross pattern)
−tangential section: cross section of radial rays.
2.Soft wood (coniferous) and hard wood (deciduous):
Three prepared sections of soft wood and three analogous sections of hard wood will be given to you.
Note the difference between:
−the two cross sections
−the two tangential sections - the two radial sections.
Refer to figures 1 and 2.
What are the typical characteristics of hard and soft woods in each of their three dimensions?
BIBLIOGRAPHY
Foulger, A.N Classroom demonstrations of wood properties. ,Washington, D.C.: U.S. Department of Agriculture, Forest Products Laboratory, 1969.
Jane, F.W. The structure of wood. London: Adam and Charles Black, 1970.
Meylan, B.A. Three dimensional structure of wood. A scanning electron microscope study. London: Chapman and Hall, 1972.
155

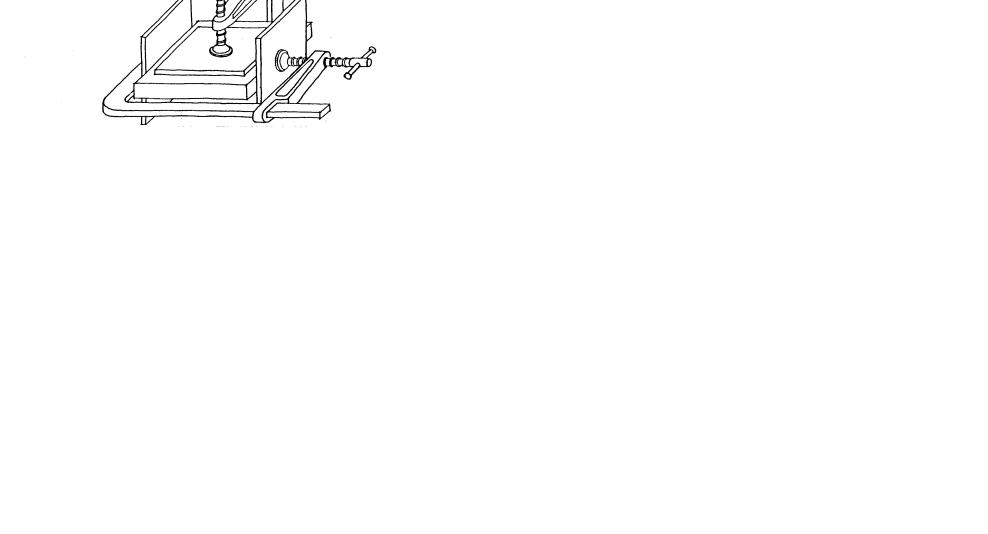
Ex. 32 SWELLING AND SHRINKAGE OF WOOD
AIM
This exercise studies the swelling and shrinkage of wood as a variable of its moisture content. Special attention is paid to the effect of restrained swelling, when the tendency to swell is greater than the possibility of the material to do so. Restrained swelling has practical applications to the behavior of exposed wooden structures.
EQUIPMENT/ MATERIALS
Ruler, clamps, clamping plates, hygrometer, wood samples.
PROCEDURE
1.Take two pieces of wood (samples 1 and 2), approximately 150 x 150 x 20 mm. Measure the dimensions of each piece accurately. Draw a pencil line on the wood where you took the measurements, so as to locate the same place -again. Record the measurements in Data Sheets 1 and 2.
2.Measure the wood moisture content (WMC) of each piece with the hygrometer. Record the values in Data Sheets 1 and 2.
THREE DIMENSIONS OF WOOD
T = tangential dimension. It should be noted, however, that all values said to be tangential are not tangential but circumferential. On a micro-scale, circumferential and tangential are the same.
R = radial dimension. The radial dimension of a wooden board is radial only in one part, often in the center as illustrated. At the sides, this dimension is usually tangential.
L = longitudinal dimension.
Ex. 32 (continued)
3.Clamp one of the pieces of wood as illustrated below so that it cannot swell in the tangential direction (where the tendency to swell is greatest). Do not tighten the clamp to the point that you crush the wood. Use clamping plates to ensure an even stress. Prevent the piece of wood from buckling with another clamp and plates, as illustrated.
4.Immerse both the clamped and unclamped pieces of wood in water, making sure that they are completely covered. Measure their dimensions and moisture content after 1 hour and after 24 hours, and record the values.
5.Allow both pieces of wood to dry, preferably in the sun. Measure the dimensions of each sample after 1 hour. Remove the restraining clamps after 24 hours and measure the samples again. Measure the wood moisture content at each interval with the hygrometer. Record all values in Data Sheets 1 and 2.
DISCUSSION
−What general statements can you make about the swelling and shrinkage of wood?
−In which direction was swelling most pronounced?
−Did swelling occur immediately or only after prolonged wetting?
−What effect did the imposition of restraint have upon the behavior of swelling wood?
159
158

Ex. 32 (continued)
−What observations can you make about the capacity of wood to regain its original dimensions when dry (after a period of prolonged wetting)? What were the differences between the restrained and unrestrained wooden pieces in this regard?
−How would the properties observed in this exercise affect the behavior of wooden members subject to periodic wetting and drying? What types of deformation might you expect? What types of solution might you propose to correct situations in which such deformations occur?
BIBLIOGRAPHY
Kaila, P. Lecture Notes, ICCROM International Architectural
Conservation Course, 1985.
Ex. 33 CROSS SECTIONS AND IDENTIFICATION OF WOOD
AIM
It is sometimes necessary to identify a species of wood before deciding upon a treatment. This exercise outlines the basic procedure for the preparation and interpretation of wood samples. Often, in complicated cases, accurate identification will require the assistance of an expert or a specialized institution. A basic understanding of the analytic process, however, will better enable the architectural conservator to request the information required.
EQUIPMENT/CHEMICALS
Hot plate, stage microscope, hand microtome, beakers, watch glasses, spoon, tweezers, razor blade, microscope slides, cover slides, fine brush, sodium hydroxide, alcohol, distilled water.
PROCEDURE
1.Sampling:
Cut a cube measuring approximately 10 x 10 x 10 mm from the wood to be sampled. Try to orient the cube so that the faces are almost parallel to the three-dimensional directions of the wood.
2.Preparation:
Boil the cube in a 2-4% aqueous solution of sodium or potassium hydroxide. Softwoods require 1/2 to 2 hours; hardwoods require longer. The boiling process can be considered
complete when the wood cube sinks to the bottom of the solution. Transfer the cube into pure alcohol for several hours (preferably overnight).
3.Cutting and Mounting:
Take a razor blade or sharp knife and trim the cube so that its faces are exactly parallel to the three-dimensional directions of the wood.
Clamp the cube into the hand microtome.
Cut very thin laminae (thin sections) from the cube. (If a hand microtome is not available, this can also be done with a razor blade.) Begin with the radial plane; then do the same in the; tangential plane and, finally, across the grain.
Transfer each thin' section to a microscope slide with the help of a fine brush and wet with a drop of alcohol/water solution (2:1). Put a cover slide on top of the section. Label the slide.
161
160

Ex. 33 (continued) 4.
Identification:
Examine the prepared thin section with a stage microscope utilizing transmitted illumination (magnification of at least 100x is desirable).
Each species of wood has characteristic elements (pits, cells, etc.) in each of its directions. By comparison with known cross sections, it is possible to identify the species of the sample. The more damaged the sample, the more damaged the specific elements will be, making identification more difficult. Very often, in such cases, it will be necessary to consult a specialist.
BIBLIOGRAPHY
ICCROM, Scientific Principles of Conservation Course. Course exercises, 1977.
Schweingruber, |
Fritz. |
Microscopic wood |
anatomy. |
Zug: |
Zuercher A.G., |
1978. |
|
|
|
Ex. 34 TEST LOADING OF WOOD
AIM
The aim of this exercise is to simulate, on a small scale, a bending test to evaluate the structural strength of a wooden beam. A beam may be large enough to support a given load safely, but if its deflection is too large, a floor will vibrate or a plaster ceiling will crack. In practice, a beam is designed for bending and then investigated for deflection. The maximum allowable deflection therefore determines the load-bearing capacity of a wooden beam.
SAMPLE _ CALCULATIONS/ TESTING PRINCIPLES
Simplified Example of Load Test for a Floor Beam (see above): One beam carries a floor area of 100 cm x 500 cm = 5 m2 Required live load (e.g. building code): 250 kg/m2 Required load on
this beam: 1250 kg
Maximum allowable deflection: L/360 = 500/360 = 1.4 cm
The test load is placed on the beam as illustrated on the following page. The load is applied gradually, increasing by increments of 10% of the total load every 24 hours. The deflection i s r e ad at each interval from a scale placed at the center of the beam. If the deflection does not exceed the maximum allowable (i.e. 1.4 cm) at 1250 kg, the test loads are removed. After another period of 24 hours, the recovery on the deflection should be at least 90%.
163
162

Ex. 34 (continued)
EQUIPMENT/MATERIALS
2 large bricks, wooden beam, steel wire, test loads, vernier caliper.
PROCEDURE
1.Support a wooden test beam on two large bricks. Record all dimensions of the beam (breadth, height, and length between bricks) and mark the center point between the two bricks.
2.Attach a steel wire to the beam along the center line, with a suspended weight at one end to keep it taut. Measure the distance between the wire and the top of the beam at the center point (Ao).
3.Load the beam along its length with a weighed test load. Record the weight of the test load in the data sheet.
4.Using a vernier gauge, measure the deflection at the center of the beam immediately after loading and record the value (Al).
5.After 24 hours, measure the deflection again and record the value (A2).
Ex. 34 (continued)
6.Remove the test load. Record the deflection immediately after removal (A3).
7.24 hours after removing the test load, again measure the deflection of the beam and record (A4).
DATA SHEET
8.Using the formula below, calculate the load-bearing capacity of the test 'beam at the maximum allowable deflection. Compare the calculations with the experimental results in the data sheet to see if the beam behaved within the calculated limits during the 24-hour test period.
165
164

Ex. 34 (continued)
BIBLIOGRAPHY
Kaila, P. Lecture Notes, ICCROM International
Architectural Conservation Course, 1985.
Ex. 35 PREPARATION AND APPLICATION OF TRADITIONAL OIL HOUSE
PAINTS
AIM
The following exercise provides an introduction to the proper preparation and application of traditional oil-based paints to wooden surfaces.
EQUIPMENT
A wooden panel or door, a methylene chloride paint stripper, sand paper, linseed oil, zinc white paste, a powdered earth pigment (e.g. yellow or red ocher), turpentine, paint brushes, spatulas, scrapers.
PROCEDURE
1. Preparation of the Wooden Surface
a)Using a brush, apply a thick layer of the methylene chloride paint stripper to the wooden surface (to be repainted). Wait 3 to 5 minutes and then scrape off the old paint layer with the scraping tool.
b)Repeat this procedure until all layers of undesirable paint are removed. In general, the panel should be stripped of all synthetic paint. Any linseed oil-based paint which is strongly adhered to the surface can be allowed to remain.
c)Once all layers of undesirable paint have been removed with the paint stripper, prepare the surface for the new paint by sanding. (In addition to methylene chloride, the paint stripper contains paraffin wax as a medium which must be removed from the surface before repainting.)
2. Mixing and Application of the Priming Layer
a)Prepare the priming paint by mixing boiled linseed oil with the zinc white paste.
b)Dilute the mixture by about 10% with a thinning agent
(50% linseed oil and 50% turpentine).*
* The principle in painting with traditional oil paints is to progress from less fatty (oily) paint layers to more tatty ones. If the priming paint is diluted only with oil, it becomes too fatty for a first layer. Turpentine is therefore used to create a mix with the desired characteristics.
c)Cover the surface with a very thin layer of primer. The layer should not be opaquely white, but should rather have a veil-like appearance on the wood.
167
166
Ex. 35 (continued)
d) In actual practice, let the priming layer and each successive layer dry for one week. Remember that:
−Oxygen makes oil paint dry (oxidation).
−Light is necessary for the drying process.
Warmth quickens the drying process, but too rapid a drying of the surface prevents oxygen from penetrating deeper, and thus has a negative effect. It is best not to paint with oils in direct sunshine or at temperatures below 5°C.
−The surface to be painted must be thoroughly dry before application of the oil paint. Water or water vapor does not penetrate a fresh linseed oil finish. Rain is thus less of a problem if it falls after application of the paint.
3.Mixing and Application of Principal Coats
a)Since a 7-day drying period is not practical for the purposes of an exercise, sand down another part of the same wooden surface to which the primer was applied and brush off the dust.
b)Mix a small amount of the earth pigment with a little oil to form a paste. Mix this pigmented paste into the priming paint prepared in step 2a (zinc white paste and boiled linseed oil, undiluted by turpentine).
c)Paint the dry, sanded surface with this pigmented paint. (In actual practice, this layer would be applied on top of the priming layer after a 7-day drying period.) Notice how much thicker and more opaque this layer is, as compared to the priming layer. Note, too, the typical marks left by the brushes in the painted surface.
4. Cleaning, Care of Tools, Maintenance
a)Wash your hands and the paint brushes with a thinning agent (oil and turpentine 1:1). Note:
−The turpentine has a tendency to make your hands dry. It is advisable to apply a moisturizing cream
afterwards.
− Uncleaned, the p a i n t brushes can be kept soft by storing them immersed in water. Paint cannot take oxygen from the water and therefore does not dry on the brushes.
b) An exterior facade painted with a traditional linseed oil paint will require repainting after about 30 years.
BIBLIOGRAPHY
Kaila, P. Lecture Notes, ICCROM International Architectural
Conservation Course, 1985.
168