

GENERAL PRINCIPLES: LABORATORY SCIENCE
Ex. 1 SAMPLING
INTRODUCTION/AIM
This exercise introduces the sampling process and the variables that affect it. It is important to remember that the experimental process begins in the field when the samples are taken. As in the laboratory, experimental design (i.e. the sampling procedure) is critical. The conservator must consider factors such as: WHEN should samples be taken? Under what conditions? Using which instruments? HOW MANY samples should be taken? Of what size? WHERE should the samples come from? WHAT information is desired (i.e. why are the samples being taken)? It is essential to keep in mind that both techniques and results must be reproducible.
DEFINITIONS
(1)Types of Comparison: The experimenter must gather enough data to make relevant comparisons. These can be external in which evidence about the subject building is
compared with other buildings OR
internal in which individual pieces of evidence are compared with the building as a whole.
In general, internal comparisons are more reliable because very few procedures are standardized.
(2)Types of Sampling:
Random sampling: A process in which samples are chosen at random; spot-checking (e.g. quality control in factories).
Non-random sampling: A process in which samples are drawn from a particular area or group (e.g. if deterioration on a building occurs in a localized area, all samples may be drawn from there if the purpose of the investigation is to discover the cause of deterioration).
Population: The entire sample group.
MATERIALS
50 coins or chips; red nail polish; plastic bag; graph paper; notebook; calculator.
3

Ex. 1 (continued)
PROCEDURE
1.Work in teams of three persons: one person (R) to record the data and the others (El and E2) to collect the samples.
2.Mark 5 of the coins with red nail polish.
3.Place 5 marked and 45 unmarked coins in the plastic bag. Shake the bag to mix the coins.
4.Let El reach into the bag and pull out a random quantity of coins from the bag. Let R record the number of marked and unmarked coins in the sample on the attached chart.
5.Return the sample pulled by El to the plastic bag. Mix the coins and let E2 pull a random quantity of coins from the bag. Let R record the number of marked and unmarked coins in the sample on the attached chart.
6.Repeat steps (4) and (5), alternating El and E2, until the ratio of marked/unmarked coins (keep a running total as indicated on the chart) equals or closely approximates the actual ratio of the population.
7.Express the results mathematically by completing the chart.
8.Express the results graphically showing the ratio as a function of the number of samples.
9.Repeat the entire procedure using a sample population of 20 marked coins out of 50.
DISCUSSION
(A)How did the following factors affect the sampling results:
1)Actual composition of the population (actual ratio of marked to unmarked coins).
2)Number of coins in each sample (relationship of sample size to actual composition of the population).
3)The sample collector (compare El and E2).
4)The method of sample collection.
(B)What were the possible sources of error?
(C)What general statements can you make about the reliability of sampling and the factors that affect it?
4
Ex. 1 (continued)
Population: Marked coins______________ Unmarked coins
5
Ex. 1 (continued)
Population: Marked coins____________ Unmarked coins_____________
6
Ex. 2 MEASUREMENT AND ERROR: PRECISION, ACCURACY, STATISTICS
AIM
To become familiar with the standard statistical evaluation of data. This exercise is designed to introduce the concepts of precision and accuracy and to provide a basic framework for the mathematical manipulation of laboratory data.
DEFINITIONS
(1)Data Treatment: Much of a conservator's data is numerical. These numbers must be (a) sorted and (b) questioned through statistics to arrive at some sort of assumption. In this regard, it is essential to understand the difference between precision and accuracy.
Precision: Degree of agreement of repeated measurements of the same quantity. It is a statistical value, the calculation of which is described below. Precision and reproducibility are synonymous.
Accuracy: The agreement between the result of a measurement and the true or real value of the quantity
measured. (A measurement that is accurate is not only reproducible but also the "right" answer.)
"Accuracy" has to do with the closeness (of data) to the truth, "precision" only with the closeness of readings to one another.
(2) Calculations:
Mean: |
The average. Sum up all the data and divide by the |
||
|
number of values. |
||
Mode: |
The |
most common |
piece of data. |
Median: |
The |
value right |
in the middle. |
The dispersion of data about the mean gives an idea of the precision of a series of measurements. There are several ways to measure dispersion, including:
Range or Spread: The difference between the least and the greatest values in a set of data.
Absolute Deviation: For each piece of data, the difference between its value and the mean. The difference may be positive (greater than the mean) or negative ,(smaller than the mean). This does not affect its "absolute value".
7
Ex. 2 (continued)
Mean_Absolute _Deviation: An average of the absolute deviations of the sample data.
Mean Relative Deviation: Mean Absolute Deviation
Mean
The _Standard Deviation: The most widely employed system. It establishes an interval in which at least 2/3 of the values will fall.
Calculation of Standard Deviation:
First, calculate the Variance. This is the sum of all the squares of the absolute deviations divided by the number of values.
The Standard_ _ Deviation (indicated by the Greek letter sigma δ) is the square root of the variance.
u |
= mean |
|
x |
= individual item |
|
N = number of elements |
||
or, for small amounts of data, the |
Standard |
Deviation |
is: |
|
|
u |
= mean |
|
x |
= individual item |
|
N |
= number of |
elements |
8
Ex. 2 (continued)
EXAMPLE OF PRECISION CALCULATIONS
Results |
Absolute Deviations |
Square Deviations |
Median = 17.1
Range = from 16.0 to 17.7 with a mean of 17.0; it is written 17.0 +0.7 -1.0
3 out of 5 results fall in this range.
PROCEDURE
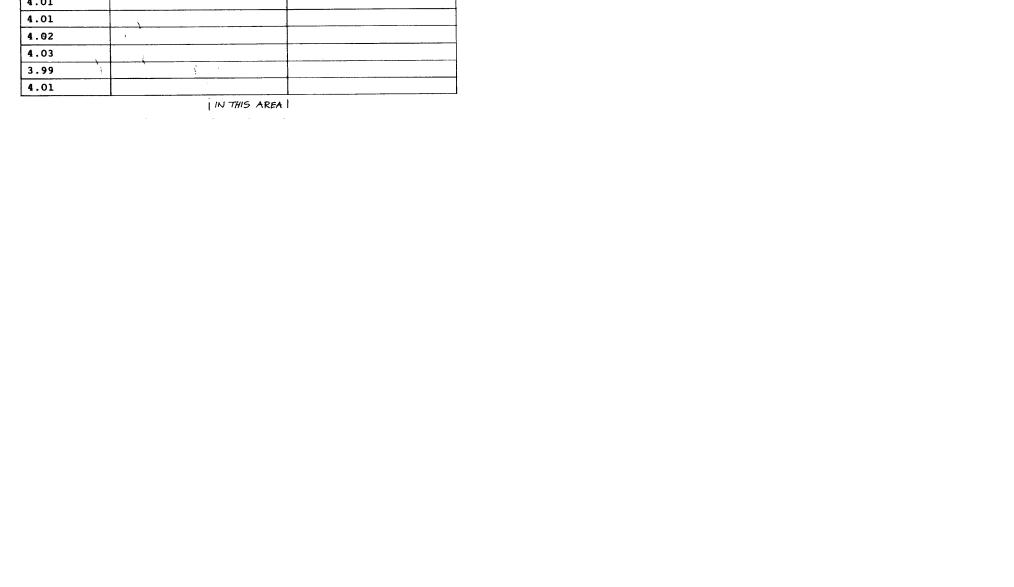
Do the following exercise: The weight of a silver ring is measured 10 times on a rather large balance on which the weight may be measured up to 0.01 of a gram. The results are as follows:
A. Fill in the chart.9
9
Ex. 2 (continued)
B.Calculate the: Mean:
Median: Range:
Mean Absolute Deviation: Variance:
Standard Deviation:
C.Graph the results.
10
Ex. 3 MEASUREMENT: MASS (Use of the Balance)
AIM
Balances are mechanical devices used to determine the mass of objects. Many kinds of balances are available, ranging from rough measuring devices which are sensitive to 0.1 g to the analytical balances sensitive to fractions of a microgram.
The choice of a balance obviously depends upon its designated use. The following exercise introduces two balances typically used in the architectural conservation laboratory: a Sartorius single-pan, top-loading balance (precision 0.1 g, maximum load 1000 g), and a Mettler balance of a similar design (precision 0.01 g, maximum load 1200 g).
DEFINITIONS |
|
Mass: |
An invariant measure of the quantity of matter in an |
|
object. The SI (International System of Units) unit of |
|
mass is the kilogram, but gram quantities are more usual |
|
in the laboratory. Technicians properly use the term mass |
|
in discussing measurements made with a balance. |
Weight: |
The forces of attraction exhibited between an object |
|
and the earth. Weight equals mass times the gravitational |
|
attraction. Mass is proportional to weight, so we |
|
ordinarily interchange the terms, but the unit of weight |
|
is the newton. |
Capacity: The largest load on one pan for which the balance can be brought to equilibrium.
Readability: The smallest fraction of a division at which the index scale can be read with ease.
Sensitivity: The change in load required to produce a perceptible change in indication. It is, therefore, a ratio and not to be used to discuss the quality of a measurement.
Significant Figure: A digit that shows a quantity in the position that it occupies in the whole numerical term. A zero is not significant when it is used to locate the decimal point; it is significant, however, when it fixes quantity, for example, when it, indicates that the value is nearer to 0 than to 1.
E.g. In the number 1.500 x 101, they zeroes are, significant because they show that the quantity is nearer to 1.500 x 101 than to 1.501 x 101 or 1.499 x 101.
11
Ex. 3 (continued) |
Ex. 3 (continued) |
A number should contain no more than one doubtful digit. For a number such as 2.987 with four significant digits, only the 7 should be doubtful.
PROCEDURE
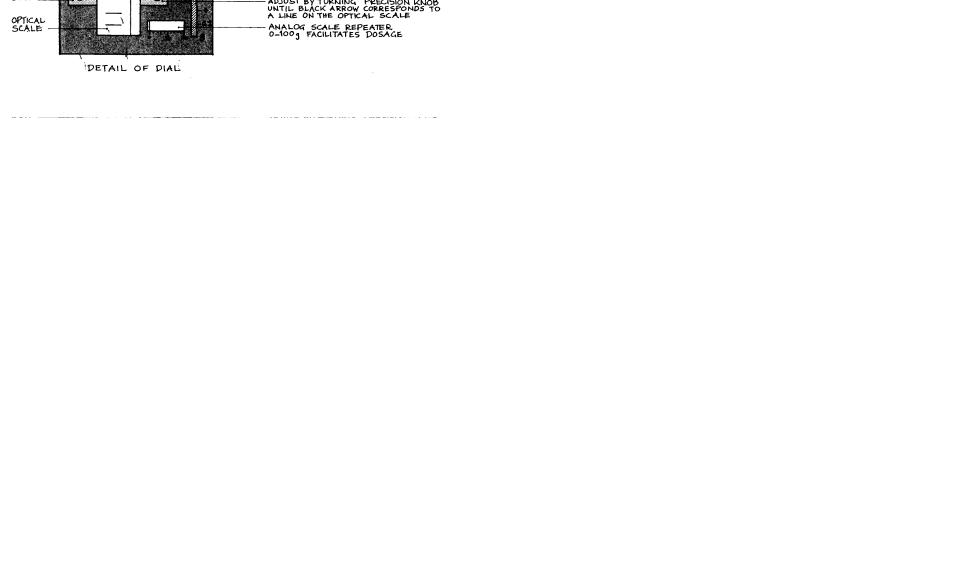
1.Examine the attached diagram of the Sartorius balance which outlines its parts and their use.
2.Check the balance zero.
3.Weigh the sample objects (A) given to you.Record the weights in Data Sheet 1.
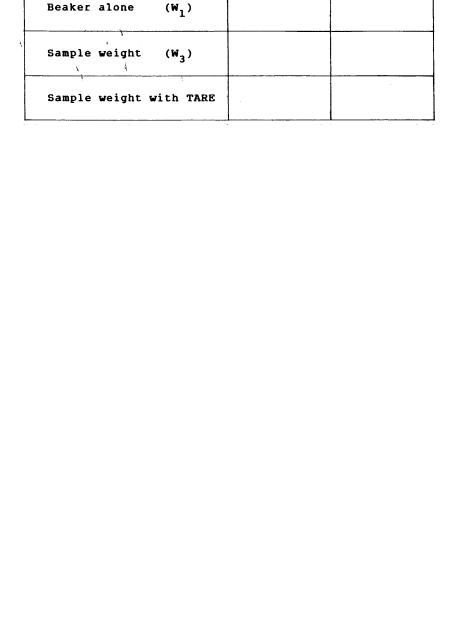
4.Weighing materials in a beaker:
Procedure (a):
Weigh the beaker empty (W1). Place sample 2A in the beaker and weigh (W2). Subtract W1 from W2 to obtain the weight of the sample (W3). Record your results in Data Sheet 2.
Procedure (b):
Use the Tare knob on the balance. Place the beaker on the pan and turn the Tare knob until it reads zero. Place sample 2 in the beaker and weigh. Record the weight in Data Sheet 2.
Are the weights obtained using procedure (a) and procedure (b) the same? What are the possible sources of error?
5.Empty the pan of the balance. Return the Tare knob to zero.
6.Lock the pan of the balance.
7.Repeat Steps 1 through 6 using the Mettler balance and Samples 1B through 6B. -
BIBLIOGRAPHY
ICCROM, Scientific Principles of Conservation Course, Course exercises, 1976-77.
Shugar, G. - Shugar, R. - Bauman, L. - Bauman, R.S. Chemical
Technicians' Ready Reference Handbook. New York: McGraw Hill, 1981.
12
Ex. 3 (continued) |
Ex. 3 (continued) |
15
14

Ex. 4 MEASUREMENT: LENGTH (Use of the Vernier Caliper and
Micrometer)
AIM
There are many types of laboratory tools for the precise measurement of length. Among these are the vernier caliper and the micrometer or screw gauge. The purpose of this exercise is to make you familiar with the care and use of these instruments.
DEFINITIONS
Calipers: Calipers consist of a pair of hinged steel jaws which are used for measuring the dimensions, both internal and external, of small objects where a scale rule cannot be applied directly.
Vernier scale: Invented by Pierre Vernier in the seventeenth century, the vernier scale is fitted to many types of measuring and surveying instruments. It enables measurements to be made by direct reading to 0.1 mm without having to estimate fractions of a division.
Vernier calipers: Vernier calipers consist of a fixed steel scale marked in millimeters (from 16 to 20 cm in length) with a fixed jaw at one end, and a sliding jaw carrying a scale (the vernier) which is 9 mm long and divided into 10 (or 20) equal parts.
Ex. 4 (continued)
To measure with the vernier caliper:
1.Close (or open) the jaws so that they very lightly clamp the object at the desired point of measurement.
2.Read the fixed scale. The nearest scale division to the left of the zero on the vernier indicates the number of whole millimeters being measured.
3.Read the vernier. The line of the vernier that directly coincides with a line on the fixed scale indicates the number of tenths (or twentieths) of a millimeter to be added. See the example below.
Vernier calipers have jaws for both internal and external measurements. They can also be used for depth measurement as indicated below.

Ex. 4 (continued)
Micrometer or Screw Gauge: An instrument used for the measurement of lengths between 0.01 mm and a few centimeters. It is thus more sensitive than the vernier caliper but has a narrower range. Though there are diverse types, a typical micrometer is illustrated below. The range of this instrument (0-25 mm, 25-50 mm, 50-75 mm) is usually indicated on the face of the U-shaped piece.
To measure with the micrometer:
1.Make sure the faces of the spindle and the anvil are clean and free of dust.
2.Place the object to be measured in the mouth of the micrometer.
3.Gently rotate the thimble until the object is lightly clamped between the anvil and the spindle (the thimble will stop moving). Make final adjustments with the ratchet knob. When the ratchet knob begins to slip round, you are ready to read the scales.
18
Ex. 4 (continued)
4. The length of the object is read by adding (a) the number of millimeters and half millimeters indicated by the length of the fixed scale uncovered by the thimble and (b) the number on the moving scale which most nearly coincides with the base line on the fixed scale. See examples below.
19

Ex. 4 (continued)
PROCEDURE
1.Measure the samples given to you with the vernier caliper. Record the dimensions below:
2.Make sure the instrument is free from dust and return it to its case.
3.Using the micrometer, measure the second set of samples given to you. Record the results below
4.Make sure the micrometer is clean and return it to its case.
5.Compare your results with those of others in the lab. What are the possible sources of error?
BIBLIOGRAPHY
Head, K.H. Manual of soil laboratory testing. London: Pen-tech Press, 1980.
ICCROM, Scientific Principles of Conservation Course, Course notes.
Lucarelli, S. Notes on the use of measuring instruments. Rome: ICCROM, 1979.
Shugar, G. - Shugar, R. - Bauman, L. - Bauman, R.S. Chemical technicians' ready reference handbook. New York: McGraw Hill, 1981.
20
Ex. 5 MEASUREMENT: VOLUME
AIM
There are many different types of laboratory equipment for measuring volume. This exercise is intended to make you familiar with the volumetric equipment most frequently used in the architectural conservation laboratory.
DEFINITIONS |
Liter (L): the volume occupied by |
one kilogram of |
|
Units of |
|||
Volume |
water |
at 4°C and standard atmospheric pressure; this |
|
|
volume |
is equivalent to one cubic |
decimeter. |
Milliliter (mL): one-thousandth of a liter.
Cubic centimeter (cm3): can be used interchangeably with milliliter without effect.
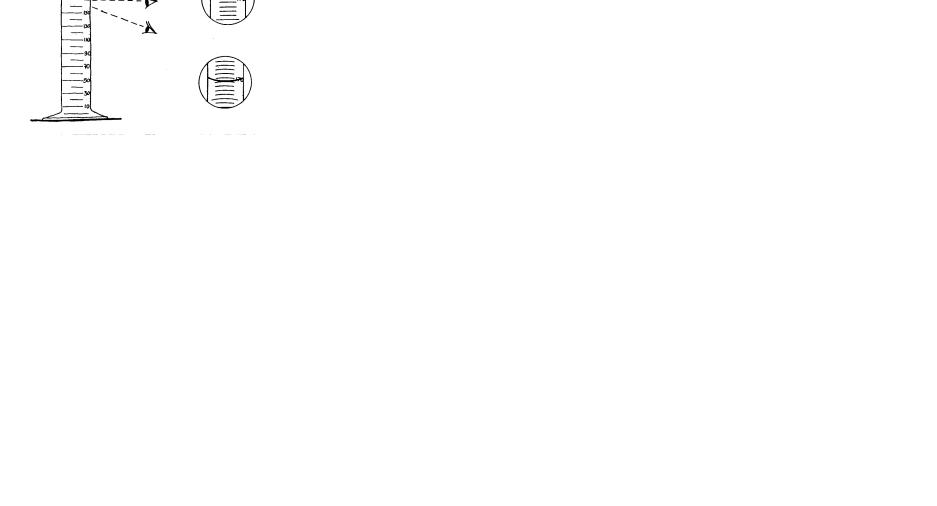
Meniscus: The curvature exhibited at the surface of a liquid that is confined in a narrow tube such as a cylinder, buret, or pipet.
It is common practice to use the bottom of the meniscus in calibrating and using volumetric glassware (see illustration on page 22).
VOLUMETRIC EQUIPMENT
General Care: Only clean glass surfaces will support a uniform film of liquid; all volumetric glassware must there-fore be clean and free of grease. Water should flow continuously on the glass surface without leaving any drops.
21
Ex. 5 (continued)
Cleaning: Volumetric glassware can normally be. cleaned by washing and brushing with a detergent solution. The cleaned glass should then be rinsed first with tap water and, finally, 4 or 5 times with distilled water.
(Stubborn dirt may be removed with chromic acid. The preparation and use of this reagent, however, is quite dangerous and should only be done by trained technicians.)
Volumetric glassware should be dried at room temperature (i.e. on a rack), never in a hot oven which may alter calibration.
Types of Glassware:
(a)Graduated Cylinders: Perhaps the most common type of
volumetric equipment. These range in size from 25 mL to 1000 mL. When using any graduated cylinder to measure a volume of liquid, remember to read the bottom of the meniscus. As shown below, it is important to have the eye at the same level as the meniscus to avoid parallax errors.
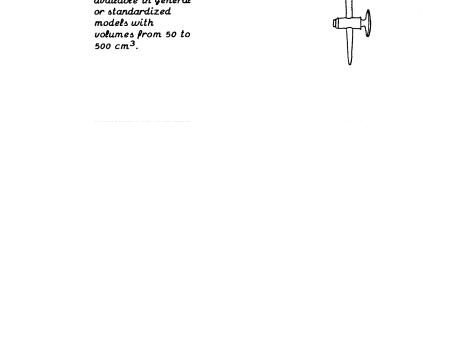
(b) Volumetric Flask: A type of volumetric equipment calibrated to contain a specified volume when filled to the line etched on the neck.
22
Ex. 5 (continued)
(c) Pipet: This piece of volumetric equipment is designed for the transfer of known volumes from one container to another. Pipets that deliver a fixed volume are called volumetric or transfer pipets (see below). Other pipets, calibrated in convenient units so that any volume up to a maximum capacity can be delivered, are known as measuring pipets.
Proper use of a transfer pipet (see diagram below):
23
Ex. 5 (continued)
(d)Buret: Like the measuring pipet, this piece of volumetric
equipment is designed to deliver any volume up to its maximum capacity. It is fitted with a stopcock for control of liquid flow. The buret is most commonly used for titration processes.
Titration: A process by which a substance to be measured is combined with a reagent and quantitatively measured. Ordinarily, this is accomplished by the controlled addition of a reagent of a known concentration to a solution of the substance until the reaction between the two is judged to be complete. The volume of the reagent is then measured.
Ex. 5 (continued)
PROCEDURE
1.Become familiar with the various pieces of volumetric equipment given to you.
2.Practice reading the meniscus of the liquid volume in the graduated cylinder.
3.Practice transferring a volume of liquid from one container to another using the pipet.
4.Prepare the solutions outlined in Exercise 6.
BIBLIOGRAPHY
ICCROM, Scientific Principles of Conservation Course, Course notes.
Shugar, G. - Shugar, R. - Bauman, L. - Bauman, R.S. Chemical technicians' ready reference handbook. New York: McGraw Hill, 1981.
24
25
Ex. 6 MEASUREMENT: SOLUTIONS
AIM
Most of the time, substances are not used pure. Instead, they are diluted in other substances to make solutions. This exercise will introduce you to various types of solutions and how to make them.
DEFINITIONS |
|
Solution: |
A homogeneous system of two or more substances |
|
which may be present in varying amounts. |
Solute: |
That substance which is dissolved or has gone |
|
into solution (e.g. sugar into water). It constitutes |
|
less than 50 percent of the solution. |
Solvent: |
That substance which does the dissolving (e.g. |
|
water dissolving sugar).It constitutes more |
|
than 50 percent of the solution. |
Composition: |
Mass of solute per unit mass of solvent. |
Concentration: Amount of solute per unit volume of solvent.
CALCULATIONS
There are many ways to express and prepare the concentration of laboratory solutions. These include:
Mass Percent: Grams of solute per 100 grams of solution (w/w*). E.g. 25 g of NaCl in 100 g of H2O.is a 20% by mass solution.
Why? Mass of solute |
= |
25 q |
= |
25 = 20% |
|||
|
|
|
|
|
|
|
|
|
Mass of solution |
|
25 g + 100 g |
|
125 |
|
|
*The density of water at 4°C is 1 g/cm3 = 1 g/mL. The terms milliliter and cubic centimeter (cc) are therefore usually interchangeable. One mL of water is also assumed to weigh approximately 1 gram (though it varies somewhat according to the temperature). Thus, in the case of mass percent solutions where the solute is water, 100 g of water can be assumed equal to 100 mL of water.
26
Ex. 6 (continued)
Volume Percent: Milliliters of solute per 100 milliliters of solution (used in the case of mixing liquids; a v/v percent).
E.g. 25 mL of acetone (1 part) diluted in 75 mL of
H2O (3 parts) = 25% by volume solution.
Why? Volume of solute___ = __25 mL |
= 25 = 25% |
|
Volume of solution |
25 + 75 mL |
100 |
Molar and Molal Solutions:
To understand these types of solutions, one must first grasp the concept of the mole.
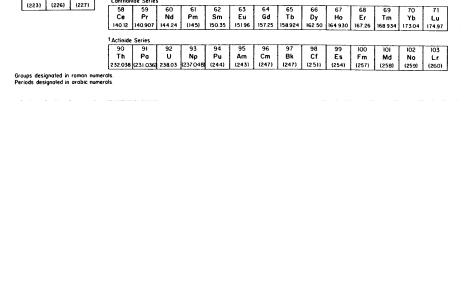
One mole (also called the gram-molecular mass) is the number of grams equal to the molecular weight of a substance. The gram-molecular mass can be calculated by adding the individual atomic masses (see the attached Periodic Table of Elements based on C = 12 g/mole*) of the component parts of a molecule.
E.g. to calculate the mass in grams of one mole of NaCl (table salt):
Na = 22.99 g/mole
Cl = 35.45 q/mole
NaCl = 58.44 g/mole
* Since the Periodic Table of Elements has been standardized around Carbon12 at 12 g/mole, a mole of any element contains the same number
of atoms. This number is called AVOGADRO'S NUMBER and equals 6.02 x 10²³.
Molality (m): The number of moles of solute per 1000 grams of solvent. This is a composition term.
E.g. 58.44 g of NaCl dissolved in 1000 g of H2O is a lm solution.
29.22 g of NaCl dissolved in 1000 g of H2O is a 0.5m solution.
Molarity (M): The number of moles of solute per liter or 1000 mL of solution. This is a concentration term.
E.g. If 58.44 g of NaCl are dissolved in H2O and the volume of the solution is 1000 mL, it is a 1M solution.
Molar concentrations are also indicated by square brackets. [HC1] = 1 means that a solution of HC1 is one molar.
MOLARITY is probably the most common system for calculating the concentration of solutions.
27
Ex. 6 (continued) |
|
|
MATERIALS/EQUIPMENT |
|
|
Balance, |
volumetric glassware (see Exercise |
5), sodium |
chloride, sodium sulfate, copper sulfate, alcohol, water.
PROCEDURE
1.Prepare 200 g of a 10% by mass solution of NaCl in water.
2.Prepare 200 mL of a 25% by volume solution of alcohol in water.
3.Prepare 100 mL of a 0.2M solution of copper sulfate (CuSO4. 5H20) in water.
- Calculate formula weight.
−Weigh desired quantity of solute.
−Transfer to volumetric flask; add water to line.
4.Prepare 250 mL of a 0.2M solution of sodium sulfate (Na2SO4 10H2O) in water.
For preparing solutions of definite molarity, the formula is: molecular mass of compound x molarity wanted x number of liters = grams of compound needed to make solution.
BIBLIOGRAPHY
ICCROM, Scientific Principles of Conservation Course, Course notes, 1977.
Shugar, G. - Shugar, R. - Bauman, L. - Bauman, R.S. Chemical technicians' ready reference handbook. New York: McGraw Hill, 1981.
28
Ex. 6 (continued)
Periodic Table of Elements
29
Ex. 7 MEASUREMENT: pH
AIM
It is often important for an architectural conservator to know whether a solution is acid, basic, or neutral. Such information is also critical in the analysis of meteorological agents such as rain or snow which could cause decay of building materials if excessively acid or alkaline (basic). The following experiment aims to explain the concept of pH and its measurement.
DEFINITIONS (Refer to BIBLIOGRAPHY for complete information). A
solution is:
Acid if there are more hydrogen ions than hydroxyl ions.
pH is a value that represents the acidity or alkalinity of a solution. It is defined as the logarithm of the reciprocal of [H+].
−A very acid solution has a pH of 1 (e.g. 0.1M HC1).
−A very basic solution has a pH of 14 (e.g. 1M caustic soda).
−A neutral solution has a pH of 7.
A buffer solution is one that tends to remain at a constant pH.
MEASUREMENTS
The pH of a solution may be measured in three ways:
1)By means of indicator solutions, that is by dyes that change color at a given pH (see attached table).
2)With pH test paper or "strips". These are commercially available paper strips which have been impregnated with an indicator (test papers are available for every value of pH). The strip is wet with the solution to be tested and immediately compared with the standard color chart provided for each paper and range. The pH can be visually determined by comparison of colors.
3)With an electronic device known as the pH-meter.
Ex. 7 (continued)
EQUIPMENT/MATERIALS
pH indicator strips, pH meter, various indicator solutions, various test solutions, beakers, glass stirring rods, blotting paper.
PROCEDURE
1.Using the pH strips, measure the pH of the solutions given to you. Record your results on the table below.
2.Repeat this procedure using the electronic pH meter. Record your results on the same table.
3.Check the pH range of the indicators given to you by adding a drop of the sample solutions of varying pH. Note color changes.
BIBLIOGRAPHY
ICCROM, Scientific Principles of Conservation Course, Course notes, 1977.
Shugar, G. - Shugar, R. - Bauman, L. - Bauman, R.S. Chemical technicians' ready reference handbook. New York: McGraw Hill, 1981.
Torraca, G. Solubility and solvents for conservation problems. Rome: ICCROM, 1975.
31
30