

imit_model / AnyLogic / UsersManual(AnyLogic)
.pdfAnyLogic V User’s Manual
Figure 139. Log window
The global log is convenient for output of information across several model replications, because it is not reset in between replications. It can also be used as a debugging tool, for example, to find out what is the order in which the model executes actions of different objects.
To write to the global log, you use the object Engine.log or the methods trace() and traceln() of the class ActiveObject. To write to the active object’s log, you use the member variable log of an active object. See section 14.4, “Logging a model” to know how to work with logs.
►To open the global log
1.Click the Global Log  toolbar button, or Choose View|Global Log from the main menu.
© 1992-2004 XJ Technologies http://www.xjtek.com |
277 |

 toolbar button, or Choose
AnyLogic V User’s Manual
Figure 140. Chart window
Chart window looks as shown in Figure 140.
Datasets and variables can be added to a chart window using drag and drop or using the
Chart Setup dialog box.
►To add a dataset or a variable to a chart window
1.Drag the dataset/variable from the Model Explorer onto the chart window.
►To set up the chart
1.Right-click the chart window and choose Chart Setup… from the popup menu. The Chart Setup dialog box is displayed (see Figure 141).
2.To add a variable to the chart, double-click the corresponding item in the Variables, parameters and datasets list.
© 1992-2004 XJ Technologies http://www.xjtek.com |
279 |

 button to the left of the
AnyLogic V User’s Manual
AnyLogic supports on-the-fly checking of model syntax.
AnyLogic allows you to view what is happening at the simulation engine at the lowest level details and make some changes to the event processing.
AnyLogic allows you to debug your model by throwing runtime errors and tracing model execution by setting breakpoints on model elements and writing custom information to AnyLogic logs.
AnyLogic detects logical errors of model execution and errors in your Java code. If such an error occurs, AnyLogic stops the model and notifies you with error message.
AnyLogic enables you to debug Java code using a third-party debugger by running the model within the debugger using command line execution feature or by attaching the debugger to the currently running model.
The detailed information on debugging a model is given in Chapter 14, “Debugging a model”.
11.4 Setting up model execution parameters
An AnyLogic model is executed with a set of simulation settings (simulation speed, number of model runs). You can adjust model execution settings by customizing AnyLogic experiments. See Chapter 13, “Simulation settings” to know how to set required model execution settings.
11.5 Optimizing a model
If you need to run a simulation and observe system behavior under certain conditions, as well as improve system performance, for example, by making decisions about system parameters and/or structure, you can use the optimization capability of AnyLogic. Simulating a model with different parameters, AnyLogic automatically finds the optimal values of model parameters, with respect to certain constraints. See Chapter 16, “Optimization” for details.
© 1992-2004 XJ Technologies http://www.xjtek.com |
281 |

Chapter 12. Animation
12. Animation
AnyLogic offers a unique animation technology that enables you to construct very complex 2D and 3D animations rapidly using the object structure of your model. It features:
•Modular development. You develop animations in a modular way, separately for each object. AnyLogic takes care of assembling the picture, performs placement and transformation of its elements.
•Scalability. Animation scales with your model as you vary its size.
•Reuse. Animations are associated with active objects. They can be incorporated into any higher-level animation scene associated with a container object. If you put an object into a library, animation is stored there as well.
•Integrated animation editor. AnyLogic animation editor is integrated with its model development environment, sharing the Project and Properties windows.
•Rich API. For sophisticated cases that cannot be specified using the graphical animation editor, AnyLogic offers a rich API capable of solving virtually any animation need.
•100% Java. AnyLogic animations are 100% Java.
•Web. Animations can be accessed over the Internet and displayed in Web browser as applets.
•Interactivity. 2D animations are interactive, offering the user a full range of controls (buttons, text inputs, checkboxes, sliders, knobs, etc.).
The animation window of the root object of a model automatically appears when the model starts. The speed of animation and, correspondingly, the speed at which the model runs, can be set in AnyLogic by specifying the mapping of model time units to seconds in real time mode.
12.1 Animation concepts
The basic idea behind AnyLogic animation technology is that animations (drawings constructed of elementary shapes) are associated with model components – active objects –
282 |
© 1992-2004 XJ Technologies http://www.xjtek.com |
AnyLogic V User’s Manual
and are composed according to the model hierarchy. In this section we describe animation of a standalone active object (section 12.1.1, “Reflecting the state of an object in animation”), then animation reflecting a hierarchical model (section 12.1.2, “Animating hierarchical models”). Interactive animations are considered in section 12.1.3, “Interactive control of animation”.
12.1.1Reflecting the state of an object in animation
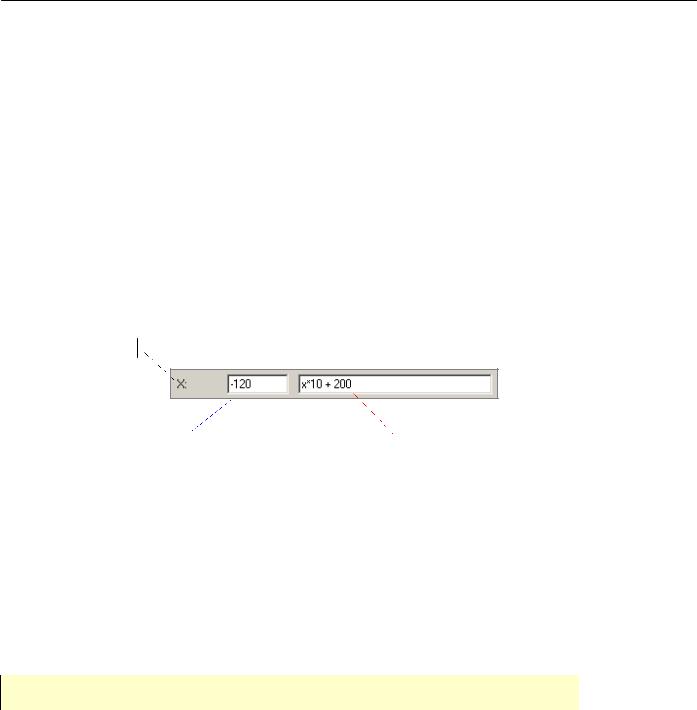
Each active object can have an associated animation. Animation is a drawing composed of various shapes: circles, rectangles, lines, etc., and also indicators and controls. Each shape has a number of properties defining its visual appearance: position, height, width, color, and so on. These properties are typically organized as shown in Figure 142:
Name of the property
Constant corresponding to the |
|
Expression defining the actual |
value in the editor (default) |
|
value during simulation |
|
|
|
Figure 142. Property of an animation shape
The static value on the left shows the value of the property as defined while drawing in the editor. It is also treated as a default value. The expression on the right defines the actual value during simulation. This is the place where you can link the appearance of a shape to any data of the active object. The data may change and it will be reflected in the picture. In case the expression is empty, the property retains the default static value throughout the whole simulation.
The actual values are only evaluated when the shape is visible.
An example of associating graphical properties of animation shapes with active object data is shown in Figure 143. Here the coordinates of the circle are dynamically defined by the variables x and y of the active object, and the rotation angle of the rectangle is defined by the object member variable alpha.
© 1992-2004 XJ Technologies http://www.xjtek.com |
283 |


AnyLogic V User’s Manual
Name: Line1
End point:


 X: 0 | x
Y: 110 | y
Name: Oval1


 X: 0 | x
Y: 110 | y
Figure 144. Pendulum animation
12.1.2Animating hierarchical models
When you create an encapsulated object, its animation automatically appears on the animation of a container object. This is called the encapsulated animation shape and is drawn as a rectangle showing the content of the animation of the encapsulated object. You can move, scale, and rotate an encapsulated animation shape in the animation editor, or you can assign expressions to necessary properties to allow a model to move, scale, and rotate an encapsulated animation shape at runtime.
Motion of a shape in an encapsulated animation is a composition of its motion defined in an encapsulated object and the motion of an encapsulated animation shape defined in a container object.
The animation of a container object can, in its turn, be encapsulated somewhere else, and so on to any desired level. This way, you can construct very complex animations in a modular way, developing individual pictures independently one from another.
Position and size of an encapsulated animation on a container animation can be changed dynamically. This can be defined in two ways:
•You can assign expressions to the properties of the animation developed for the class of the encapsulated object, or
•You can assign expressions to properties of the encapsulated animation shape on the animation diagram of the container.
© 1992-2004 XJ Technologies http://www.xjtek.com |
285 |
