

Лексические основы чтения спец текста
.pdfTapescripts
Unit 9
Text B
The income statement shows the flow of money during the given year. But we also describe the position the firm has reached as a result of all its past trading operations. We call this document the balance sheet. The balance sheet.
Now, essentially the balance sheet lists the assets the firm owns. It also lists its liabilities. What? L−I−A−B−I−L−I−T−I−E−S. OK? Good. Now by doing this the balance sheet provides us with a picture of the firm at a particular point of time, for example at the end of a year. I’ll now go through a balance sheet with you, so take a moment to look at this. It’s the balance sheet of Snark International on 31st December, 1987.
Let’s start with assets. Assets are what the firm owns. These assets are listed on the left, as you can see. Snark, this firm, has some cash in the bank. That’s one asset. It’s also owed some money by its customers, who haven’t paid yet. This money is shown as accounts receivable. That’s another asset. Yet another asset is the large inventories it has in its warehouses. Not only that, but it also owns a factory. This factory originally cost a quarter of a million, but notice that, because of depreciation, it’s now only worth two hundred thousand. Of course, it also has other equipment − desks, perhaps, or machinery − which originally cost Snark three hundred thousand. Again because of depreciation, this equipment is now worth a hundred and eighty thousand. So we can say, after adding all these assets up, that Snark is worth five hundred and ninety thousand.
Now let’s take a look at liabilities. Liabilities are what the firm owes. These liabilities are shown on the right of the balance sheet, as you can see, starting with accounts payable. These are bills that Snark owes but has not yet paid. It also hasn’t yet paid some salaries, some fifty thousand pounds’ worth. That’s also a liability. Then, there is a mortgage on the factory of a hundred and fifty thousand which it has negotiated with an insurance company. Finally there is a bank loan. That’s for shorter-term cash needs. Adding all that up, we can see that Snark has liabilities, or debts, of three hundred and fifty thousand. So we can say that the net worth of Snark, note that term ‘net worth’, is two hundred and forty thousand. That’s the excess of its assets over its liabilities.
Some of you may be wondering why Snark’s net worth is shown as a liability rather than an asset. The reason is simply because the firm is owned by its shareholders. So the net worth is really owed to them. It is a liability of the firm to the shareholders.
Now let’s imagine you have lots of money and you want to buy Snark. To make what we call a take-over bid, in fact. How much do you think you should offer? Eh? Well, you might think of offering two hundred and forty thousand, which is, after all, the net worth of the company. But I think probably not. Why not? Well, Snark is a live company. It’s got good prospects for future growth. It’s got a proven record. You have to remember you’re not just bidding for its physical and financial assets, less of course its liabilities. You’re actually bidding for the firm as a going concern. You will also get its reputation. Its customer loyalty. And a great many other things, all intangible. All these intangibles, like reputation and customer loyalty, we economists call goodwill.
71

Английский язык. Лексические основы чтения текстов по экономике
Reading Practice
Case Study 1
In the early 1980s there was a controversy over the “Fares Fair” policy of cutting bus and tube fares in London. Some people thought low fares would increase passengers and bring in extra revenue for London Transport, which runs the bus and tube services. Others thought that low fares would lead to disastrous losses in running London Transport. Eventually the matter was referred to the courts. Suppose you had been a consultant brought in to analyse the relationship between tube fares and revenue from running the tube: how would you have analysed the problem?
To organize our thinking, or – as economists describe it – to build a model, we require a simplified picture of reality which picks out the most important elements of the problem. We begin with the simple equation.
Total fare collection = fare × number of passengers |
(1) |
In this stark form, equation (1) emphasizes, and thus organizes our thoughts around, two factors: the fare and the number of passengers. London Transport directly controls the fare, but can influence the number of passengers only through the fare that is set. (Cleaner stations and better services might also encourage passengers, but we neglect these effects for the moment.)
It might be argued that the number of passengers is determined by habit, convenience, and tradition, and is therefore completely unresponsive to changes in fares. This is not the view or model of traveller behaviour that an economist would initially adopt. It is possible to travel by car, bus, taxi, or tube, and decisions about a mode of transport are likely to be sensitive to the relative costs of the competing alternatives. Thus in equation (1) we must not view the number of passengers as fixed but develop a ‘theory’ or ‘model’ (we use these terms interchangeably) of what determines the number of passengers. We must model the demand for tube journeys.
We can study the theory of demand in detail. Applying a little common sense, we can probably work out the most important elements straight away. First, the fare itself matters. Other things equal, higher tube fares reduce the quantity of tube journeys demanded. Of course, what matters is the price of the tube relative to the price of other means of transport – cars, buses, and taxis. If their prices remain constant, lower tube fares will encourage tube passengers. Rises in the price of these other means of transport will also encourage tube passengers even though tube fares remain unaltered.
We now have a bare-bones model of the demand for tube journeys. We summarize this model in the formal statement:
Quantity of tube journeys demanded = f (tube fare, taxi fare, petrol price, bus fare, ...) |
(2) |
This statement reads as follows. The quantity of tube journeys ‘depends on’, or ‘is a function of’, the tube fare, the taxi fare, petrol prices, bus fares, and some other things. The notation f (1) is just a shorthand for ‘depends on all the things listed inside the brackets’. In equation (2) we have named explicitly the most important determinants of the demand for tube journeys. The row of dots reminds us that we have omitted some possible determinants of the demand for tube journeys in an effort to simplify our analysis. For example, tube demand probably depends on the temperature. It gets very uncomfortable in the underground when it is
72

Reading Practice
very hot. Since the purpose of our model is to study changes in the number of tube passengers, it will probably be all right to neglect the weather provided weather conditions are broadly the same every year.
To answer our original question, it is not sufficient to know the factors on which the demand for tube journeys depends. We need to know how the number of passengers varies with each of the factors we have identified in our model. Other things equal, we assume that an increase in tube fares will reduce tube passengers and that an increase in the price of any of the competing modes of transport will increase tube passengers. To make real progress, we shall somehow have to quantify each of these separate effects. Then, given predictions for bus and taxi fares and the price of petrol, we would be able to use our model to predict the number of tube passengers who would want to travel at each possible tube fare that might be set by London Transport. Multiplying the fare per journey by the predicted corresponding number of journeys demanded at this fare, we could then predict London Transport revenue given any decision about the level of tube fares.
Writing down a model is a safe way of forcing ourselves to look for all the relevant effects, to worry about which effects must be taken into account and which are minor and can probably be ignored in answering the question we have set ourselves. Without writing down a model, we might have forgotten about the influence of bus fares on tube journeys, an omission that might have led to serious errors in trying to understand and forecast revenue raised from tube fares.
You have read the text. Check your understanding:
1)What controversy was there in 1980 over the ‘Fares Fair’ policy of cutting bus and tube fares in London?
2)How would economists organize the solution of fares problem?
3)How can the equation one organize our thoughts?
4)What organization directly controls the fares?
5)How can London Transport influence the number of passengers?
6)Is the number of passengers responsive to the changes in fares?
7)What theory or model should an economist develop to solve the problem of the number of passengers?
8)What is the relationship between fares and demand for tube journeys?
9)What is the dependence of the quantity of tube passengers on the fares of other means of transport?
10)For what purpose can we use the model given in the text?
11)How could we predict London Transport revenue?
12)What is the importance of building the model?
Case Study 2
Leipzig, East Germany's second largest city, has attracted attention from office developers as it changes from a planned to a market system. The city has a shortage of office space. Most of its existing space is obsolete compared with Western standards. Also, if Leipzig is to achieve the status of other German cities, it needs to develop another 2 or 3 million sq.ft of office space. Developers are receiving a number of incentives, including grants, favourable tax treatment, EC regional grants and subsidised lending rates. Another attractive feature for developers is the state of rents. Because of the shortages rents have risen sharply and Leipzig is seen as a good investment opportunity by many property speculators.
73

Английский язык. Лексические основы чтения текстов по экономике
However, there have been problems as the city copes with the transition.
Pollution from open cast mining in the countryside has disfigured much of Leipzig's building stock.
Inadequate building stock has resulted in housing shortages discouraging skilled workers from moving to the city. Hotel shortages have also restricted the number of visitors to Leipzig.
Poor transport infrastructure.
Many of the young and relatively well educated members of the population have migrated from the city. This has contributed to a population decline from 713,000 to 511,000 over a 50 year period.
Land ownership disputes have resulted in delays and frustration as land and property is transferred from the state to the private sector.
There has been a flood of goods from West Germany into the city.
You have read the text. Answer the questions:
1)How far are the problems facing Leipzig a result of it being formerly part of a planned economy?
2)How might cities such as Leipzig overcome the problems of changing from a planned to a mixed economy?
Case Study 3
The Determinants of Price Elasticity
What determines whether the price elasticity of demand for a good is high (say, -5) or low (say, -0,5)? Ultimately the answer must be sought in consumer tastes. If it is considered socially essential to own a television, higher television prices may have little effect on quantity demanded. If televisions are considered a frivolous luxury, the demand elasticity will be much higher. Psychologists and sociologists may be able to explain more fully than economists why tastes are as they are. Nevertheless, as economists, we can identify some considerations likely to affect consumer responses to changes in the price of a good. The most important consideration is the ease with which consumers can substitute another good that fulfils approximately the same function.
Consider two extreme cases. Suppose first that the price of all cigarettes is raised 1 per cent, perhaps because the cigarette tax has been raised. Do you expect the quantity of cigarettes demanded to fall by 5 per cent or by 0,5 per cent? Probably the latter. People who can easily quit smoking have already done so. A few smokers may try to cut down but this effect is unlikely to be large. In contrast, suppose the price of one particular brand of cigarettes is increased by 1 per cent, all other brand prices remaining unchanged. We should now expect a much larger quantity response from buyers. With so many other brands available at unchanged prices, consumers will switch away from the more expensive brand to other brands that basically fulfil the same function of nicotine provision. For a particular cigarette brand the demand elasticity could be quite high.
Ease of substitution implies a high demand elasticity for a particular good. In fact, our example suggests a general rule. The more narrowly we define a commodity (a particular brand of cigarettes rather than cigarettes in general, or oil rather than energy as a whole), the larger will be the price elasticity of demand.
74

Reading Practice
Measuring Price Elasticities
To illustrate these general principles we report estimates of price elasticities of demand in Table the. The table confirms that the demand for general categories of basic commodities, such as fuel, food, or even household durable goods, is inelastic. As a category, only services such as haircuts, the theatre, and sauna bath, have an elastic demand. Households simply do not have much scope to alter the broad pattern of their purchases.
In contrast, there is a much wider variation in the demand elasticities for narrower definitions of commodities. Even then, the demand for some commodities, such as dairy produce, is very inelastic. However, particular kinds of services such as entertainment and catering have a much more elastic demand. Small changes in the relative price of restaurant meals and theatre tickets may lead households to switch in large numbers between eating out and going to the theatre, whereas the demand for getting out of the house on a Saturday evening may be relatively insensitive to the price of all Saturday night activities taken as a whole.
|
|
|
Table 1 |
Estimates of price elasticities of demand in the UK |
|
||
|
|
|
|
Good |
Demand |
Good |
Demand |
(General Category) |
Elasticity |
(Narrower Category) |
Elasticity |
Fuel and light |
−0,47 |
Dairy produce |
−0,05 |
Food |
−0,52 |
Bread and cereals |
−0,22 |
Alcohol |
−0,83 |
Entertainment |
−1,40 |
Durables |
−0,89 |
Expenditure abroad |
−1,63 |
Services |
−1,02 |
Catering |
−2,61 |
You have read the text. Check your understanding:
1)What determines whether the price elasticity of demand for a good is high or low?
2)For what categories of commodities is demand usually inelastic?
3)Is the demand elasticity for narrower definitions of commodities high or low?
Case Study 4
Gurrinder Niijer owns a small business that manufactures carpet slippers.
She is considering expanding her production in the near future by taking on five extra workers. The existing workers are concerned about how much the new employees will be paid. They feel that there need to be pay differentials between themselves and the new workers.
Although Gurrinder has 5000 pounds of her own money to invest, she is likely to require a loan. Her bank has indicated that now is a good time to borrow as interest rates are low. However, it has also warned her that the government could force up rates in future if they needed to control the exchange rate or if inflation started to increase.
Gurrinder feels happy that she can pay back the loan quickly, because although the economy is still in recession, there is a strong local demand for her goods.
You have read the text. Answer the questions:
1)What are the: a) internal
b) external factors that may affect Gurrinder’s decision to expand?
2)How might the business be affected if the “strong local demand” for its products decreases?
75

Английский язык. Лексические основы чтения текстов по экономике
Case Study 5
The Price Responsiveness of Demand
The quantity demanded increases as the price of a good falls. Frequently we need to know by how much it will increase. The Table presents some numbers for the relation between ticket price and quantity demanded, other things equal.
Table 2
The demand for football tickets
Price |
Quantity of tickets demanded |
($/ticket) |
(thousands/ game) |
12.50 |
0 |
10.00 |
20 |
7.50 |
40 |
5.00 |
60 |
2.50 |
80 |
0 |
100 |
We see from the Table 2 that each price cut of $1 leads to 8000 extra ticket sales per game. Suppose, however, that we wish to compare the price responsiveness of football ticket sales with the price responsiveness of the quantity of cars demanded: clearly, $1 is a trivial cut in the price of a car and will have a negligible effect on the quantity of cars demanded. When commodities are measured in different units it is often best to examine the percentage change, which is unit-free. This suggests that we think about the effect of a 1 per cent price cut on the quantity of cars and football tickets demanded. Similarly, it is not the absolute number of cars and tickets we should examine but the percentage change in quantity demanded. Not only does this solve the problem of comparing things measured in different quantity units, it also takes account of the size of the market. Presumably an extra sale of 8000 tickets is more important when ticket sales are 4000 than when they number 40 000.
Responsiveness of demand to price changes is measured by the price elasticity of de-
mand.
The price elasticity of demand is the percentage change in the quantity of a good demanded divided by the corresponding percentage change in its price.
Although there are other demand elasticities – the cross price elasticity and the income elasticity – the (own) price elasticity is perhaps the most frequently used of the three. Whenever economists speak of the demand elasticity they mean the price elasticity of demand.
If a 1 per cent price increase reduces the quantity demanded by 2 per cent, the demand elasticity is –2. Because the quantity falls 2 per cent, we express this as a change of –2 per cent, then divide by the price change of 1 per cent (a price rise) to obtain – 2. If a price fall of 4 per cent increases the quantity demanded by 2 per cent, the demand elasticity is –½, since the quantity change of 2 per cent is divided by the price change of –4 per cent. Since demand curve slope down, we are either dividing a positive percentage change in quantity (a quantity rise) by a negative percentage change in price (a price fall), or dividing a negative percentage change in quantity (a quantity fall) by a positive percentage change in price (a price rise).
The price elasticity of demand tells us about movements along a demand curve and the demand elasticity must be a negative number.
76

Reading Practice
You have read the text. Check your understanding:
1)How can we measure the responsiveness of the quantity demanded to the price of the good?
2)What effect does the price cut have on the sales of the good?
3)What method is used when we compare commodities measured in different units?
4)Which of the three demand elasticities is most frequently used by economists?
5)How can you define the price elasticity of demand?
6)In what way is demand elasticity calculated?
Case Study 6
The Japanese market had long been one that seemed to work according to its own rules. The difficulty of producing software which used the Japanese language allowed a handful of domestic manufacturers, led by NEC, to carve up the personal computer (PC) market amongst them.
Price wars began in October 1991 when Compaq, a US firm, introduced a machine at half the price of Japanese machines. IBM, also a US company, followed suit. “We brought out low-priced models because it was the main way in which to differentiate between IBM’s and NEC’s machines”, – said Mr. Tsutomu Maruyama, director of Personal Systems Operations at IBM’s Japan General Business Company. IBM and Compaq both reported strong sales. In 1993, Dell, the US firm, announced a low price desktop computer for sale in the Japanese computer market. Shortly afterwards Toshiba announced its first low cost notebook PC.
Total prices after reduction
NEC |
Compaq |
Dell |
218 000 yen |
196 000 yen |
170 000 yen |
You have read the text. Answer the questions:
1)What possible problems of a market system are mentioned in this article?
2)What is the effect of the changes in prices on the allocation of resources in the computer market?
3)What might be the results of these changes for:
a)Japanese businesses;
b)US businesses?
Case Study 7
A useful tool for analyzing how an economy works is the circular flow of income. It is often used in macroeconomics – the study of the whole economy. The circular flow shows how money flows around the economy.
77
Английский язык. Лексические основы чтения текстов по экономике
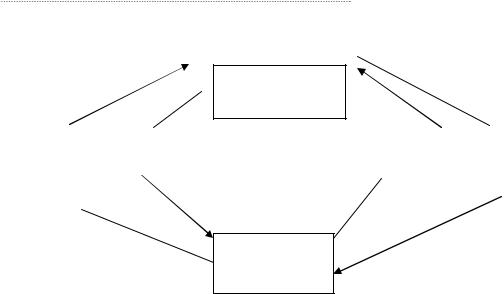
Figure 2. The circular flow of income
HOUSEHOLDS
Rent, |
Land, |
Goods |
Expenditure |
wages, (2) |
labor and (1) |
(4) and |
(3) on goods |
interest |
capital |
services |
and services |
and profit |
|
|
(consumption) |
BUSINESSES
In Figure 2, businesses (or producers) buy land, labor and capital from households – the users of goods and services (point 1). Households receive rent, wages, interest and profit (income) in return. This is shown as point 2. The money they earn is spent (point 3) on goods and services produced by businesses (point 4). So, money (or income) flows from businesses to households and back again – a circular flow of income around the economy.
How much money is flowing around the economy? The money earned by households, their income (Y), is spent on goods and services (E), which are produced by businesses – their output (O). In the national accounts of economies these are all defined so that they are equal. We can say that the value of :
Y = E = O
(where = represents “must equal”)
You have read the text. Check your understanding:
1)What does the circular flow of income show?
2)What do producers buy from households?
3)What do households receive from businesses?
4)On what do households spend the money they earn?
5)Why must the income of households equal the output of businesses?
Case Study 8
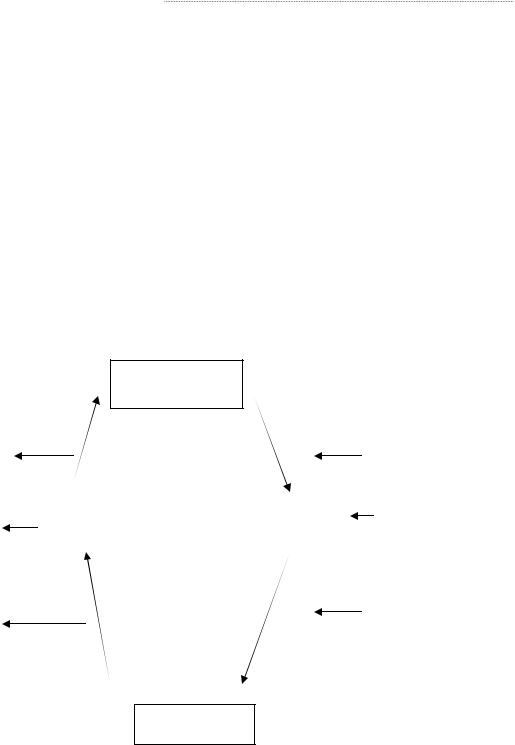
In theory households are supposed to spend all their money on goods and services. In practice they will spend some money (known as consumption) and save some as well. Savings take money out of the circular flow – a withdrawal.
What about businesses? They are not likely to spend all their revenue on rent and wages. They will also invest some in machinery and equipment. These are used to produce goods and services which increase money in the economy – an injection. There are a number of injections and withdrawals in a complex economy. Injections can include:
78
Reading Practice
•investment (I) – spending on fixed capital, such as machinery and factories, and circulating capital, such as stocks and work-in-progress which enter the circular flow;
•government spending (G) – spending by government on new schools and motorways or subsidies to firms;
•exports (X) – goods and services sold abroad, earning money for the UK which enters the circular flow of income.
Withdrawals can be:
•savings (S) – money saved by households;
•taxation (T) – money taken out of the economy from businesses and households by government through taxation;
•imports (M) – goods and services coming into the country paid for by money leaving the circular flow.
Figure 3. The circular flow of income showing injections and withdrawals
HOUSEHOLDS
|
|
Investment |
Savings |
|
|
|
|
|
|
|
|
|
|
|
|
Income |
|
Expenditure |
|
||
Taxes |
|
|
|
|
|
|
Government |
||
|
|
|
|
|
|
|
|
spending |
|
|
|
|
|
|
|
|
|
||
|
|
|
|
|
|
|
|
|
|
|
|
|
|
|
|
|
|
|
|
|
|
|
|
|
|
|
|
Exports |
|
|
|
|
|
|
|
|
|
|
|
|
Imports |
|
|
|
|
|
|
|
|
|
|
|
|
|
|
|
|
|
|
BUSINESSES
The value of a country’s economic activity is known as its Gross National Product (GNP). It can be measured using three methods:
•income method – adding up all the incomes earned by households (rent, wages, interest, profit);
•output method – adding up the value of all goods and services produced by businesses;
•expenditure method – adding up the spending of consumers (C), the investment of business (I), the expenditure of government (G) and the spending of people overseas on exports minus the spending of a country on imports (X – M). The relationship is expressed as:
79

Английский язык. Лексические основы чтения текстов по экономике
Y = C + I + G + (X – M)
where Y equals GNP.
Whichever method is used, it will give the same figure for GNP because income = output = expenditure. This is true of all circular flows of income.
|
You have read the text. Answer the questions: |
1) |
Describe the possible impact on the entertainment industry of the following events: |
a) greater availability of grants for setting up new businesses; |
|
b) a developing trend for consumers to devote more of their income to savings; |
|
c) a 2% reduction in income tax. |
|
2) |
Will these events be injections into or withdrawals from the circular flow of income? |
80