

111081-PDF-ENG
.PDFRestaurant Valuation: O’Charley’s and AFC |
111-081 |
Exhibit 5b O’Charley’s, Inc. Consolidated Statements of Earnings
Year Ended
December 30, |
December 31, |
December 25, |
2007 |
2006 |
2005 |
(in millions, except per share data)
Revenues:
Restaurant sales
Commissary sales
Franchise and other revenue
Costs and Expenses:
Cost of restaurant sales: Cost of food and beverage Payroll and benefits
Restaurant operating costs
Cost of restaurant sales, exclusive of depreciation and amortization shown separately below
Cost of commissary sales Advertising and marketing expenses General and administrative expenses
Depreciation and amortization, property and equipment Impairment, disposal and restructuring charges, net Pre-opening costs
Income from Operations
Other Expense (Income):
Interest expense, net
Other, net
$ 969.5 |
$ 978.8 |
$ 921.3 |
7.8 |
10.2 |
8.5 |
0.5 |
0.5 |
0.4 |
977.8 |
989.5 |
930.2 |
284.1 |
291.8 |
277.4 |
331.1 |
328.9 |
318.5 |
184.8 |
185.8 |
172.4 |
800.0 |
806.5 |
768.3 |
7.7 |
9.1 |
7.7 |
32.5 |
27.9 |
25.5 |
49.3 |
52.2 |
42.8 |
50.9 |
46.6 |
43.8 |
16.5 |
2.1 |
7.3 |
3.1 |
4.6 |
6.3 |
960.0 |
949.0 |
901.7 |
17.8 |
40.5 |
28.5 |
12.3 |
14.4 |
14.4 |
— |
— |
— |
12.3 |
14.4 |
14.4 |
Earnings Before Income Taxes and Cumulative Effect of |
|
|
|
|
|
|
Change in Accounting Principle |
|
5.5 |
|
26.1 |
|
14.0 |
Income Tax (Benefit) / Expense |
|
(1.7) |
|
7.2 |
|
2.0 |
Earnings Before Cumulative Effect of Change in Accounting |
|
|
|
|
|
|
Principle |
|
7.2 |
|
18.9 |
|
12.0 |
Cumulative Effect of Change in Accounting Principle, net of tax |
|
— |
|
— |
|
(0.1) |
Net Earnings |
$ |
7.2 |
$ |
18.9 |
$ |
11.9 |
Basic Earnings per Common Share |
$ |
0.31 |
$ |
0.81 |
$ |
0.52 |
Diluted Earnings Per Common Share |
$ |
0.31 |
$ |
0.80 |
$ |
0.51 |
Weighted-average shares outstanding: |
|
|
|
|
|
|
Basic |
|
23.4 |
|
23.3 |
|
22.8 |
Diluted |
|
23.6 |
|
23.6 |
|
23.1 |
|
|
|
|
|
|
|
11
Purchased by: Elena Shakina elena_shakina@mail.ru on November 04, 2013

111-081 |
Restaurant Valuation: O’Charley’s and AFC |
Exhibit 5c O’Charley’s, Inc. Consolidated Statements of Cash Flows
|
|
|
Year Ended |
|
|
|
|
December 30, |
December 31, |
December 25, |
|||
|
2007 |
2006 |
2005 |
|||
|
|
|
(in millions) |
|
|
|
Cash Flows from Operating Activities: |
|
|
|
|
|
|
Net earnings |
$ |
7.2 |
$ |
18.9 |
$ |
11.9 |
Adjustments to reconcile net earnings to net provided by |
|
|
|
|
|
|
operating activities |
|
|
|
|
|
|
Depreciation and amortization, property and equipment |
|
50.9 |
|
46.6 |
|
43.8 |
Amortization of debt issuance costs |
|
0.9 |
|
1.3 |
|
1.4 |
Deferred income taxes and other income tax related items |
|
(7.8) |
|
(7.5) |
|
(3.7) |
Share-based compensation |
|
4.0 |
|
2.7 |
|
0.5 |
Amortization of deferred gain on sale-leasebacks |
|
(1.1) |
|
(1.1) |
|
(1.1) |
Loss on the sale assets |
|
0.2 |
|
0.1 |
|
0.2 |
Impairment, disposal and restructuring charges, net |
|
14.0 |
|
2.5 |
|
7.3 |
Changes in assets and liabilities: |
|
|
|
|
|
|
Trade accounts receivable |
|
(2.4) |
|
(2.1) |
|
(3.3) |
Inventories |
|
12.3 |
|
14.7 |
|
(12.0) |
Other current assets |
|
1.4 |
|
(0.4) |
|
0.4 |
Trade accounts payable |
|
(6.7) |
|
(4.3) |
|
7.6 |
Deferred revenue |
|
(2.0) |
|
(1.6) |
|
2.2 |
Accrued payroll, accrued expenses, and federal, state |
|
(9.9) |
|
11.1 |
|
3.8 |
and local taxes |
|
|
|
|
|
|
Other long-term assets and liabilities |
|
3.9 |
|
2.3 |
|
2.9 |
Tax benefit derived from exercise of stock options |
|
— |
|
— |
|
0.8 |
Net cash provided by operating activities |
|
64.9 |
|
83.2 |
|
62.7 |
Cash Flows from Investing Activities: |
|
|
|
|
|
|
Additions to property and equipment |
|
(52.0) |
|
(53.6) |
|
(68.8) |
Proceeds from the sale of assets |
|
14.7 |
|
7.9 |
|
3.4 |
Other, net |
|
0.1 |
|
(0.3) |
|
2.0 |
Net cash used in investing activities |
|
(37.2) |
|
(46.0) |
|
(63.4) |
Cash Flows from Financing Activities: |
|
|
|
|
|
|
Proceeds from long-term debt |
|
— |
|
— |
|
5.9 |
Payments on long-term debt and capitalized lease |
|
|
|
|
|
|
obligations |
|
(10.4) |
|
(31.7) |
|
(15.9) |
Dividends paid |
|
(4.2) |
|
— |
|
— |
Shares repurchased |
|
(30.0) |
|
— |
|
— |
Excess tax benefit from share-based payments |
|
0.7 |
|
0.7 |
|
— |
Debt issuance costs |
|
(0.1) |
|
(1.0) |
|
— |
Proceeds from the exercise of stock options |
|
6.3 |
|
8.9 |
|
5.6 |
Net cash used in financing activities |
|
(37.7) |
|
(23.1) |
|
(4.4) |
(Decrease) increase in cash and cash equivalents |
|
(9.9) |
|
14.2 |
|
(5.1) |
Cash and cash equivalents at beginning of the year |
|
19.9 |
|
5.7 |
|
10.8 |
Cash and cash equivalents at end of the year |
$ |
10.0 |
$ |
19.9 |
$ |
5.7 |
|
|
|
|
|
|
|
Source: O’Charley’s Annual Report 2007.
12
Purchased by: Elena Shakina elena_shakina@mail.ru on November 04, 2013
111-081 -13-
Exhibit 6 AFC System-Wide Store Data
Panel A Store Roll-Out and Sales Changes
2013 04, November on ru.shakina@mail_elena Shakina Elena by: Purchased
Restaurants, Beginning
New Restaurants
Unit Conversions, Net
Permanent Closings
Temporary (Closings)/Re-Openings, Net
Restaurants, Ending
Same-Store Sales Changes
Domestic
International
Global System-Wide
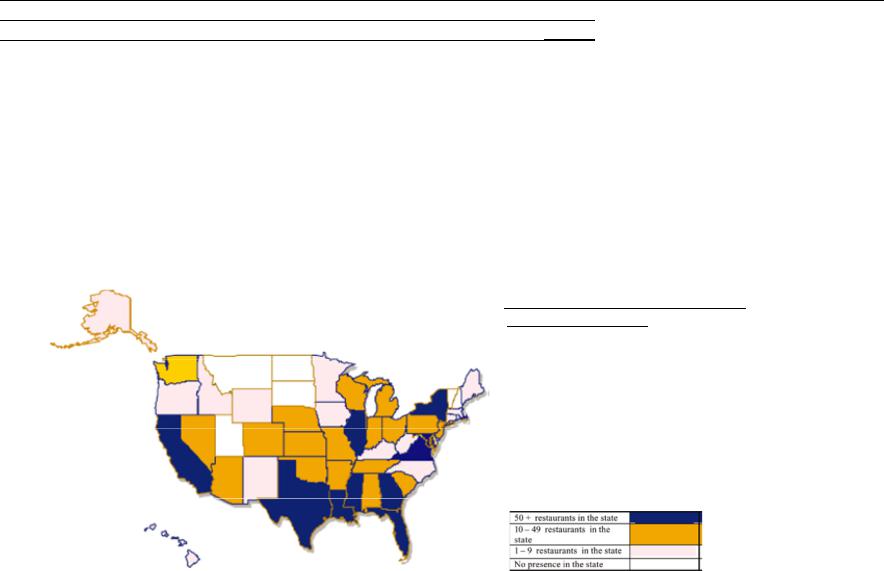
Panel B Geographic Footprint
Source: AFC Enterprises Annual Report 2007.
|
Company-Owned |
|
|
Franchised |
|
|
Total System |
|
|||
2007 |
2006 |
2005 |
2004 |
2007 |
2006 |
2005 |
2004 |
2007 |
2006 |
2005 |
2004 |
56 |
32 |
56 |
80 |
1,822 |
1,796 |
1,769 |
1,726 |
1,878 |
1,828 |
1,825 |
1,806 |
5 |
3 |
1 |
0 |
119 |
139 |
122 |
109 |
124 |
142 |
123 |
109 |
1 |
12 |
2 |
(19) |
(1) |
(12) |
(2) |
19 |
0 |
0 |
0 |
0 |
(3) |
(3) |
(7) |
(4) |
(106) |
(93) |
(95) |
(77) |
(109) |
(96) |
(102) |
(81) |
6 |
12 |
(20) |
(1) |
6 |
(8) |
2 |
(8) |
12 |
4 |
(18) |
(9) |
65 |
56 |
32 |
56 |
1,840 |
1,822 |
1,796 |
1,769 |
1,905 |
1,878 |
1,828 |
1,825 |
|
|
|
|
|
|
|
|
|
|
|
|
-7.8% |
9.0% |
6.5% |
0.9% |
-2.1% |
1.3% |
3.2% |
1.4% |
|
|
|
|
|
|
|
|
1.1% |
-3.2% |
-4.2% |
-6.0% |
|
|
|
|
|
|
|
|
|
|
|
|
-2.0% |
1.1% |
2.6% |
-0.6% |
2007 Restaurants
Domestic Restaurants: |
|
Company-Owned |
65 |
Franchisee |
1,518 |
International Restaurants: |
|
Company-Owned |
0 |
Franchisee |
322 |
Worldwide Restaurants |
1,905 |

111-081 Restaurant Valuation: O’Charley’s and AFC
Exhibit 7a AFC Enterprises, Inc. Consolidated Balance Sheets
|
|
Year Ended |
|
|
|
December 30, |
December 31, |
||
|
|
2007 |
|
2006 |
|
|
(in millions) |
|
|
ASSETS |
|
|
|
|
Current assets: |
|
|
|
|
Cash and cash equivalents |
$ |
5.0 |
$ |
6.7 |
Accounts and current notes receivable, net |
|
13.1 |
|
12.9 |
Prepaid income taxes |
|
0.5 |
|
7.4 |
Other current assets |
|
16.6 |
|
15.6 |
Total current assets |
|
35.2 |
|
42.6 |
Long-term assets: |
|
|
|
|
Property and equipment, net |
|
42.4 |
|
39.9 |
Goodwill |
|
11.7 |
|
11.7 |
Trademarks and other intangible assets, net |
|
51.6 |
|
52.4 |
Other long-term assets, net |
|
14.1 |
|
16.5 |
Total long-term assets |
|
119.8 |
|
120.5 |
Total assets |
$ |
155.0 |
$ |
163.1 |
LIABILITIES AND SHAREHOLDERS’ DEFICIT |
|
|
|
|
Current liabilities: |
|
|
|
|
Accounts payable |
$ |
26.1 |
$ |
23.8 |
Other current liabilities |
|
14.9 |
|
10.9 |
Current debt maturities |
|
14.0 |
|
1.4 |
Total current liabilities |
|
55.0 |
|
36.1 |
Long-term liabilities: |
|
|
|
|
Long-term debt |
|
118.8 |
|
132.6 |
Deferred credits and other long-term liabilities |
|
21.5 |
|
25.6 |
Total long-term liabilities |
|
140.3 |
|
158.2 |
Commitments and contingencies |
|
|
|
|
Shareholders’ deficit: |
|
|
|
|
Common stock ($.01 par value; 150,000,000 shares authorized; |
|
|
|
|
27,356,105 and 29,487,648 shares issued and outstanding at the |
|
|
|
|
end of fiscal years 2007 and 2006, respectively) |
|
0.3 |
|
0.3 |
Capital in excess of par value |
|
127.7 |
|
161.7 |
Notes receivable from officers, including accrued interest |
|
— |
|
— |
Accumulated deficit |
|
(168.5) |
|
(194.4) |
Accumulated other comprehensive income |
|
0.2 |
|
1.2 |
Total shareholders’ deficit |
|
(40.3) |
|
(31.2) |
Total liabilities and shareholders’ deficit |
$ |
155.0 |
$ |
163.1 |
|
|
|
|
|
14
Purchased by: Elena Shakina elena_shakina@mail.ru on November 04, 2013

Restaurant Valuation: O’Charley’s and AFC |
111-081 |
Exhibit 7b AFC Enterprises, Inc. Consolidated Statements of Operations
|
|
|
Year Ended |
|
|
|
|
December, |
December, |
|
December, |
||
|
|
2007 |
|
2006 |
|
2005 |
|
|
(in millions, except per share data) |
||||
Revenues: |
|
|
|
|
|
|
Sales by company-operated restaurants |
$ |
80.0 |
$ |
65.2 |
$ |
60.3 |
Franchise revenues |
|
82.8 |
|
82.6 |
|
77.5 |
Other revenues |
|
4.5 |
|
5.2 |
|
5.6 |
Total revenues |
|
167.3 |
|
153.0 |
|
143.4 |
Expenses: |
|
|
|
|
|
|
Restaurant employee, occupancy and other expenses |
|
40.7 |
|
33.7 |
|
30.5 |
Restaurant food, beverages and packaging |
|
27.3 |
|
21.3 |
|
20.6 |
General and administrative expenses |
|
49.5 |
|
48.1 |
|
68.7 |
Depreciation and amortization |
|
6.9 |
|
6.4 |
|
7.3 |
Other expenses (income), net |
|
(2.7) |
|
(1.8) |
|
23.2 |
Total expenses |
|
121.7 |
|
107.7 |
|
150.3 |
Operating profit (loss) |
|
45.6 |
|
45.3 |
|
(6.9) |
Interest expense, net |
|
8.7 |
|
11.1 |
|
6.8 |
Income (loss) before income taxes and discounted |
|
|
|
|
|
|
operations |
|
36.9 |
|
34.2 |
|
(13.7) |
Income tax expense (benefit) |
|
13.8 |
|
12.0 |
|
(5.3) |
Income (loss) before discounted operations |
|
23.1 |
|
22.2 |
|
(8.4) |
Discounted operations, net of income taxes |
|
— |
|
0.2 |
|
158.0 |
Net income |
$ |
23.1 |
$ |
22.4 |
$ |
149.6 |
Earnings per common share, basic: |
|
|
|
|
|
|
Income (loss) before discounted operations |
$ |
0.81 |
$ |
0.75 |
$ |
(0.29) |
Discounted operations, net of income taxes |
|
— |
|
0.01 |
|
5.43 |
Net income |
$ |
0.81 |
$ |
0.76 |
$ |
5.14 |
Earnings per common share, diluted: |
|
|
|
|
|
|
Income (loss) before discounted operations |
$ |
0.80 |
$ |
0.74 |
$ |
( 0.29) |
Discounted operations, net of income taxes |
|
— |
|
0.01 |
|
5.43 |
Net income |
$ |
0.80 |
$ |
0.75 |
$ |
5.14 |
Weighted-average shares outstanding: |
|
|
|
|
|
|
Basic |
|
28.6 |
|
29.5 |
|
29.1 |
Diluted |
|
28.8 |
|
29.8 |
|
29.1 |
|
|
|
|
|
|
|
15
Purchased by: Elena Shakina elena_shakina@mail.ru on November 04, 2013

111-081 |
Restaurant Valuation: O’Charley’s and AFC |
Exhibit 7c AFC Enterprises, Inc. Consolidated Statements of Cash Flows
Cash flows provided by (used in) operating activities:
Net income
Adjustments to reconcile net income to net cash provided by (used in) operating activities:
Discounted operations Depreciation and amortization Asset write-downs
Net gain on sale of assets
Gain on insurance recoveries related to asset damages, net Deferred income taxes
Non-cash interest, net Provision for credit losses
Excess tax benefits from stock-based compensation Stock-based compensation expense
Change in operating assets and liabilities: Accounts receivable
Prepaid income taxes Other operating assets
Accounts payable and other operating liabilities
Net cash provided by operating activities of continuing operations Net cash (used in) operating activities of discounted operations
Cash flows provided by (used in) investing activities:
Capital expenditures of continuing operations Proceeds from dispositions of property and equipment Property insurance proceeds
Proceeds relating to the sale of discontinued operations, net Acquisition of franchised restaurants
Purchases of short-term investments
Sales and maturities of short-term investments Proceeds from and issuance of notes receivable
Net cash provided by (used in) investing activities
Cash flows provided by (used in) financing activities:
Proceeds from 2005 credit facility
Principal payments—2005 credit facility (term loans) Net borrowings under 2005 revolving credit facility
Principal payments—2002 credit facility, and other notes, net Special cash dividend
Stock repurchases
Proceeds and tax benefits from exercise of employee stock options Decrease in bank overdrafts, net
(Increase) decrease in restricted cash Debt issuance costs, other
Net cash (used in) financing activities
Net (decrease) in cash and cash equivalents
Cash and cash equivalents at beginning of year
Cash and cash equivalents at end of year
Year Ended December
2007 |
2006 |
2005 |
|
(in millions) |
|
$ 23.1 |
$ 22.4 |
$ 149.6 |
— |
(0.2) |
(158.0) |
6.9 |
6.4 |
7.3 |
1.9 |
0.1 |
5.8 |
(0.3) |
(2.3) |
(1.4) |
(3.2) |
— |
— |
(0.5) |
2.2 |
9.3 |
(0.3) |
0.4 |
1.7 |
0.4 |
(0.3) |
(0.3) |
(0.9) |
(1.8) |
— |
1.7 |
3.4 |
2.9 |
(0.6) |
2.0 |
(2.9) |
7.8 |
25.8 |
(69.2) |
0.4 |
(0.4) |
5.1 |
4.0 |
(9.0) |
(15.2) |
40.4 |
48.7 |
(65.3) |
—— (7.4)
(10.0) |
(7.0) |
(4.2) |
0.3 |
4.3 |
3.1 |
4.5 |
3.5 |
— |
—— 367.6
(0.4) |
(9.3) |
(2.2) |
— |
(5.9) |
(275.0) |
— |
36.7 |
244.2 |
0.8 |
0.8 |
0.9 |
(4.8) |
23.1 |
334.4 |
—— 190.0
(6.9) |
(59.5) |
(0.5) |
5.0 |
— |
— |
(0.1) |
(1.3) |
(90.4) |
(0.7) |
(0.7) |
(350.8) |
(39.4) |
(24.4) |
(15.4) |
4.2 |
12.5 |
17.5 |
— |
— |
(6.4) |
1.1 |
0.7 |
(3.8) |
(0.5) |
(0.6) |
(6.7) |
(37.3) |
(73.3) |
(266.5) |
(1.7) |
(1.5) |
(4.8) |
6.7 |
8.2 |
13.0 |
$ 5.0 |
$ 6.7 |
$ 8.2 |
Source: AFC Enterprises Annual Report 2007.
16
Purchased by: Elena Shakina elena_shakina@mail.ru on November 04, 2013

Restaurant Valuation: O’Charley’s and AFC |
111-081 |
Exhibit 8 Financial Ratios
|
|
O'Charley's |
|
|
|
AFC |
|
|
|
|
2007 |
2006 |
2005 |
2007 |
2006 |
2005 |
|
DECOMPOSING PROFITABILITY: DUPONT ALTERNATIVE |
|
|
|
|
|
|
|
|
|
NOPAT / Sales |
2.4% |
3.0% |
2.6% |
17.1% |
19.3% |
107.2% |
|
x Sales / Net Assets |
1.90 |
1.87 |
1.82 |
1.74 |
1.65 |
0.67 |
||
= |
Operating ROA |
4.5% |
5.5% |
4.7% |
29.7% |
32.0% |
72.2% |
|
|
Spread |
-8.2% |
-0.3% |
-2.1% |
25.4% |
26.9% |
66.4% |
|
x |
Net Financial Leverage |
33.2% |
51.5% |
54.5% |
-408.0% -289.9% |
51.2% |
||
= |
Financial Leverage Gain |
-2.7% |
-0.1% |
-1.1% |
-103.7% |
-78.0% |
34.0% |
|
|
ROE (Operating ROA + Spread * Net Financial Leverage) |
1.8% |
5.4% |
3.6% |
-74.0% |
-46.0% |
106.2% |
|
EVALUATING OPERATING MANAGEMENT |
|
|
|
|
|
|
|
|
Key Growth Rates: |
|
|
|
|
|
|
|
|
|
Annual Sales Growth |
-1.2% |
6.4% |
6.7% |
0.09 |
0.07 |
-0.13 |
|
|
Annual Net Income Growth |
-61.7% |
58.7% |
-49.0% |
0.03 |
-0.85 |
5.08 |
|
Key Profitability Ratios: |
|
|
|
|
|
|
|
|
|
Sales / Sales |
100.0% |
100.0% |
100.0% |
100.0% |
100.0% |
100.0% |
|
|
Cost of Sales / Sales |
81.8% |
82.4% |
83.4% |
|
40.6% |
35.9% |
35.6% |
|
Gross Margin |
18.2% |
17.6% |
16.6% |
59.4% |
64.1% |
64.4% |
|
|
SG&A / Sales |
9.5% |
8.6% |
7.9% |
29.6% |
31.4% |
47.9% |
|
|
Other Operating Expense / Sales |
5.2% |
4.7% |
4.7% |
4.1% |
4.2% |
5.1% |
|
|
Investment Income / Sales |
0.0% |
0.0% |
0.0% |
0.0% |
0.0% |
0.0% |
|
|
Other Income, net of Other Expense / Sales |
-1.7% |
-0.2% |
-0.9% |
1.6% |
1.2% |
-16.2% |
|
|
Minority Interest / Sales |
0.0% |
0.0% |
0.0% |
|
0.0% |
0.0% |
0.0% |
|
EBIT Margin |
1.8% |
4.1% |
3.1% |
27.3% |
29.6% |
-4.8% |
|
|
Net Interest Expense (Income) / Sales |
1.3% |
1.5% |
1.5% |
|
5.2% |
7.3% |
4.7% |
|
Pre-Tax Income Margin |
0.6% |
2.6% |
1.5% |
22.1% |
22.4% |
-9.6% |
|
|
Taxes / Sales |
-0.2% |
0.7% |
0.2% |
8.2% |
7.8% |
-3.7% |
|
|
Unusual Gains, Net of Unusual Losses (after tax) / Sales |
0.0% |
0.0% |
0.0% |
|
0.0% |
0.1% |
110.2% |
|
Net Income Margin |
0.7% |
1.9% |
1.3% |
13.8% |
14.6% |
104.3% |
|
|
EBITDA Margin |
7.1% |
8.9% |
7.9% |
31.4% |
33.8% |
0.3% |
|
|
NOPAT Margin |
2.4% |
3.0% |
2.6% |
17.1% |
19.3% |
107.2% |
|
|
Recurring NOPAT Margin |
4.6% |
3.1% |
3.4% |
16.1% |
18.5% |
7.0% |
|
17
Purchased by: Elena Shakina elena_shakina@mail.ru on November 04, 2013

111-081 |
Restaurant Valuation: O’Charley’s and AFC |
Exhibit 8 Financial Ratios (continued)
|
O'Charley's |
|
|
|
AFC |
|
|
|
2007 |
2006 |
2005 |
2007 |
2006 |
2005 |
|
EVALUATING INVESTMENT MANAGEMENT |
|
|
|
|
|
|
|
Working Capital Management: |
|
|
|
|
|
|
|
Operating Working Capital / Sales |
-3.7% |
-1.9% |
-3.1% |
0.7% |
3.3% |
84.9% |
|
Operating Working Capital Turnover |
-27.2 |
-51.9 |
-32.0 |
139.4 |
30.6 |
1.2 |
|
Accounts Receivable Turnover |
65.6 |
82.0 |
104.5 |
13.0 |
9.1 |
10.8 |
|
Inventory Turnover |
25.9 |
18.1 |
23.4 |
136.0 |
137.5 |
N/A |
|
Accounts Payable Turnover |
45.7 |
37.3 |
54.4 |
2.9 |
2.1 |
1.2 |
|
Days' Receivables |
5.6 |
4.4 |
3.5 |
28.1 |
40.3 |
33.9 |
|
Days' Inventory |
14.1 |
20.2 |
15.6 |
2.7 |
2.7 |
N/A |
|
Days' Payables |
8.0 |
9.8 |
6.7 |
127.8 |
173.2 |
297.1 |
|
Long-Term Asset Management: |
|
|
|
|
|
|
|
Net Long-Term Assets Turnover |
1.77 |
1.80 |
1.72 |
1.76 |
1.75 |
1.57 |
|
Net Long-Term Assets / Sales |
56.4% |
55.4% |
58.1% |
56.7% |
57.2% |
63.7% |
|
PP&E Turnover |
2.11 |
2.13 |
2.06 |
4.19 |
4.12 |
3.04 |
|
Depreciation & Amortization / Sales |
5.3% |
4.8% |
4.9% |
4.1% |
4.2% |
5.1% |
|
EVALUATING FINANCIAL MANAGEMENT |
|
|
|
|
|
|
|
Short-Term Liquidity: |
|
|
|
|
|
|
|
Current Ratio |
0.77 |
0.78 |
0.68 |
1.18 |
1.64 |
2.26 |
|
Quick Ratio |
0.32 |
0.16 |
0.21 |
0.54 |
1.06 |
0.31 |
|
Cash Ratio |
0.18 |
0.05 |
0.11 |
0.19 |
0.79 |
0.19 |
|
Operating Cash Flow Ratio |
0.74 |
0.86 |
0.79 |
1.27 |
1.37 |
-0.91 |
|
Debt and Long-Term Solvency: |
|
|
|
|
|
|
|
Liabilities-to-Equity |
0.79 |
0.97 |
0.99 |
-6.23 |
-5.37 |
1.57 |
|
Debt-to-Equity |
0.38 |
0.53 |
0.58 |
-4.29 |
-3.93 |
0.66 |
|
Net-Debt-to-Equity |
0.33 |
0.51 |
0.55 |
-4.08 |
-2.90 |
0.51 |
|
Debt-to-Capital |
0.28 |
0.35 |
0.37 |
1.30 |
1.34 |
0.40 |
|
Net-Debt-to-Net Capital |
0.25 |
0.34 |
0.35 |
1.32 |
1.53 |
0.34 |
|
Interest Coverage Ratio: |
|
|
|
|
|
|
|
Interest Coverage |
1.45 |
2.81 |
1.97 |
5.24 |
3.71 |
12.64 |
|
Payout Ratio: |
|
|
|
|
|
|
|
Dividend Payout Ratio |
59% |
N/A |
N/A |
3% |
3% |
234% |
|
Sustainable Growth Rate: |
1% |
5% |
4% |
-72% |
-45% |
-143% |
|
Source: Casewriters based on data from O’Charley’s 10-Ks and AFC’s 10-Ks.
18
Purchased by: Elena Shakina elena_shakina@mail.ru on November 04, 2013

111-081 -19-
Exhibit 9 Comparable Firm Comparison ($ in Millions; Data as of December 31, 2007)
|
|
|
|
|
YoY |
4-Yr |
|
Net |
|
|
|
|
|
|
|
|
Total |
%Company- |
Market |
Revenue |
Revenue |
Net |
Profit |
Total |
Asset |
Beg |
|
|
|
Company |
Description |
Units |
Owned |
Cap |
Revenue Growth |
Growth |
Income |
Margin |
Assets |
Turnover |
Equity |
ROE |
P/B |
P/E |
2013 04, November on ru.shakina@mail_elena Shakina Elena by: Purchased
Brinker International |
Owns and franchises various brands |
1,801 |
70.6% |
$2,154 |
$4,377 |
5.4% |
8.6% |
$230 |
5.3% |
$2,318 |
1.9 |
$1,076 |
21.4% |
2.7x |
9.4x |
|
(Chili’s Grill & Bar, On The Border, |
|
|
|
|
|
|
|
|
|
|
|
|
|
|
|
and Maggiano's). |
|
|
|
|
|
|
|
|
|
|
|
|
|
|
Burger King Holdings |
Owns and franchises fast food |
11,283 |
11.5% |
$3,836 |
$2,234 |
9.1% |
7.8% |
$148 |
6.6% |
$2,517 |
0.9 |
$567 |
26.1% |
5.4x |
25.9x |
|
hamburger restaurants. |
|
|
|
|
|
|
|
|
|
|
|
|
|
|
California Pizza Kitche Owns and franchises a chain of |
231 |
83.5% |
$442 |
$633 |
14.1% |
15.2% |
$15 |
2.3% |
$367 |
1.7 |
$208 |
7.1% |
2.0x |
29.9x |
|
|
casual dining restaurants. |
|
|
|
|
|
|
|
|
|
|
|
|
|
|
CKE Restaurants |
Owns and franchises quick-service |
3,105 |
36.9% |
$693 |
$1,588 |
4.6% |
3.9% |
$31 |
2.0% |
$794 |
2.0 |
$309 |
10.1% |
4.8x |
22.3x |
|
restaurants such as Carl's Jr., Green |
|
|
|
|
|
|
|
|
|
|
|
|
|
|
|
Burrito, Red Burrito, and Hardee's. |
|
|
|
|
|
|
|
|
|
|
|
|
|
|
Denny's Corp. |
Owns and operates family-style |
1,546 |
25.5% |
$355 |
$939 |
-5.5% |
-0.04% |
$35 |
3.7% |
$381 |
2.5 |
($224) |
-15.5% |
NM |
10.2x |
|
restaurants. |
|
|
|
|
|
|
|
|
|
|
|
|
|
|
DineEquity |
Owns and franchises full-service |
3,320 |
20.5% |
$626 |
$485 |
38.6% |
4.6% |
($0) |
-0.1% |
$3,831 |
0.1 |
$289 |
-0.2% |
1.6x |
NM |
|
restaurant chains such as IHOP and |
|
|
|
|
|
|
|
|
|
|
|
|
|
|
|
Applebee's. |
|
|
|
|
|
|
|
|
|
|
|
|
|
|
Frisch's Restaurants |
Operates Golden Corral and Big Boy |
149 |
81.2% |
$120 |
$290 |
-0.4% |
5.5% |
$9 |
3.2% |
$180 |
1.6 |
$101 |
9.2% |
1.1x |
12.9x |
|
full service restaurants. |
|
|
|
|
|
|
|
|
|
|
|
|
|
|
Jack in the Box |
Operates and franchises Jack in the |
2,527 |
60.4% |
$770 |
$2,876 |
5.6% |
9.1% |
$126 |
4.4% |
$1,383 |
2.1 |
$711 |
17.8% |
1.9x |
6.1x |
|
Box quick service restaurants and |
|
|
|
|
|
|
|
|
|
|
|
|
|
|
|
Qdoba fast-casual restaurants. |
|
|
|
|
|
|
|
|
|
|
|
|
|
|
McDonald's |
Franchises and operates |
31,377 |
22.0% |
$68,648 |
$22,787 |
9.1% |
9.0% |
$2,395 |
10.5% |
$29,392 |
0.8 |
$15,458 |
15.5% |
4.5x |
28.7x |
|
McDonald’s restaurants in the quick |
|
|
|
|
|
|
|
|
|
|
|
|
|
|
|
service industry |
|
|
|
|
|
|
|
|
|
|
|
|
|
|
Red Robin Gourmet |
Owns and franchises casual dining |
384 |
64.8% |
$537 |
$763 |
23.4% |
23.9% |
$31 |
4.0% |
$549 |
1.4 |
$244 |
12.6% |
1.9x |
17.5x |
Burgers |
restaurants that serve gourmet |
|
|
|
|
|
|
|
|
|
|
|
|
|
|
|
burgers. |
|
|
|
|
|
|
|
|
|
|
|
|
|
|
Ruby Tuesday |
Operates and franchises casual |
933 |
72.9% |
$519 |
$1,410 |
8.0% |
11.5% |
$92 |
6.5% |
$1,230 |
1.1 |
$527 |
17.4% |
1.2x |
5.7x |
|
dining restaurants under the Ruby |
|
|
|
|
|
|
|
|
|
|
|
|
|
|
|
Tuesday brand name. |
|
|
|
|
|
|
|
|
|
|
|
|
|
|
Steak n Shake |
Owns and franchises full service, |
491 |
88.6% |
$309 |
$654 |
2.4% |
7.0% |
$12 |
1.8% |
$565 |
1.2 |
$287 |
4.1% |
1.1x |
26.1x |
|
casual dining restaurants. |
|
|
|
|
|
|
|
|
|
|
|
|
|
|
Texas Roadhouse |
Operates a full-service, casual dining |
285 |
71.6% |
$828 |
$735 |
23.1% |
26.6% |
$39 |
5.3% |
$546 |
1.3 |
$319 |
12.3% |
2.3x |
21.1x |
|
restaurant chain. |
|
|
|
|
|
|
|
|
|
|
|
|
|
|
Wendy's |
Operates as a franchisor of the |
6,645 |
21.3% |
$812 |
$1,264 |
0.5% |
2.1% |
$16 |
1.3% |
$1,789 |
0.7 |
$1,012 |
1.6% |
1.8x |
50.5x |
|
Wendy’s restaurant system. |
|
|
|
|
|
|
|
|
|
|
|
|
|
|
Yum! Brands |
Operates and franchises KFC, Pizza |
35,345 |
21.6% |
$19,097 |
$10,416 |
8.9% |
5.6% |
$909 |
8.7% |
$7,242 |
1.4 |
$1,452 |
62.6% |
16.8x |
21.0x |
|
Hut, Taco Bell, Long John Silver's, |
|
|
|
|
|
|
|
|
|
|
|
|
|
|
|
and A&W brands. |
|
|
|
|
|
|
|
|
|
|
|
|
|
|
Peer Average |
6,628 |
50.2% |
$6,650 |
$3,430 |
9.8% |
9.4% |
$272 |
4.4% |
$3,539 |
1.4 |
$1,489 |
13.5% |
3.5x |
20.5x |
Peer Median |
1,801 |
60.4% |
$693 |
$1,264 |
8.0% |
7.8% |
$35 |
4.0% |
$1,230 |
1.4 |
$319 |
12.3% |
2.0x |
21.0x |
Source: Compiled by casewriters from Company Annual Reports.