

Garrett R.H., Grisham C.M. - Biochemistry (1999)(2nd ed.)(en)
.pdf


18.1 ● Virtually All Organisms Have the Same Basic Set of Metabolic Pathways |
567 |

568 Chapter 18 ● Metabolism—An Overview
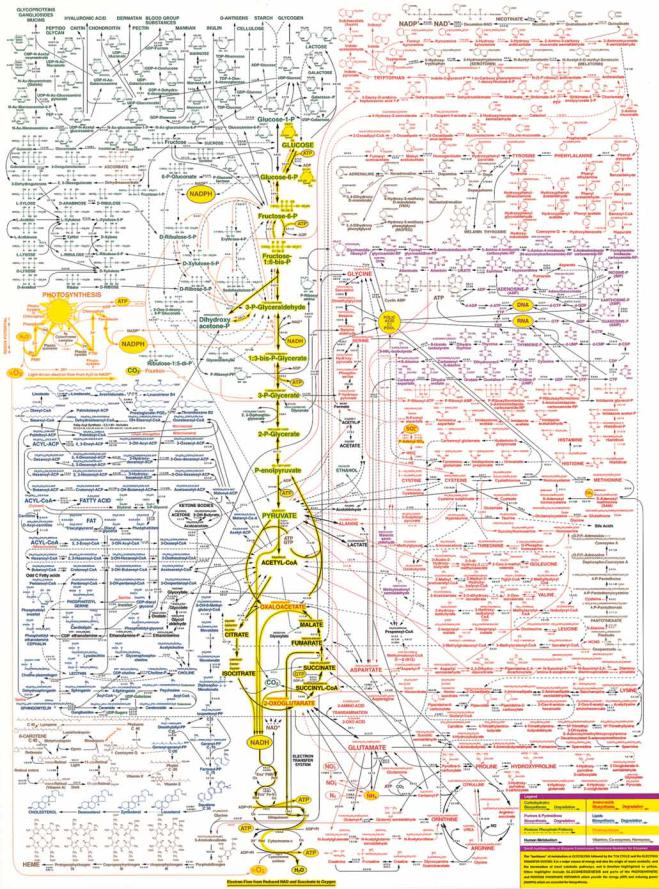
● The metabolic map as a set of dots and lines. The heavy dots and lines trace the central energy-releasing pathways known as glycolysis and the citric acid cycle.
(Adapted from Alberts, B., et al., 1989. Molecular Biology of the Cell, 2nd ed. New York: Garland Publishing Co.)


570 Chapter 18 ● Metabolism—An Overview
of metabolic possibilities. For instance, organisms are often classified according to the major metabolic pathways they exploit to obtain carbon or energy. Classification based on carbon requirements defines two major groups, autotrophs and heterotrophs. Autotrophs are organisms that can use just carbon dioxide as their sole source of carbon. Heterotrophs require an organic form of carbon, such as glucose, in order to synthesize other essential carbon compounds.
Classification based on energy sources also gives two groups: phototrophs and chemotrophs. Phototrophs are photosynthetic organisms, which use light as a source of energy. Chemotrophs use organic compounds such as glucose or, in some instances, oxidizable inorganic substances such as Fe2 , NO2 , NH4 , or elemental sulfur as sole sources of energy. Typically, the energy is extracted through oxidation–reduction reactions. Based on these characteristics, every organism falls into one of four categories (Table 18.2).
Metabolic Diversity Among the Five Kingdoms
Prokaryotes (the kingdom Monera—bacteria) show a greater metabolic diversity than all the four eukaryotic kingdoms (Protoctista [previously called Protozoa], Fungi, Plants, and Animals) put together. Prokaryotes are variously chemoheterotrophic, photoautotrophic, photoheterotrophic, or chemoautotrophic. No protoctista are chemoautotrophs; fungi and animals are exclusively chemoheterotrophs; plants are characteristically photoautotrophs, although some are heterotrophic in their mode of carbon acquisition.
The Role of O2 in Metabolism
A further metabolic distinction among organisms is whether or not they can use oxygen as an electron acceptor in energy-producing pathways. Those that can are called aerobes or aerobic organisms; others, termed anaerobes, can subsist without O2. Organisms for which O2 is obligatory for life are called obligate aerobes; humans are an example. Some species, the so-called facultative anaerobes, can adapt to anaerobic conditions by substituting other electron acceptors for O2 in their energy-producing pathways; Escherichia coli is an exam-
Table 18.2
Metabolic Classification of Organisms According to Their Carbon and Energy Requirements
Classification |
Carbon Source |
Energy Source |
Electron Donors |
Examples |
|
|
|
|
|
Photoautotrophs |
CO2 |
Light |
H2O, H2S, S, other |
Green plants, algae, |
|
|
|
inorganic compounds |
cyanobacteria, |
|
|
|
|
photosynthetic |
|
|
|
|
bacteria |
Photoheterotrophs |
Organic compounds |
Light |
Organic compounds |
Nonsulfur purple bacteria |
Chemoautotrophs |
CO2 |
Oxidation–reduction |
Inorganic compounds: |
Nitrifying bacteria; |
|
|
reactions |
H2, H2S, NH4 , NO2 , |
hydrogen, sulfur, |
|
|
|
Fe2 , Mn2 |
and iron bacteria |
Chemoheterotrophs |
Organic compounds |
Oxidation–reduction |
Organic compounds, |
All animals, most |
|
|
reactions |
e.g., glucose |
microorganisms, |
|
|
|
|
nonphotosynthetic |
|
|
|
|
plant tissue such as |
|
|
|
|
roots, photosynthetic |
|
|
|
|
cells in the dark |
|
|
|
|
|