

Enzymes (Second Edition)
.pdf250 EXPERIMENTAL MEASURES OF ENZYME ACTIVITY
Figure 7.26 Arrhenius plot of log(Vmax) of an enzymatic reaction as a function of 1/(2.3RT). The slope of the line in such a plot gives an estimate of the negative value of Ea , the activation energy of the reaction.
enzyme concentration as well as for k . When an accurate estimate of the enzyme concentration in a stock solution is lacking, one can hold the amount of that stock solution used in the assays constant and determine the activation energy of the reaction by using the measured values of V in place of k in Equation 7.18. Figure 7.26 is such an Arrhenius plot for a hypothetical enzyme with an activation energy of 12.5 kcal/mol, measured over a temperature range of 10—40°C.
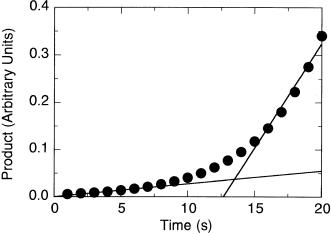
Since the temperature of the reaction mixture can have such a dramatic effect on the kinetic parameters of an enzyme-catalyzed reaction, it is critical to carefully control temperature during measurements of initial velocity. For reactions initiated by addition of substrate, the reaction mixture and substrate solution should be equilibrated to the same temperature before mixing. For a reaction initiated by addition of enzyme, it is sometimes desirable to maximize protein stability by maintaining the enzyme stock solution at 4°C (ice temperature) prior to the assay. In such situations it is best to use a stock of enzyme so concentrated that only a small volume needs to be added to the overall reaction mixture, which should already be equilibrated at the assay temperature. In a typical assay of this type, one might add 10—50 L of enzyme stock (at 4°C) to a 1.0 mL reaction mixture that is equilibrated at 25 or 37°C. This small volume will not significantly perturb the temperature of the overall reaction mixture, and the enzyme will come to the assay temperature during mixing. If too large a volume of enzyme stock is used for these assays, full temperature equilibrium may not be achieved during the mixing time. This will be reflected as a lag phase in the initial velocity measurements, as illustrated in Figure 7.27. Lag phases of this type can significantly compromise the accuracy of end point type assays, where the occurrence of a lag phase might
FACTORS AFFECTING THE VELOCITY OF ENZYMATIC REACTIONS |
251 |
Figure 7.27 Example of a reaction progress showing a long lag phase before reaching the true steady state rate of reaction. Such a lag phase can be caused by several factors, including insufficient temperature equilibrium of the enzyme and reaction mixture solutions. See text for further details.
be missed. Control measurement at several time points should be performed in these cases, to ensure that such effects of insufficient temperature equilibration are not affecting the measurements.
7.4.4 Viscosity Effects
When a diffusional event, such as initial collisional encounter of E and S to form the ES complex or dissociation of product from the EP complex is rate limiting, solution microviscosity can affect the overall rate of reaction. The microviscosity of a solution refers to the resistance to motion that is experienced by a molecule in the solution. This is in contrast to the macroviscosity measured by conventional viscometers, which is a bulk property of the solution. Because increases in microviscosity increase the resistance to molecular motions in solution, the frequency of diffusional events is slowed down. Polymeric viscogenes, such as polyethylene glycol, influence the macroviscosity only, while monomeric viscogenes, such as sucrose and glycerol, affect both the macroand microviscosty. Hence, the simplest way to increase the microviscosity of an enzyme solution is by addition of monomeric viscogenes. The viscosities of solutions of different sucrose or glycerol composition have been tabulated and can be found in references such as T he CRC Handbook of Physics and Chemistry. The actual viscosity of final solutions containing these viscogenes should be determined empirically with a standard laboratory viscometer (such as a Cannon—Fenskie or Ostwald viscometer), available from any commercial laboratory supply company.
252 EXPERIMENTAL MEASURES OF ENZYME ACTIVITY
If an enzymatic reaction is diffusion limited, the value of k /K will depend |
||||||||
on the solution viscosity as follows: |
|
|
|
|
|
|||
|
k |
|
k |
|
|
|
||
|
|
|
|
|
|
|
|
|
K |
K |
|
|
(7.19) |
||||
|
|
|
|
|
|
|
|
|
where is the viscosity and the superscript 0 refers to the values of k |
/K and |
|||||||
in the absence of added viscogene. From Equation 7.19 we see that a plot of |
||||||||
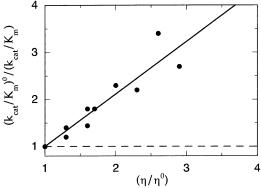
(k /K ) /(k /K ) as a function of ( / ) should yield a straight line with slope and y-intercept values of 1.00 each. Behavior of this type is an indication
that the enzyme under study is completely rate-limited by a diffusional process.
A good control to run for such an experiment is to measure k /K over the
same range of using a polymeric viscogene, such as polyethylene glycol. Since only the macroviscosity is affected, no change in k /K should be observed.
Figure 7.28 illustrates an example of this approach for the study of the enzyme triosephosphate isomerase (Blacklow et al., 1988). This enzyme is known to run at near kinetic perfection, with (k /K ) 10 M s . Thus scientists have speculated that the reaction velocity is rate-limited by the diffusion-controlled formation of the ES complex. To test this, Blacklow et al. measured the effects of viscosity changes on the reaction of triosephosphate isomerase brought about by glycerol (affecting both macroand microviscosity) and polyethylene glycol (affecting macroviscosity only). As seen in Figure 7.28, they obtained the expected results: a linear dependence of k /K on microviscosity, but no effect from changing macroviscosity only. As pointed out by the authors, these data do not prove that the rate-limiting step in
Figure 7.28 Effects of microviscosity on kcat /Km for an enzymatic reaction that is rate-limited by a diffusional process. Solid circles represent data points for the enzyme triosephosphate isomerase when the viscosity is adjusted with glycerol, thus affecting both the macroand microviscosity of the solution. Dashed line shows the effects of changing solution viscosity with polyethylene glycol, where only the macroviscosity is affected. [Data redrawn from Blacklow et al. (1988).]
FACTORS AFFECTING THE VELOCITY OF ENZYMATIC REACTIONS |
253 |
catalysis for triosephosphate isomerase is ES complex formation. Rather, the data indicate only that whatever step is rate limiting for this enzyme, it is likely to be a diffusion-controlled step.
7.4.5 Isotope Effects in Enzyme Kinetics
When an enzyme-catalyzed reaction is rate-limited by a group transfer step, a slowing down of the reaction rate will be observed if the group being transferred is isotopically enriched with a heavy isotope. Such kinetic isotope effects can be used to identify the atoms of a substrate molecule that are undergoing transfer during catalysis by an enzyme. To perform such an analysis, the investigator must synthesize a version of the substrate that is isotopically labeled at a specific atom. Since protons are perhaps the most commonly transferred atoms in enzymatic reactions, we shall focus our attention on the use of heavy isotopes of hydrogen in such studies.
Why is it that a heavier isotope leads to a diminution of the reaction rate for proton transfer reactions? To answer this question, let us consider a reaction in which a hydrogen is transfered from a carbon atom to some general base:
C H :B [C H B ]‡ C HB
As we saw in Chapter 2, the electronic state of the reactant can be represented as a potential energy well that has built upon it a manifold of vibrational substates (see Figure 2.9). Among these vibrational substrates will be potential energies associated with the stretching of the C H bond. The transition state of the reaction is reached by elongating this C H bond prior to bond rupture. Thus, in going from the reactant state to the transition state, the potential energy of the C H stretching vibration is converted to transitional energy that contributes to the overall energy of activiation for the reaction.
Now the potential energy minimum (i.e., the very bottom of the well) of the reactant state is characteristic of the electronic configuration of the reactant molecule when all the atoms in the molecule are at their equilibrium distances (i.e., when the vibrations of the bonds are ‘‘frozen out’’). If we were to replace the proton on the carbon with a deuteron, the electronic configuration of the molecule would not be changed, and thus the bottom of the potential well for the reactant state would be unchanged. The vibrational substates involving the C H stretching mode would, however, be affected by the isotopic change. The potential energy of a vibrational mode is directly proportional to the frequency, at which the bond vibrates. In the case of a vibration that stretches a bond between two atoms, as in our C H bond, the vibrational frequency can be expressed in terms of the force constant for that vibration (a measure similar to the tension or resistance to compression of a macroscopic spring) and the masses of the two atoms of the bond by:
k
 (7.20)
m
254 EXPERIMENTAL MEASURES OF ENZYME ACTIVITY
where k is the force constant, and m is the reduced mass of the diatomic system involved in the vibration. The reduced mass is related to the masses of the two atoms in the system (m and m ) as follows:
1 |
|
1 |
|
1 |
|
(7.21) |
|
|
|
|
|||
m |
m |
m |
|
|||
The activation energy associated with the transition between the reactant state and the transition state here is most correctly measured as the energetic distance between the vibrational ground state of the reactant potential well and the transition state. The energy difference between the vibrational ground state and the potential well minimum is referred to as the zero-point energy and is given the symbol e. The value of e is directly proportional to , which in turn is inversely proportional to the masses of the atoms involved in the vibration, according to Equation 7.21.
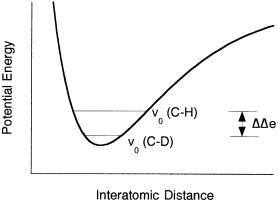
The frequency of a C H bond stretching vibration can be measured by infrared or Raman spectroscopy, and has a typical value of about 2900 cm . If we replace the proton with a deuteron (C D, or C H), this vibrational frequency shifts to roughly 2200 cm . These frequencies correspond to e values of 4.16 and 3.01 kcal/mol for the C H and C D bonds, respectively. Therefore, the zero-point energy for a C D bond will be 1.15 kcal/mol lower than that for a C H bond (Figure 7.29). If all the vibrational potential energy of the reactant ground state is converted to transitional energy in achieving the transition state, this difference in zero-point energy corresponds to a 1.15 kcal/mol increase in overall activation energy for the C D bond over that for the C H bond. As we saw in Chapter 2, an increase in activation energy corresponds to a decrease in reaction rate, and thus the lowering of zero-point
Figure 7.29 Potential energy diagram for an electronic state of a molecule illustrating the difference in zero point enegry, e, for C H and C D bonds.
FACTORS AFFECTING THE VELOCITY OF ENZYMATIC REACTIONS |
255 |
energy for a heavier isotope explains the reduction in reaction rate observed in kinetic experiments.
The effects of deuterium isotope substitution on the rate of reactions is typically expressed as the ratio V /V or k /k . Based on the difference in zero-point energy for a C H bond and a C D bond, we would expect the difference in activation energy for these two group transfers to be 1.15 kcal/mol if all the vibrational potential energy is converted to transitional energy. From Equation 2.7 we would thus expect the kinetic isotope effect here to be:
kcatC H |
G‡ |
|
|
||
|
|
exp |
|
7 |
(7.22) |
kC D |
RT |
||||
|
cat |
|
|
|
|
Note that the isotope effect will be realized in the measured kinetics only if the hydrogen transfer step is rate limiting (or partially rate limiting) in the overall reaction. Also, the magnitude of the isotope effect will vary from enzyme to enzyme, depending on the degree to which the transition state converts the vibrational potential energy of the ground reactant state to transitional energy. In proton transfer reactions one also finds that the magnitude of the kinetic isotope effect is influenced by the pK of the general base group that participates in the transfer step. As a rule, the largest kinetic isotope effects occur when the pK of the general base is well matched to that of the carbon acid of the proton donor; the magnitude of the kinetic isotope effects diminishes as the difference in these pK values increases.
Kinetic isotope effects can be very useful in identifying the specific atoms that participate in rate-limiting group transfer steps during catalysis. A common strategy is to synthesize substrate molecules in which a specific atom is isotopically labeled and then compare the rate of reaction for this substrate with that for the unlabeled molecule. When a group that participates in a rate-limiting transfer step is labeled, a kinetic isotope effect is observed. This information not only can be used to determine what groups are involved in particular transfer reactions, but can also help to identify the rate-determining steps in the catalytic mechanism of an enzyme. Comprehensive treatments of the use of kinetic isotope effects in elucidation of enzyme mechanisms can be found in the reviews by Cleland and coworkers (Cleland et al., 1977) and by Northrop (1975), and in the recent compilation of selected articles from
Methods in Enzymology edited by Purich (1996).
Isotopic substitution of the solvent water hydrogens can affect the kinetics of enzyme reactions if the solvent itself serves as a proton donor during catalysis, or if the proton donor groups on the enzyme or substrate can rapidly exchange with the solvent; these effects are referred to as solvent isotope effects. In simple enzyme systems, the solvent isotope effects can be used to determine the number of protons that are transfered during the rate-determining step of catalysis. This is done by measuring the velocity of the reaction as a function of the atom fraction of deuterium (n), or the percentage of D O in a mixed

256 EXPERIMENTAL MEASURES OF ENZYME ACTIVITY
Figure 7.30 Proton inventory plot for reactions involving transfer of one (open circles) and two (solid circles) protons during the rate-limiting step in catalysis. The y axis is the ratio of kcat in
some mixture of D2O and H2O (kcatn) and the kcat value in 100% H2O (kcat0). Data for the one-proton reaction fit by a linear function; data for the two-proton reaction fit by a quadratic
function. Reactions involving three-proton transfers in the rate-limiting step would be fit by a cubic function. Reactions involving more than three protons usually are fit by an exponential function.
H O/D O solvent system. A plot of V or k as a function of n, or %D O, will show a diminution in these kinetic parameters as the amount of D O in
the solvent system increases. If a single proton transfer event is responsible for the solvent isotope effect, the data in such a plot will be well fit by a linear function. If two protons are transferred, the data will be best fit by a quadratic equation. For three protons, a cubic equation will be required to fit the data, and so on (Figure 7.30).
Generally, the involvement of more than three protons yields a plot that is best fit by an exponential function, which would suggest an ‘‘infinite number’’ of proton transfers during the rate-limiting step. This proton inventory method does not provide any insight into the structures or locations of the proton transfering groups, but does allow one to quantify the number of groups participating in the rate-limiting step.
Some caution must be exercised in interpreting these data. The interpretations based on curve fitting assume that a single step, the rate-limiting step, is responsible for the entire observed solvent isotope effect. In most simple enzyme systems this generally holds true. In more complex, multi—transition state systems, however, the assumption may not be valid. The validity of the data also depends on having all other solution conditions held constant as the percentage of D O in the solvent system is varied. One must remember, for example, that there is a difference between the true pD value of a D O solution and the value measured with a conventional pH meter (for a pure D O solution, the true pD pH meter reading 0.41 at 25°C); these effects must be accounted for in the preparation of solutions for the measurement of proton
7.5 REPORTING ENZYME ACTIVITY DATA |
257 |
inventories. The reader interested in applying these techniques would be well advised to refer to more comprehensive treatments of the subject (Schowen and Schowen, 1982; Venkatasubban and Schowen, 1984).
7.5 REPORTING ENZYME ACTIVITY DATA
As we have seen in the preceding section, many solution conditions can affect the overall activity of an enzyme catalyzed reaction. Thus, for investigators in different laboratories to reproduce one another’s results it is critical that the data be reported in meaningful units, and be accompanied by sufficient information on the details of the assay used. In reporting activity measurements, one should always specify the buffer system used in the reaction mixture, the pH and temperature at which the assay was recorded, the time interval over which initial velocity measurements were made, and the detection method used. Initial velocities and V values should always be reported in units of molarity (of substrate or product) change per unit time, while K and k values should be reported in molarity units and reciprocal time (min , or s ), respectively. Turnover numbers are typically reported in terms of molarity change per unit time per molarity of enzyme, moles of substrate lost or product produced per unit time per mole of enzyme, or, equivalently, molecules of substrate lost or product produced per unit time per molecule of enzyme.
Many times it will be necessary to measure the enzymatic activity of samples that contain proteins other than the enzyme of interest. During the initial purification of an enzyme, for example, it is often helpful to follow the activity of the enzyme at various stages of the purification process, where multiple contaminating proteins will be present in the sample also. To standardize the reporting of activities in such cases, the International Union of Biochemistry has adapted the international unit (IU) as the standard measure of enzyme activity: one international unit is the amount of enzyme (or crude enzyme sample) required to catalyze the transformation of one micromole of substrate per minute or, where more than one bond of each substrate molecule is attacked, one microequivalent of the group concerned, under a specific set of defined solution conditions. The definition allows the individual researcher to specify the solution conditions, but the IUB recommended that units be reported for measurements made at 25°C. The specific solution conditions have no intrinsic significance, but they must to be reported to ensure reproducibility.
In crude enzyme samples the total mass of protein can be determined by a number of analytical methods (see Copeland, 1994 for details), but it is often difficult to measure specifically the mass or concentration of the enzyme of interest in such samples. To quantify the amount of enzyme present, researchers often report the specific activity of the sample: that is, the number of international units of enzymatic activity per milligram of total protein under a specific set of solution conditions. Most typically, specific activity values are
258 EXPERIMENTAL MEASURES OF ENZYME ACTIVITY
reported under conditions of saturating substrate (i.e., where v V ) and optimal solution conditions (i.e., pH, temperature, etc.). As the purification of an enzyme proceeds, and more and more of the total protein mass of the sample is made up by the enzyme of interest, the specific activity of the sample will continuously increase.
7.6 ENZYME STABILITY
One of the most common practical problems facing the experimental biochemist is the loss of enzymatic activity in a sample due to enzyme instability. Enzymes, like most proteins, are prone to denaturation under many laboratory conditions, and specific steps must be taken to stabilize these macromolecules as much as possible. Recommendations for the general handling of proteins for maximum stability have been described in detail in several texts devoted to proteins (see, e.g., Copeland, 1994). The general recommendations for the storage and handling of enzymes that follow can help to maintain the catalytic activities of these proteins.
7.6.1 Stabilizing Enzymes During Storage
Like all proteins, enzymes in their native states are optimally stabilized by specific solution conditions of pH, ionic strength, anion/cation composition, and so on. No generalities can be stated with respect to these conditions, and the best conditions for each enzyme individually must be determined empirically. Note, however, that the solution conditions that are optimal for protein stability may not necessarily the same as those for optimal enzymatic activity. When this caveat applies, enzyme stocks should be stored under the conditions that maximally promote stability, while the enzyme assays should be conducted under the conditions of optimal activity.
For long-term storage, enzymes should be kept at cryogenic temperatures in a 70°C freezer or under liquid nitrogen. Conventional freezers operate at a nominal temperature of 20°C, but most of these cycle through higher temperatures to keep them ‘‘frost free.’’ This can lead to unintentional freeze— thaw cycling of the enzyme sample, which can be extremely denaturing. If enzymes are stored in such a freezer, protein stability can be greatly enhanced by adding an equal volume of glycerol to the sample and mixing it well. This 50% glycerol solution will maintain the enzyme sample in the liquid phase at20°C, and thus will prevent repeated freezing and thawing. In fact, many enzymes display optimal stability when stored at 20°C as 50% glycerol solutions.
Before the samples are frozen, they should be sterile-filtered through a 0.22 m filter composed of a low protein-binding material, and then placed in sterilized cryogenic tubes to avoid bacterial contamination. To avoid protein denaturation during the freeze—thaw process, it is critical that the samples be
ENZYME STABILITY |
259 |
frozen quickly and thawed quickly. Rapid freezing is best accomplished by immersing the sample container in a slurry of dry ice and ethanol. Rapid thawing is best done by placing the sample in a 37°C water bath until most, but not all, of the sample is in the liquid state. When there is just a small bit of frozen material remaining, the sample should be removed from the bath and allowed to continue thawing on ice (i.e., 4°C).
Repeated freeze—thaw cycles are extremely denaturing to proteins and must be avoided. Thus, a frozen enzyme sample should be thawed once and used promptly. Sample remaining at the end of the experiment should not be refrozen. An enzyme that can be maintained in stable conditions for several days at 4°C, however, may be used in an experiment run soon after the first. If a particular enzyme is not stable under these conditions, any sample remaining at the end of an experiment must be discarded. To avoid wasting enzyme sample material, samples should be stored in small volume, high concentration aliquots. This way the volume of sample that is needed for each day’s experiments can be thawed, while the bulk of the sample aliquots remain frozen. Once thawed, the enzyme should be kept at ice temperature (4°C) for as long as possible before equilibration to the assay temperature. Again, if the enzyme is stored at high concentration, only a small volume of the enzyme stock will be needed for dilution into the final reaction mixture.
For example, a typical enzyme assay might require a final concentration of enzyme in the reaction mixture of 10 nM. Suppose that an enzyme is in long-term storage at 70°C as a 100 M stock in 50 L aliquots. On the day that assays are to be performed with the enzyme, a single aliquot might be thawed and diluted 1:100 with an appropriate buffer to make a 5 mL working stock of 1.0 M enzyme. This stock would be stored on ice for the day (or potentially longer). The final reaction mixture would be prepared as a 1:100 dilution of this working stock to yield the desired final enzyme concentration of
10nM.
Certain additives will enhance the stability of many enzymes for long-term
storage at cryogenic temperatures and sometimes also for short-term storage in solution. Glycerol, sucrose, and cyclodextrans are often added to stabilize enzyme samples; the exact concentrations of these excipients that best stabilize a particular enzyme must be determined empirically. Some enzymes are greatly stabilized by the presence of cofactors, substrates, and even inhibitors that bind to their active sites. Again, the best storage conditions must be established for each enzyme individually.
Another common problem in handling enzyme solutions is the loss of enzymatic activity due to protein adsorption onto the surfaces of containers and pipet tips. Proteins bind avidly to glass, quartz, and polystyrene surfaces. Hence, containers made of these materials should not be used for enzyme samples. Containers and transfer devices constructed of low protein binding materials, such as polypropylene or polyethylene, should be used whenever possible; a wide variety of containers and pipet tips made of these materials are available commercially.