

Enzymes (Second Edition)
.pdf210 EXPERIMENTAL MEASURES OF ENZYME ACTIVITY
multichannel pipet. The solutions are mixed by repeatedly pulling up and dispensing the reaction mixture with the pipettor. An entire row of 12 wells can be mixed in this way in less than 10 seconds.
7.2.5 Errors in Absorption Spectroscopy
A common error associated with absorption measurements is deviation from Beer’s law. The form of Beer’s law suggests that the absorption of a sample will increase linearly with the concentration of the molecule being analyzed, and indeed, this is the basis for the use of absorption spectroscopy as an analytical tool. Experimentally, however, one finds that this linear relationship holds only over a finite range of absorption values. As illustrated in Figure 7.10, absorption readings greater than 1.0 in general should not be trusted to accurately reflect the concentration of analyte in solution. Thus, experiments should be designed so that the maximum absorption to be measured is less than 1.0. With a few preliminary trials, it usually is possible to adjust conditions so that the measurements fall safely below this limit. Additionally, the amount of instrumental noise in a measurement is affected by the overall absorption of the sample. For this reason it is more difficult to measure a small absorption change for a sample of high absorption. Empirically it turns out that the best compromise between minimizing this noise and having a reasonable signal to
Figure 7.10 Deviation from Beer’s law. Over a small concentration range, the absorption at some analytical wavelength tracks linearly with analyte concentration, as expected from Beer’s law (Equation 7.11). When the analyte concentration increases to the point at which A 1.0, however, significant deviations from this straight-line behavior begin to appear.
DETECTION METHODS |
211 |
follow occurs when the sample absorption is in the vicinity of 0.5. This is usually a good target absorption for following small absorption changes.
The lamps used to generate the UV and visible light for absorption spectrometers must be given ample time to warm up. The light intensity from these sources varies considerably shortly after the lamps are turned on, but stabilizes after about 30—90 minutes. Since the amount of warm-up time needed to stabilize the lamp output will vary from instrument to instrument, and from lamp to lamp within the same instrument, it is best to determine the required warm-up time for one’s own instrument. This is easily done by measuring the signal from a sample of low absorption (say, 0.05—0.1) as a function of time after turning the lamp on, and noting how long it takes for the signal to reach a stable, constant reading.
Another source of error in absorption measurements is sample turbidity. Particulate matter in a solution will scatter light that is detected as increased absorption by the sample. If settling of such particles occurs during kinetic measurements, significant noise in the data may result, and in severe cases there will appear to be an additional kinetic component of the data. The best way to avoid these complications is to ensure that the sample is free of particles by filtering all the solutions through 0.2 m filters or by centrifugation (see Copeland, 1994, for further details.)
7.2.6 Fluorescence Measurements
Light of an appropriate wavelength can be absorbed by a molecule to cause an electronic transition from the ground state to some higher lying excited state, as we have discussed. Because of its highly energetic nature, the excited state is short-lived (excited state lifetimes are typically less than 50 ns), and the molecule must find a means of releasing this excess energy to return to the ground state electronic configuration. Most of the time this excess energy is released through the dissipation of heat to the surrounding medium. Some molecules, however, can return to the ground state by emitting the excess energy in the form of light. Fluorescence, the most common and easily detected of these emissive processes, involves singlet excited and ground electronic states. The energetic processes depicted in Figure 7.8 are characteristic of molecular fluorescence. First, light of an appropriate wavelength is absorbed by the molecule, exciting it to a higher lying electronic state (Figure 7.8A). The molecule then decays through the various high energy vibrational substates of the excited electronic state by heat dissipation, finally, relaxing from its lowest vibrational level to the ground electronic state with release of a photon (Figure 7.8B).
Because of the differences in equilibrium interatomic distances between the ground and excited states, and because of the loss of energy during the decay through the higher energy vibrational substates, the emitted photon is far less energetic than the corresponding light energy required to excite the molecule in the first place. For these reasons, the fluorescence maximum of a molecule
212 EXPERIMENTAL MEASURES OF ENZYME ACTIVITY
is always at a longer wavelength (less energy) than the absorption maximum; this difference in wavelength between the absorption and fluorescence maxima of a molecule is referred to as the Stokes shift. For example, the amino acid tryptophan absorbs light maximally at about 280 nm and fluoresces strongly between 325 and 350 nm (Copeland, 1994). To take advantage of this behavior, fluorescence instruments are designed to excite a sample in a cuvette with light at the wavelength of maximal absorption and detect the emitted light at a different (longer) wavelength. To best detect the emitted light with minimal interference from the excitation light beam, most commercial fluorometers are designed to collect the emitted light at an angle of 90° from the excitation beam path. Thus, unlike cells for absorption spectroscopy, fluorescence cuvettes must have at least two optical quality widows at right angles to one another; all four sides of most fluorescence cuvettes have polished optical surfaces.
The strategies for following enzyme kinetics by fluorescence are similar to those just described for absorption spectroscopy. Many enzyme substrate— product pairs are naturally fluorescent and provide convenient signals with which to follow their loss or production in solution. If these molecules are not naturally fluorescent, it is often possible to covalently attach a fluorescent group without significantly perturbing the interactions with the enzyme under study. Fluorescence measurements offer two key advantages over absorption measurements for following enzyme kinetics. First, fluorescence instruments are very sensitive, permitting the detection of much lower concentration changes in substrate or product. Second, since many fluorophores have large Stokes shifts, the fluorescence signal is typically in an isolated region of the spectrum, where interferences from signals due to other reaction mixture components are minimal.
Fluorescence signals track linearly with the concentration of fluorophore in solution over a finite concentration range. In principle, fluorescence signals should vary with fluorophore concentration by a relationship similar to Beer’s law, where the extinction coefficient is replaced by the molar quantum yield ( ). In practice, however, it is difficult to calculate sample concentrations by means of applying tabulated values of to experimental fluorescence measurement. This limitation is in part due to the nature of the instrumentation and the measurements (see Lackowicz, 1983, for more detail). Thus, to convert fluorescence intensity measurements into concentration units, it is necessary to prepare a standard curve of fluorescence signal as a function of fluorophore concentration, using a set of standard solutions for which the fluorophore concentration has been determined independently. The standard curve data points must be collected at the same time as the experimental measurements, however, since day-to-day variations in lamp intensity and other instrumental factors can greatly affect fluorescence measurements.
Sometimes the fluorophore is generated only as a result of the enzymatic reaction, and it is difficult to obtain a standard sample of this molecule for construction of a standard curve. In such cases it may not be possible to report velocity in true concentration units, and units of relative fluorescence per unit
DETECTION METHODS |
213 |
time must be used instead. It is still important to quantify this fluorescence relative to some standard fluorescent molecule, to permit comparisons of relative fluorescence measurements from one day to the next and from one laboratory to another. A good standard for this purpose is quinine sulfate. A dilute solution of quinine sulfate in an aqueous sulfuric acid solution can be excited at any wavelength between 240 and 400 nm to yield a strong fluorescence signal that maximizes at 453 nm (Fletcher, 1969). Russo (1969) suggests the following protocol for preparing a quinine sulfate solution as a standard for fluorescence spectroscopy:
·Weigh out 5 mg of quinine sulfate dihydrate and dissolve in 100 mL of 0.1 N H SO .
·Measure the absorption of the sample at 366 nm, and adjust the concen-
tration with 0.1 N H SO so that the solution has an absorption of 0.40 at this wavelength in a 1 cm cuvette.
·Dilute a sample of this solution 1/10 with 0.1 N H SO and use the solution to record the fluorescence spectrum.
The relative fluorescence of a sample can then be reported as the fluorescence intensity of the sample at some wavelength, divided by the fluorescence intensity of the quinine sulfate standard at 453 nm, when the same fluorometer is used to excite both sample and standard, at the same wavelength. Of course, both sample and standard measurements must be made under the same set of experimental conditions (monochrometer slit width, lamp voltage, dwell time, etc.), and the second set should be made soon after the first.
7.2.7 Internal Fluorescence Quenching and Energy Transfer
If a molecule absorbs light at the same wavelength at which another molecule fluoresces, the fluorescence from the second molecule can be absorbed by the first molecule, leading to a diminution or quenching of the observed fluorescence intensity from the second molecule. (Note that this is only one of numerous means of quenching fluorescence; see Lackowicz, 1983, for a more comprehensive treatment of fluorecence quenching.) The first molecule may then decay back to its ground state by radiationless decay (e.g., heat dissipation), or it may itself fluoresce at some characteristic wavelength. We refer to the first process as quenching because the net effect is a loss of fluorescence intensity. The second situation is described as ‘‘resonance energy transfer’’ because here excitation at the absorption maximum of one molecule leads to fluorescence by the other molecule (Figure 7.11).
Both these processes depend on several factors, including the spatial proximity of the two molecules. This property has been exploited to develop fluorescence assays for proteolytic enzymes based on synthetic peptide substrates. The basic strategy is to incorporate a fluorescent group (the donor)
214 EXPERIMENTAL MEASURES OF ENZYME ACTIVITY
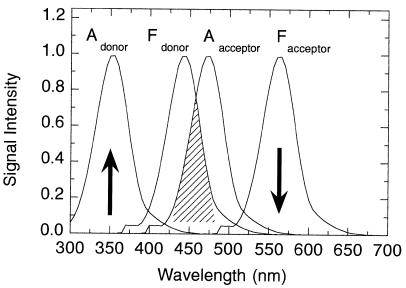
Figure 7.11 Resonance energy transfer. In an energy transfer experiment, the sample is
excited with light at the wavelength of the donor absorption band (Adonor) to induce fluorescence of the donor molecule at the wavelength indicated by Fdonor. The absorption band of the acceptor molecule (Aacceptor) occurs in a wavelength range where it overlaps with the fluorescence band of the donor; the area of overlap between these two features is shown by the hatched region.
Because of this spectral overlap (and other factors), the light that would have been emitted as
Fdonor is reabsorbed by Aacceptor. This indirect excitation of the acceptor molecule can lead to
fluorescence by the acceptor at the wavelengths corresponding to Facceptor. Experimentally, one excites at the wavelength indicated by the up-pointing arrow, and the fluorescence signal is
measured at the wavelength indicated by the down-pointing arrow.
into a synthetic peptide on either the N- or C-terminal side of the scissile peptide bond that is recognized by the target enzyme. A fluorescence quencher or energy acceptor molecule (both referred to hereafter as the acceptor molecule) is also incorporated into the peptide on the other side of the scissile bond. When the peptide is intact, the donor and acceptor molecules are covalently associated and remain apart at a relatively fixed distance, able to energetically interact. Once hydrolyzed by the enzyme, however, the two halves of the peptide will diffuse away from each other, thus eliminating the possibility of any interaction between the donor and acceptor. The observed effect of this hydrolysis will be an increase in the fluorescence from the donor molecule, and, in the case of energy transfer, a concomitant decrease in the fluorescence of the acceptor molecule with exication under the absorption maximum of the donor.
These approaches have been used to follow hydrolysis of peptide substrates for a large variety of proteases (e.g., see Matayoshi et al., 1990; Knight et al., 1992; Knight, 1995; and Packard et al., 1997). Table 7.3 summarizes some donor—acceptor pairs that are commonly used in synthetic peptide substrates

|
|
DETECTION METHODS |
215 |
|||
Table 7.3 Donor‒acceptor pairsa for quenching by resonance |
|
|||||
energy transfer in peptide substrates of proteolytic enzymes |
|
|||||
|
|
|
|
|
|
|
|
|
Wavelengths (nm) |
|
|||
|
|
|
|
|
|
|
Quencher |
Fluorophore |
Excitation |
Emission |
|
||
|
|
|
|
|
|
|
Dabcyl |
Edans |
336 |
490 |
|
|
|
Dansyl |
Trp |
336 |
350 |
|
|
|
DNP |
Trp |
328 |
350 |
|
|
|
DNP |
MCA |
328 |
393 |
|
|
|
DNP |
Abz |
328 |
420 |
|
|
|
Tyr(NO ) |
Abz |
320 |
420 |
|
|
|
Dabcyl, 4-(4-dimethylaminophenylazo)benzoic acid; Edans, 5-[(2-amino- ethyl)amino]naphthalene-1-sulfonic acid; Dansyl, (5-dimethylaminonaphtha- lene-1-sulfonyl); DNP, 2,4-dinitrophenyl; MCA, 7-methoxycoumarin-4 acetic acid; Abz, o-aminobenzyl; Tyr(NO ), 3-nitrotyrosine.
for proteases. Another good source for information on donor—acceptor pairs is the Internet site of the Molecular Probes Company,* a company specializing in fluorescence tools for biochemical and biological research.
One example will suffice to illustrate the basic approach used in these assays. Knight et al. (1992) described the incorportation of the fluorescent molecule 7-methoxycoumarine-4-yl acetyl (MCA) at the N-terminus of a peptide designed to be a substrate for the matrix metalloprotease stromelysin; then, immediately after the scissile Gly-Leu peptide bond that is hydrolyzed by the enzyme, the quencher N-3-(2,4-dinitrophenyl)- -2,3-diaminopropionyl (DPA) was incorporated as well. The complete peptide sequence is:
MCA-Pro-Leu-Gly-L eu-DPA-Ala-Arg-NH
MCA absorbs maximally at 328 nm and fluoresces maximally at 393 nm. The DPA group has a strong absorption band at 363 nm with a prominent shoulder at 410 nm. This shoulder overlaps with the fluorescence band of MCA and leads to significant fluorescence quenching; a 1 M solution of MCA-Pro- Leu (the product of enzymatic hydrolysis) was found to be 130 times more fluorescent that a comparable solution of the MCA-Pro-Leu-Gly-Leu-DPA- Ala-Arg-NH with excitation and emission at 328 and 393 nm, respectively (Knight et al., 1992). Enzymatic hydrolysis of this peptide results in separation of the MCA and DPA groups, hence a large increase in MCA fluorescence. This fluorescence increase could be followed over time as a measure of the reaction velocity, allowing the investigators to establish the values of k /K of this substrate for several members of the matrix metalloprotease family. This
*www.probes.com/handbook
216 EXPERIMENTAL MEASURES OF ENZYME ACTIVITY
assay was used recently to determine the potency of potential inhibitors of stromelysin by measuring the effects of the inhibitors on the initial velocity of the enzyme reaction (Copeland et al., 1995).
Recently, fluorescence resonance energy transfer (FRET) has been applied to the study of enzymatic group transfer reactions, and to the study of protein—protein interactions in solution. Space does not permit a review of these applications. The interested reader is referred to the online handbook from the Molecular Probes Company (cited in an earlier footnote) for more information and literature examples of biochemical applications of FRET technology.
7.2.8 Errors in Fluorescence Measurements
Most of the caveats described for absorption spectroscopy hold for fluorescence measurements as well. Samples must be free of particulate matter, since light scattering is a severe problem in fluorescence. Many of the commonly used fluorophores emit light in the visible region but must be excited at wavelengths in the near ultraviolet, necessitating the use of quartz cuvettes for these measurements. Also, any fluorescence due to buffer components and so on must be measured and corrected for to ensure that meaningful data are obtained.
In addition to these more common considerations are several sources of error unique to fluorescence measurements. First, many fluorescent molecules are prone to photodecomposition after long exposure to light. Hence, fluorescent substrates and reagents should be stored in amber glass or plastic, and the containers should be wrapped in aluminum foil to minimize exposure to environmental light. Second, the quantum yield of fluorescence for any molecule is highly dependent on sample temperature. We shall see shortly that temperature affects enzyme kinetics directly, but this is distinct from the general influence of temperature on fluorescence intensity. In general the fluorescence signal increases with decreasing temperature, as competing nonradiative decay mechanisms for return to the ground state become less efficient. Hence, good temperature control of the sample must be maintained. Most commercial fluorometers provide temperature control by means of jacketed sample holders that attach to circulating water baths.
Finally, a major source of error in fluorescence measurements is light absorption by the sample at high concentrations. Individual molecules in a sample may be excited by the excitation light beam and caused to fluoresce. To be detected, these emitted photons must traverse the rest of the sample and escape the cuvette to impinge on the surface of the detection device (typically a photomultiplier tube or diode array). Any such photon will be lost from detection, however, if before escaping the sample it encounters another molecule that is capable of absorbing light at that wavelength. As the sample concentration increases, the likelihood of such encounters and instances of light reabsorption increases exponentially. This phenomenon, referred to as the inner
DETECTION METHODS |
217 |
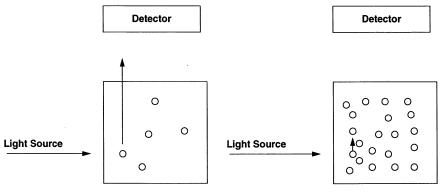
Figure 7.12 Schematic diagram illustrating the inner filter effect. When a dilute sample (left) of a fluorescent molecule is excited at an appropriate wavelength, a detector stationed at 90° relative to the excitation source will detect the emitted light that emerges from the sample container. If, however, the sample is very concentrated, emitted light from one molecule in a sample may encounter and be reabsorbed by another molecule before emerging from the sample compartment (right). These reabsorbed photons, of course, will not be detected. The likelihood of this self-absorption, or inner filter effect, increases with increasing sample concentration.
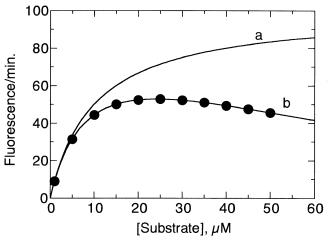
filter effect (Figure 7.12), can dramatically reduce the fluorescence signal observed from a sample. Consider Figure 7.13, which plots the apparent fluorescent product yield after a fixed amount of reaction time as a function of substrate concentration for the fluorogenic MCA/DPA peptide described in Section 7.2.7 in an assay for stromelysin activity. Instead of the rectangular hyperbolic fit expected from the Henri—Michaelis—Menten equation (Chapter 5), we observe an initial increase in fluorescence yield with increasing substrate, followed by a rapid diminution of signal as the substrate concentration is further increased. At first glance, this behavior might appear to be the result of substrate or product inhibition, as described in Chapter 5. In this case, however, the loss of fluorescence at higher substrate concentrations is an artifact of the inner filter effect. This can be verified by remeasuring the fluorescence of the higher substrate samples after a large dilution with buffer. If, for example, the sample were diluted 20-fold with buffer, the observed fluorescence would not be 20-fold less than that of the undiluted sample; rather, it would show much higher fluorescence than expected on the basis of the dilution factor.
The inner filter effect can be corrected for if the absorption of the sample is known at the excitation and emission wavelengths used in the fluorescence measurement. The true, or corrected fluorescence F can be calculated from the observed fluorescence F as follows (Lackowicz, 1983):
F F 10 |
(7.13) |
218 EXPERIMENTAL MEASURES OF ENZYME ACTIVITY
Figure 7.13 Errors in enzyme kinetic measurements due to fluorescence inner filter effects: the rate of fluorescence from a fluorescent peptide substrate of stromelysin is plotted as a function of substrate concentration. Instead of the rectangular hyperbolic behavior expected from the Henri—Michaelis—Menten equation (curve a), we see a diminution of the expected signal at high substrate concentrations (curve b). One might interpret this result as indicating substrate inhibition. In this case, however, the deviation is due to the inner filter effects that become significant at high substrate concentrations. The correct interpretation can be reached by measuring the fluorescence of the higher substrate sample at several dilutions, as discussed in the text.
where A and A are the sample absorptions at the excitation and emission wavelengths, respectively. This correction works only over a limited sample absorption range. If the sample absorption is greater than about 0.1, the correction will not be adequate. Hence, a good rule of thumb is to begin with samples that have absorption values of about 0.05 at the excitation wavelength. The sample concentration can be adjusted from this starting point to optimize the signal-to-noise ratio, with care taken to not introduce a significant inner filter effect.
7.2.9 Radioisotopic Measurements
The basic strategy for the use of radioisotopes in enzyme kinetic measurements is to incorporate into the structure of the substrate a radioactive species that will be retained in the product molecule after catalysis. Using an appropriate technique for separating the substrate from the product (see Section 7.3 on separation methods), one can then measure the amount of radioactivity in the substrate and product fractions, and thus quantify substrate loss and product production. Most of the isotopes that are used commonly in enzyme kinetic measurements decay through emission of particles (Table 7.4). The decay

DETECTION METHODS |
219 |
Table 7.4 Properties of radioisotopes that are commonly used in enzyme kinetic assays
Isotope |
Decay Process |
Half-life |
Carbon-14
Phosphorus-32
Sulfur-35
Tritium
C N
P S
S ClH He
5700 years
14.3 days
87.1 days
12.3 years
process follows first-order kinetics, and the loss (or disintegration) of the starting material is thus associated with a characteristic half-life for the parent isotope. The standard unit of radioactivity is the curie (Ci), which originally defined the rate at which 1 gram of radium-226 decays completely. Relating this to other isotopes, a more useful working definition of the curie is that quantity of any substance that decays at a rate of 2.22 10 disintegrations per minute (dpm).
Solutions of p-terphenyl or stilbene, in xylene or toluene, will emit light when in contact with a radioactive solute. This light emission, known as scintillation, is most commonly measured with a scintillation counter, an instrument designed around a photomultiplier tube or other light detector. Radioactivity on flat surfaces, such as thin-layer chromatography (TLC) plates and gels can be measured by scintillation counting after the portion of the surface containing the sample has been scraped or cut out and immersed in scintillation fluid.
Another common means of detecting radioactivity on such surfaces entails placing the surface in contact with a sheet of photographic film. The radioactivity darkens the film, making a permanent record of the location of the radioactive species on the surface. This technique, called autoradiography, is one of the oldest methods known for detecting radioactivity. Today computerinterfaced phosphor imaging devices also are commonly used for locating and quantifying radioactivity on two-dimensional surfaces (dried gels, TLC plates, etc.).
Radioactivity in a sample is quantified by measuring the dpm’s of a sample using one of the methods just described. Since, however, no detector is 100% efficient, any instrumental reading obtained experimentally will differ from the true dpm of the sample. The experimental units of radioactivity are referred to as counts per minute (cmp’s: events detected or counted by the instrument per minute). For example, a 1 Ci sample would display 2.22 10 dpm. If the detector used to measure this sample had an efficiency of 50%, the experimental value obtained would be 1.11 10 cpm. To convert this experimental reading into true dpm’s, it would be necessary to measure a standard sample of the isotope of interest, of known dpm’s. This information would permit the calibration of the efficiency of the instrument and the ready conversion of the cpm values of samples into dpm units.