

Friesner R.A. (ed.) - Advances in chemical physics, computational methods for protein folding (2002)(en)
.pdfprotein recognition by sequence-to-structure fitness |
115 |
ability such as selfand family recognition. We note that our training did not include the Z score, so successful predictions based on only the Z score are useful tests even if performed on the training set of structures. The second test is a prediction experiment on proteins not included in the learning set. There are 40 new proteins that are included in Table XIa.
TABLE XI
A Summary of the THOM2 Threading Alignments of All the Sequences of the HL
Set Into All the Structures of the HL Seta
(a)
1bbt1, 1gp1A, 1grcA, 1ipd, 1lap, 1lpe, 1phd, 1prcL, 1prcM, 1rbp, 1rhd, 1rnh, 1stp, 1wsyB, 2cna, 2cts, 2gbp, 2snv, 2wrpR, 3sicE, 4dfrA, 4gcr, 4rcrH, 4rcrL, 4rcrM, 7acn, 8adh, 4cms, 4i1b, 5fd1, 1atnA, 1tfd, 2aaiA, 2aaiB, 2bbkA, 2bbkB, 2lig, 2mnr, 2plv1, 2sas
(b)
Energy |
Z Score |
N |
|
|
|
First |
First |
234 |
First |
Second |
4 |
First |
Fourth |
1 |
Second |
Second |
3 |
Weak |
Weak |
4 |
|
|
|
|
(c) |
|
|
|
|
|
Z Score |
N |
|
|
|
|
First |
177 |
|
Second or Third |
35 |
|
Fourth and lower |
14 |
|
Weak |
11 |
|
Very Weak |
9 |
aA list of proteins of the HL set that were not included in the training (TE) set is given in part a. A summary of the native global alignments is included in part b. Part c contains a summary for the native local alignments. The number of native alignments N, with ranks specified in terms of energies (first column in part b) and Z scores (second column in part b and the first column in part c), is given in the last column. For global alignments, ‘‘weak’’ is used to mark alignments with a weak energy or Z-score signals. There are four weak alignments corresponding to the photosynthetic centers membrane domains that were not included in the training set. Only five out of the remaining 242 native alignments obtain Z scores smaller than 3.0 (four alignments with Z scores larger than 2.5 and one alignment with a Z score smaller than 2.5). For local alignments, ‘‘very weak’’ denotes native alignments with Z scores smaller than 1.0, whereas ‘‘weak’’ marks alignments having Z scores larger than 1.0 and smaller than 2.0. There are 226 local native alignments with Z scores larger than 2.0. Note also that energy is not used to filter local alignments (beyond the initial restriction to 200 best candidates).

116 |
jaroslaw meller and ron elber |
The self-recognition of the HL set proteins in terms of optimal alignments and Z-score filters is summarized in Tables XIb and XIc (see also Fig. 8). In Table XIb we provide the data for the global alignment. Energy and Z-score filters are considered. Of the total of 246 proteins, 234 are clear-cut cases (the energy and the Z scores of the native alignment are at the top). The four failures are membrane proteins (photosynthetic reaction centers) that were not included in the training set. In Table XIc the data for the local alignments are provided. We use only the Z score as a filter because there are many incorrect alignments with good (negative) energies. Among nine native alignments that are clear failures (Z < 1:0), six refer to structures that were included in the training set.
As examples of protein families, represented in the HL set, we discuss cytochromes, dehydrogenases, and acid proteases. Cytochromes were included in the training of the gaps, so we might expect that identification of cytochromes will be easy. Yet, this is not the case and we report a ‘‘bad’’ case scenario for some of the members of the family in Table XIIa. The Z-score values are below what we usually consider as a significant hit. Even though the correct proteins make it to the top, the global Z scores are too low (1.3–1.4) to confirm the prediction. The successful recognition of dehydrogenases and acid proteases families is shown in Tables XIIb and XIIc. We comment that most of the family members of the HL set are recognized irrespective of the choice of the probe sequence, as long as it belongs to a given family. More extensive tests of family recognition are discussed in Section VII.C.
Global Z scores reported in Tables XI and XII are converged using 1000 shuffled sequences. Local Z scores are, however, computed using only 50 shuffled sequences. The constraint here is of computational resources. Global Z scores are computed only for 10 energy-best structures and can be done
TABLE XII
Examples of Predictions for Families of Homologous Proteinsa
(a)
Query srequence: 5cytR |
Structure |
Energy |
Z score |
RMS |
|
|
|
|
|
Global alignments |
5cytR |
22.1 |
4.1 |
0.0 |
|
1ccr |
10.4 |
1.4 |
6.9 |
|
3c2c |
10.4 |
1.4 |
4.9 |
|
1rro |
11.2 |
1.3 |
— |
|
256bA |
12.0 |
1.0 |
— |
Local alignments |
5cytR |
31.0 |
3.9 |
0.0 |
|
1ccr |
35.6 |
3.2 |
1.9 |
|
1yea |
23.9 |
3.2 |
1.9 |
|
2ccyA |
22.8 |
3.0 |
— |
|
2fox |
27.6 |
2.3 |
— |

protein recognition by sequence-to-structure fitness |
117 |
|||
|
TABLE XII |
(Continued) |
|
|
|
(b) |
|
|
|
|
|
|
|
|
Query Sequence: 1llc |
Structure |
Energy |
Z Score |
RMS |
|
|
|
|
|
Global alignments |
1llc |
80.0 |
7.0 |
0.0 |
|
1lldA |
60.7 |
4.4 |
5.3 |
|
1ldnA |
52.9 |
4.2 |
4.6 |
|
4mdhA |
47.4 |
2.1 |
6.7 |
|
6ldh |
45.8 |
1.6 |
4.6 |
Local alignments |
1ldnA |
73.4 |
5.2 |
4.1 |
|
1llc |
89.8 |
5.2 |
0.0 |
|
1lldA |
74.1 |
4.4 |
5.0 |
|
6ldh |
73.4 |
4.3 |
4.4 |
|
1ipd |
82.7 |
2.8 |
— |
|
(c) |
|
|
|
|
|
|
|
|
Query Sequence: 1pplE |
Structure |
Energy |
Z Score |
RMS |
|
|
|
|
|
Global alignments |
1pplE |
77.3 |
9.5 |
0.0 |
|
2er7E |
61.4 |
7.3 |
2.9 |
|
3aprE |
51.9 |
4.3 |
3.9 |
|
4cms |
45.0 |
4.2 |
5.4 |
|
4pep |
43.1 |
3.6 |
5.7 |
Local alignments |
1pplE |
79.2 |
12.9 |
0.0 |
|
2er7E |
68.6 |
8.3 |
2.9 |
|
3aprE |
59.6 |
4.5 |
5.2 |
|
4pep |
55.4 |
3.3 |
5.7 |
|
1prcH |
46.6 |
2.2 |
— |
aThe results of global and local threading alignments for representatives of three families in the HL set are reported. The families are cytochromes (part a), lactate and malate dehydrogenases (part b), and pepsin-like acid proteases (part c). Five best alignments, ordered according to their Z scores (fourth column), are reported. The names of the query sequences are specified in the first column, target structures in the second, and the energy of the alignment in the fourth column, respectively. In the last column the RMS distance between the (known) structure of the probe (query) and the target structure, according to a novel structure-to-structure alignment (Meller and Elber [45]), is provided.
˚
RMS distances larger than 12 A are indicated by a dash. Note that in a ‘‘bad’’ case scenario a
˚
distance of about 5 A between the superimposed side-chain centers of 5cytR and 3c2c is sufficient to make threading identification virtually impossible because the Z score is too low (see part a). The local alignment provides a significantly improved Z score in this case. On the other hand, there are homologous structures that are not detected by the local alignments, although their global Z scores are high. Examples are malate dehydrogenase 4mdh (see part b) and acid protease 4cms (see part c). The structures with the PDB codes 1rro and 2fox (part a), 1ipd (part b) and 1prcH (part c) do not belong to the families of interest.

118 |
jaroslaw meller and ron elber |
accurately. Local Z scores are computed for 200 alignments. The number of alignments with negative energies, which needs to be probed by an additional filter, is much larger for local alignments. With limited computational resources and/or a large-scale alignment project, it may be necessary to use Z scores that are not fully converged. For example, when aligning a 1pplE sequence into a 1prcH structure, a Z score of 1.8 with 1000 shuffled sequences is obtained, as opposed to 2.2 with only 100 shuffles sequences.
Finally, we remark that we were able to find alignments (with gaps) that have energies lower that the energy of the native state. Moreover, even aligning a sequence into its own structure may result in lower energy than the native if the addition of gaps and deletions is favorable. One such example is the alignment (with gaps) of 1llc onto its native shape.
B.Recognition of Folds Not Included in the Training
In order to assess the generalization capacity of THOM2 in terms of optimal alignments, we use the S47 set again. Let us recall that the S47 set is composed of CASP3 [46] targets and their relatives. Using CASP3-related structures is a convenient way of finding protein shapes that are not sampled in the training. The experiment we perform is for self-recognition and is not aimed at finding remote relatives (as in CASP). The results are summarized in Table XIII. The native and
TABLE XIII
Self-Recognition for Folds That Were Not Learneda
|
FSSP |
THOM2 |
THOM2 |
|
PDB Code (len) |
Z-score (RMS) |
Global Z score |
Local Z score |
|
|
|
|
|
|
1HKA (158) |
33.0 |
(0.0) |
7.1 |
7.1 |
1VHI (139) |
4.3 |
(5.2) |
0.2 |
0.3 |
2A2U (158) |
33.8 |
(0.0) |
2.5 |
4.0 |
1BBP (173) |
11.6 |
(3.3) |
3.5 |
3.0 |
2EZM (101) |
55.3 |
(0.0) |
3.7 |
3.2 |
1QGO (257) |
46.0 |
(0.0) |
5.6 |
7.6 |
1ABE (305) |
6.4 |
(3.4) |
0.5 |
0.4 |
1BYF (123) |
29.5 |
(0.0) |
1.8 |
2.8 |
1YTT (115) |
16.4 |
(2.2) |
0.1 |
1.4 |
1JWE (114) |
26.9 |
(0.0) |
2.6 |
2.3 |
1B79 (102) |
18.7 |
(1.3) |
0.3 |
1.3 |
1B7G (340) |
61.5 |
(0.0) |
8.7 |
8.8 |
1A7K (358) |
25.1 |
(2.9) |
0.4 |
0.9 |
1EUG (225) |
43.0 |
(0.0) |
3.4 |
3.0 |
1UDH (244) |
30.8 |
(1.7) |
1.0 |
2.9 |
1D3B (72) |
18.4 |
(0.0) |
3.5 |
2.8 |
1B34 (118) |
13.4 |
(1.1) |
1.9 |
2.0 |
1DPT (114) |
24.8 |
(0.0) |
6.2 |
6.0 |
1CA7 (114) |
18.7 |
(1.2) |
4.0 |
2.5 |
1BG8 (76) |
19.1 |
(0.0) |
3.4 |
3.5 |

protein recognition by sequence-to-structure fitness |
119 |
||||
|
TABLE XIII |
(Continued) |
|
|
|
|
|
|
|
||
|
FSSP |
THOM2 |
THOM2 |
||
PDB Code (len) |
Z-score (RMS) |
Global Z score |
Local Z score |
||
|
|
|
|
|
|
1DJ8 (79) |
16.2 |
(0.7) |
5.1 |
3.9 |
|
1QFJ (226) |
42.7 |
(0.0) |
8.1 |
8.4 |
|
1VID (214) |
7.1 |
(3.1) |
2.0 |
0.5 |
|
1BKB (132) |
25.1 |
(0.0) |
2.7 |
1.5 |
|
1EIF (130) |
17.4 |
(1.6) |
3.5 |
2.0 |
|
1B0N (103) |
19.5 |
(0.0) |
4.7 |
5.0 |
|
1LMB (87) |
8.0 |
(5.3) |
0.3 |
0.1 |
|
1BD9 (180) |
38.8 |
(0.0) |
4.5 |
5.8 |
|
1BEH (180) |
36.0 |
(0.3) |
7.4 |
5.8 |
|
1BHE (376) |
70.2 |
(0.0) |
6.7 |
0.6 |
|
1RMG (422) |
36.9 |
(2.2) |
0.9 |
— |
|
1B9K (237) |
39.7 |
(0.0) |
8.1 |
8.2 |
|
1QTS (247) |
36.1 |
(0.7) |
3.5 |
6.4 |
|
1EH2 (95) |
24.3 |
(0.0) |
6.0 |
6.5 |
|
1QJT (99) |
7.6 |
(2.5) |
3.6 |
3.7 |
|
1BQV (110) |
20.9 |
(0.0) |
3.5 |
2.3 |
|
1B4F (82) |
3.2 |
(3.3) |
0.0 |
1.7 |
|
1CK2 (104) |
26.0 |
(0.0) |
5.2 |
4.3 |
|
1CN8 (104) |
14.3 |
(2.2) |
5.3 |
2.0 |
|
1BL0 (116) |
24.9 |
(0.0) |
0.5 |
0.5 |
|
1JHG (101) |
3.4 |
(6.6) |
1.1 |
1.0 |
|
1BNK (100) |
24.9 |
(0.0) |
5.4 |
6.3 |
|
1B93 (148) |
31.4 |
(0.0) |
4.0 |
3.2 |
|
1MJH (143) |
6.1 |
(3.4) |
0.3 |
1.3 |
|
1BK7 (190) |
37.2 |
(0.0) |
7.7 |
9.0 |
|
1BOL (222) |
19.7 |
(2.3) |
0.1 |
1.0 |
|
1BVB (211) |
37.3 |
(0.0) |
5.3 |
4.3 |
|
aTwenty-two pairs of CASP3 targets and their structural relatives, as well as an additional three singleton targets, are added to the TE set. Their PDB codes are given in the first column (with lengths in parentheses). The actual CASP3 targets are given as the first structure of each pair (e.g., 1HKA from the pair 1HKA, 1VHI). If the domain is not specified and one refers to a multidomain protein, then the A (or first) domain is used. The results of global and local THOM2 threading of the 25 CASP3 sequences into an extended TE set (594 þ 47 structures) are reported in the third and fourth column, respectively. Two of 25 native alignments gave weak signals (DNA-binding protein 1BLO and glycosidase 1BHE). Four other native alignments (2A2U, 1BYF, 1JWE, and 1BKB) provide global Z scores somewhat smaller than 3. The DALI Z scores and RMS deviations for structure-to-structure alignments into native and homologous structures are reported in the second column (the native structures have RMS distances of zero). Note that low Z scores indicate that only short fragments of the respective structures are aligned and the resulting RMS deviation may not be representative. Nine related structures, among the 14 pairs with the DALI Z score larger than 10, obtain Z scores larger than 3.0 and 2.0 for the global and local THOM2 threading alignments, respectively. The alignment of 2A2U sequence into the 1BBP structure was the only significant hit of any of the target sequences into the structures included in the training (TE) set. Thus, no false positives with scores above our confidence cutoffs were observed. All the predictions that can be made with a high degree of confidence are indicated by Z scores printed using boldface type.
120 |
jaroslaw meller and ron elber |
homologous shapes were embedded in the structures of the TE set, and the sequences of CASP targets were aligned into all the structures of such extended set. We provide in the table the results of the native alignments and the alignments into related homologous structure, irrespective of their rank.
One encouraging observation is that the native structures are found with high probability. Twenty of 25 structures would have been found if the native structure was included in the set. A less encouraging observation is the sensitivity of the results to structural fluctuations. The THOM2 model can identify related structures only if their distance is not too large. Nine out of 14 homologous structures with the DALI [44] Z score for structure-to-structure alignment larger than 10 are detected with high confidence. Only one homologous structure with the DALI Z score lower than 10 is detected.
Only three among the 25 structures of the CASP3 targets included in Table XIII had homologous counterparts in the training set. These are 2a2u, 1byf, and 1eug with their respective homologous proteins 1bbp, 2msb, and 1akz. It is therefore reassuring that most of the native structure and a significant fraction of relatives are recognized in terms of both their energies and the Z scores. Also, there are no further significant hits into other structures from the TE set. Hence, no false positives above our confidence thresholds are observed in this test. We conclude that our nearly perfect learning (on a training set) preserves significant capacity for identification of new folds using optimal alignments with gaps.
Note also that good scores with the global alignment are obtained for length differences (between sequence and structure) that are on the order of 10%. This was made possible by using environment-dependent gaps. When the differences in length are profound (e.g., 1bqv versus 1b4f), it is obvious and expected that the global alignment will fail. Large differences are clearly focused on identification of domains and not a whole protein. This is a different problem, which the present chapter does not address.
C.Recognition of Protein Families: THOM2 Versus Pair Energies
Three families are considered here: globins (92 proteins), immunoglobins (Fv fragments, 137 proteins), and the DNA-binding, POU-like domains (26 proteins). Sequences of all family members are aligned optimally to all the structures in the family. Both the local and global alignments are generated for each sequence–structure pair, and the results are compared in terms of the sum of Z scores for global and local alignments. Thus we employ here a simplified version of the double Z-score filter discussed before. The THOM2 results are compared to the results of the TE pairwise potential, which was trained on the same set of 594 proteins using the LP protocol. The difference in the LP protocol was that an objective function was optimized.
The alignments due to the pairwise potential are computed using the first iteration of the frozen environment approximation (FEA) [22]. That is, when
protein recognition by sequence-to-structure fitness |
121 |
evaluating fitness of a query sequence into a structure, we assume that types of contacts are fixed according to the native identities of sites making contacts to a primary site occupied by a query residue. Such an approach is in fact a different profile approximation to the ‘‘true’’ pair energies. In THOM2, the number of neighbors to a secondary site approximates its identity, whereas in FEA it is approximated by the identity of the native residue at that site. In principle, the FEA should be iterated until self-consistency is achieved [22]. Purely structural characterization of contact types in THOM2 avoids this problem.
In order to compute optimal alignments with the FEA, we need to set the gap penalties for the TE potential. After some experimentation the insertion penalties are chosen to be proportional to the number of neighbors to a site, e ðnÞ ¼ 0:2 ðn þ 1Þ. This choice is consistent with the THOM2 gap energies, which also penalize sites of no neighbors. The proportionality coefficient was gauged using the same families that were used to train THOM2 gap energies. However, no LP training was attempted. The deletion penalties are also consistent with the THOM2 model, and they are defined in the way described in Section V.
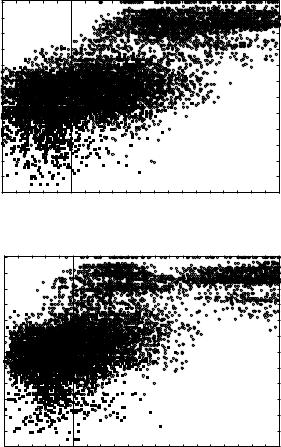
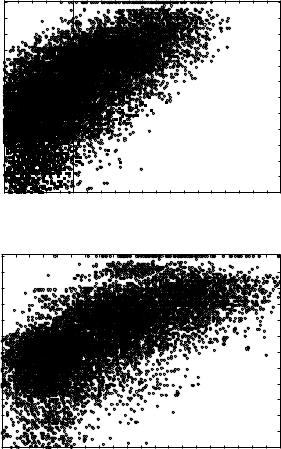
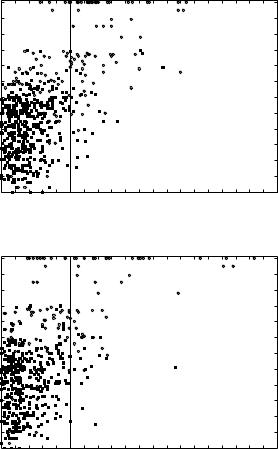
Figures 9a to 9f show the joint histograms of the sum of Z scores for local and global threading alignments versus the RMS deviations between superimposed (according to our novel structure-to-structure alignments; see Section III.A) side-chain centers. Figures 9a, 9c, and 9e show the results for THOM2 (for globins, immunoglobins, and POU-like domains, respectively), whereas Figs. 9b, 9d, and 9f show the corresponding results for TE potential with FEA. The vertical lines in the figures correspond to the sum of global and local Z scores equal to 5, which roughly discriminates the high confidence matches (with higher Z scores) and lower confidence matches that might be obscured by the false positives.
The population of matches that are difficult to identify by pairwise sequence- to-sequence alignments is represented by the filled squares. Sequence alignments are generated using Smith–Waterman algorithm with the BLOSUM50 substitution matrix (with the signs inverted) and structurally biased gap penalties [e ðnÞ ¼ 8 þ ðn 5Þ, where n is the number of neighbors to a site]. Confidence of matches is estimated using Z scores defined, analogously to threading alignments, by the distribution of scores for shuffled sequences. We find that structurally biased gap penalties improve the recognition in case of weak sequence similarity. We do not observe false positives with more than 50% of the query sequence aligned and with a Z score larger than 8 (the distribution of Z scores for sequence substitution matrices is vastly different from that of threading potentials, with very high Z score for homologous sequences). All the matches represented by circles can be identified with high confidence by pairwise sequence-to-sequence alignments.
|
0 |
|
|
1 |
|
|
2 |
|
(angstroms) |
3 |
|
4 |
|
|
|
|
|
|
5 |
|
|
6 |
|
RMS |
7 |
|
8 |
|
|
|
|
|
|
9 |
|
|
10 |
Globins, THOM2 |
|
11 |
|
|
|
RMS (angstroms)
0
1
2
3
4
5
6
7
8
9
10
11
0 1 2 3 4 5 6 7 8 9 10 11 12 13 1415 16 17 18 19
Threading Z score (global + local)
(a)
Globins, TE
0 1 2 3 4 5 6 7 8 9 10 11 12 13 14 1516 17 18 19 Threading Z score (global + local)
(b)
Figure 9. Comparison of family recognition by THOM2 and pair energies. The results of THOM2 for families of globins, immunoglobins (Fv fragments), and POU-like domains are compared to the results of Tobi–Elber (TE) pairwise potential. TE potential was optimized using LP protocol (with different target function) and the same training set. The first iteration of the so-called frozen environment approximation is performed to obtain approximate alignments for the TE potential. Parts a–f show the joint histograms of the sum of Z scores for local and global threading alignments versus the RMS deviations between superimposed (according to structure-to-structure alignments; see text for details) side-chain centers. Parts a, c, and e show the results for THOM2 (for globins, immunoglobins, and POU-like domains, respectively), whereas parts b, d, and f show the corresponding results for TE potential and the frozen environment approximation. The population of matches that are difficult to identify by pairwise sequence-to-sequence alignments is represented by the filled squares (see text for details). Note that the number of low THOM2 Z scores (for example, smaller than 5) is, on the average, smaller for families of globins and POU-like proteins. This is further highlighted in parts g and h, which show one-dimensional histograms of the sum of Z scores for local and global threading alignments for globins and POU-like domains. On the other hand, the TE potential and FEA perform better for immunoglobins family, which is also easier for sequence alignment methods (see text for details).
protein recognition by sequence-to-structure fitness |
123 |
RMS (angstroms)
RMS (angstroms)
0 |
|
|
|
|
|
|
|
|
|
1 |
|
|
|
|
|
|
|
|
|
2 |
|
|
|
|
|
|
|
|
|
3 |
|
|
|
|
|
|
|
|
|
4 |
|
|
|
|
|
|
|
|
|
5 |
|
|
|
|
|
|
|
|
|
6 |
|
|
|
|
|
|
|
|
|
7 |
|
|
|
|
|
|
|
|
|
8 |
|
|
|
|
|
|
|
|
|
9 |
|
|
|
|
|
|
|
|
|
10 |
|
|
|
|
|
|
|
|
|
11 |
|
|
|
|
|
|
|
|
Immunoglobins, THOM2 |
0 |
1 |
2 |
3 |
4 |
5 |
6 |
7 |
8 |
9 10 11 12 13 14 15 16 17 18 19 |
|
|
|
|
Threading Z score (global + local) |
|||||
|
|
|
|
|
|
|
|
|
(c) |
0 |
|
|
|
|
|
|
|
|
|
1 |
|
|
|
|
|
|
|
|
|
2 |
|
|
|
|
|
|
|
|
|
3 |
|
|
|
|
|
|
|
|
|
4 |
|
|
|
|
|
|
|
|
|
5 |
|
|
|
|
|
|
|
|
|
6 |
|
|
|
|
|
|
|
|
|
7 |
|
|
|
|
|
|
|
|
|
8 |
|
|
|
|
|
|
|
|
|
9 |
|
|
|
|
|
|
|
|
|
10 |
|
|
|
|
|
|
|
|
|
11 |
|
|
|
|
|
|
|
|
Immunoglobins, TE |
0 1 2 3 4 5 6 7 8 9 10 11 12 13 14 15 16 17 18 19 Threading Z score (global + local)
(d)
Figure 9 (Continued)
˚
Nearly all pairs differing by less than 3 A RMSD can be identified by THOM2 threading alignments. Most of the matches in the range between 3 and
˚
5 A can be still identified with high confidence. However, the number of confident matches (to the right with respect to vertical lines representing our cutoff of 5 in terms of sum of local and global Z scores) quickly decreases with
˚
the growing RMS distance. Essentially all the pairs with RMSD smaller than 3 A can be also identified by pairwise sequence alignments. Below this threshold,
124 |
jaroslaw meller and ron elber |
RMS (angstroms)
0
1
2
3
4
5
6
7
8
9
10
11
POU, THOM2
0 1 2 3 4 5 6 7 8 9 10 11 12 13 14 15 16 17 18 19
Threading Z score (global + local)
(e)
RMS (angstroms)
0 |
|
|
1 |
|
|
2 |
|
|
3 |
|
|
4 |
|
|
5 |
|
|
6 |
|
|
7 |
|
|
8 |
|
|
9 |
|
|
10 |
POU, TE |
|
11 |
||
|
0 1 2 3 4 5 6 7 8 9 10 11 12 13 14 15 16 17 18 19 Threading Z score (global + local)
(f )
Figure 9 (Continued)
however, we observe many matches that can be still identified by threading but not by sequence alignment (filled rectangles corresponding to threading Z score higher than 5).
On the other hand, there are many matches due to the sequence alignment that are not detected by threading. Because we do not incorporate family profiles in our threading protocol, we do not include here a systematic comparison with the results of PsiBLAST [59]. However, we found examples