

Chen The electron capture detector
.pdfREDUCTION OF ECD DATA TO FUNDAMENTAL PROPERTIES |
87 |
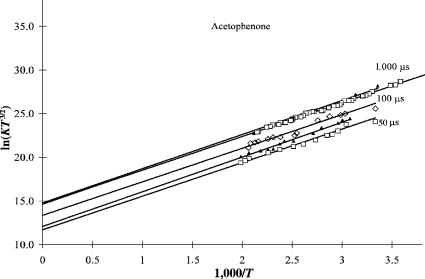
Figure 5.5 Plots of ECD data as ln KT3=2 versus 1;000=T for acetophenone taken at different times: 1,000, 1,000, 200, 100, and 50 ms. The lines were calculated by linear least squares through the data. The two intercepts at 1,000 ms are different because of the different amounts of data. The parameters are given in Table 5.4.
The majority of the earlier ECD data were collected at 1,000 ms and established that the average value of the intercept of 14.7(1) corresponds to a ratio of AN =AD ¼ 20. The intercepts for acetophenone and benzaldehyde were approximately this value, which is Qan ¼ 1:0. At the lower reaction times this intercept is clearly lower, as indicated in Figures 5.5 and 5.6. Such implies that the ratio of AN =AD ¼ 8 at 100 ms and approaches 1 at 50 ms. The intercept can be used to obtain a value of AN =AD by determining the intercept from the temperature dependence of the ECD response for acetophenone [11, 18].
5.3.3Benzanthracene, Benz[a]pyrene, and 1-Naphthaldehyde
If there are sufficient data in either the a or b region, or both, then linear lines can be drawn to determine the slopes and intercepts as well as the parameters A1, E1, Q,
TABLE 5.4 Least-square Parameters for Acetophenone as a Function of Reaction Time
Time (ms) |
Points |
I |
Ea (eV) |
Sab |
IðEa fixedÞ |
SabðEa fixedÞ |
50 |
12 |
12.36(32) |
0.310(7) |
40 |
11.71(11) |
3.8 |
75 |
12 |
12.05(40) |
0.346(10) |
66 |
12.35(10) |
3.5 |
100 |
14 |
12.11(50) |
0.366(13) |
107 |
12.88(20) |
14 |
1,000 |
4 |
13.30(55) |
0.379(12) |
108 |
14.85(30) |
21 |
1,000 |
36 |
14.66(12) |
0.337(3) |
5.7 |
14.69(5) |
0.67 |
88 EXPERIMENTAL PROCEDURES AND DATA REDUCTION
Figure 5.6 Plots of ECD data as ln KT3=2 versus 1;000=T for acetophenone taken at different times: 1,000, 1,000, 100, 75, and 50 ms. The lines were calculated by fixing Ea to the weighted average value. The two intercepts at 1,000 ms are now the same. The value of the intercept at 50ms is that calculated from fundamental constants, 11.73, indicating that the recombination rates of the ions and electrons are equal.
and Ea. Figure 5.7 is a plot of the data for benzanthracene, benz[a]pyrene, and 1-naphthaldehyde at 1,000 ms and 100 ms. For the hydrocarbons there is one point that could be in the b region, as indicated by the equality of the last two data points. The slope through the higher-temperature points for benzanthracene gives an Ea of 0:71 0:04 eV, while the slope through all four points gives an
Ea |
of 0:61 0:06 eV and an intercept higher than the average value. By fitting |
||
the |
data to all points using the four-parameter equation, |
the |
quantities are |
Qan ¼ 0:25 0:10; Ea ¼ 0:71 0:04 eV; E1 ¼ 0:03 0:02 |
eV, |
and ln A1 ¼ |
|
34:0 0:15. For benz[a]pyrene the Ea using a linear plot |
through all points |
||
is 0:58 0:07 eV with an intercept of 18, which is higher than the average value of 14.7. By dropping one data point, the Ea increases to 0:81 0:07 eV and the intercept drops to 13.5, indicating a lower Qan ¼ 0:33ð3Þ. With these values the E1 ¼ 0:01 0:02 eV and ln A1 ¼ 35:2 0:10. Both the higher and lower fixed intercept values were originally reported. We now know that when the slope through the data gives an intercept significantly lower than the average intercept, the higher Ea is the accurate value. The data taken at two reaction times for 1-naphthaldehyde can be reconciled using the larger Ea ¼ 0:72 0:07 eV. By fitting both sets of data, the parameters are Ea ¼ 0:72 0:05 eV and Qan ¼ 0:25ð8Þ. If we use these values, the E1 ¼ 0:06 0:02 eV and ln ðA1Þ ¼ 32:64 0:1. The calculated curves are shown in Figure 5.7. Note that the intercepts for the aromatic

REDUCTION OF ECD DATA TO FUNDAMENTAL PROPERTIES |
89 |
Figure 5.7 Plots of ECD data as ln KT3=2 versus 1;000=T for benz[a]pyrene, benzanthracene, and 1-naphthaldehyde. The latter was taken at 1,000 and 100 ms. The limiting slope is used to determine the Ea. The intercept for benz[a]pyrene gives a Qan less than 1.
hydrocarbons at 1,000 ms fall between the two intercepts for 1-naphthaldehyde separated by two units or a factor of 10 [11, 18].
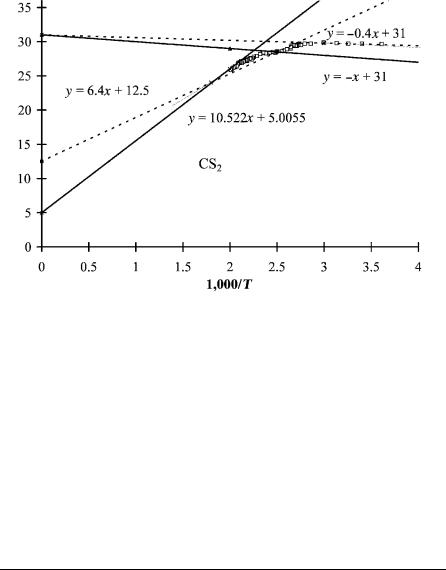
5.3.4Carbon Disulfide
In Figure 4.3 the ECD data for C6F6 and CS2 were shown and the parameters given for the high-temperature region [11, 15]. Unlike the case for the m-dinitrobenzene data shown in Figure 5.4, there are other estimates for the excited state Ea for these two compounds. Although the data clearly indicate two states, we cannot discern the parameters for the excited state. However, by using the estimate of the excited state Ea from other methods, the parameters can be obtained. In Figure 5.8 the ECD data for CS2 are shown with the two resolved states. The initial estimates for the low-temperature data were obtained by fitting the data in the b region for the excited state with two linear plots, as shown in Figure 5.8. Using the same A1 value for the ground state, we were able to approximate the E1 by a linear plot. Finally, a line through the high-temperature data was drawn and the slope and intercept determined. Table 5.5 provides the first approximations determined from the linear plots, the final values obtained from the general eight-parameter least squares, and the values reported earlier for a different set of data. All values agree within the experimental uncertainties. This is a good example of two states
90 EXPERIMENTAL PROCEDURES AND DATA REDUCTION
Figure 5.8 Plots of ECD data as ln KT3=2 versus 1;000=T. Approximate lines in four regions for CS2 give the Ea, E1, A1, and Qan for two states. These are used as first approximations in a nonlinear least-squares analysis. By including measured values of the Ea, more precise values of the other parameters are obtained. The final results are given in Table 5.5.
observed in a single ECD experiment. Other examples are C6F6, anthracene, tetracene, and C6F5Cl [11].
5.3.5Nitromethane
A similar analysis was carried out for two sets of nitromethane data compiled by two different students years apart. Here the two temperature regions involve
TABLE 5.5 ECD Parameters for Carbon Disulfide
Form |
ln A1 |
E1 (eV) |
Ea (eV) |
Qan |
Intercept |
Source |
Linear |
— |
0.04 |
— |
— |
32 |
lines |
Linear |
— |
— |
0.62 |
0.40 |
11.5 |
lines |
Bent |
— |
0.10 |
— |
— |
32 |
lines |
Bent |
— |
— |
0.89 |
1 10 3 |
5.3 |
lines |
Linear |
30.9(3) |
0.10(1) |
0.88(3) |
1:6 10 3 |
5.3(7) |
least squares |
Bent |
32.0(3) |
0.04(1) |
0.62(2) |
0.3 |
10.4(7) |
least squares |
Linear |
31.2(4) |
0.10(1) |
0.87(3) |
1:0 10 3 |
6.1(7) |
published |
Bent |
31.9(2) |
0.03(2) |
0.61(4) |
0.4 |
11.5(7) |
published |
|
|
|
|
|
|
|
|
REDUCTION OF ECD DATA TO FUNDAMENTAL PROPERTIES |
91 |
|||
TABLE 5.6 ECD Parameters for Nitromethane |
|
|
|
||
|
|
|
|
|
|
Parameter |
Data Set 1 |
Data Set 2 |
Fixed E |
Estimated |
|
ln A1 |
36.31 (fixed) |
36.31(fixed) |
35.55(92) |
36 |
|
E1 (eV) |
0.20 (fixed) |
0.20 (fixed) |
0.16(1) |
|
0.2 |
Ea (eV) |
0.49(2) |
0.50(2) |
0.49(1) |
|
0.5 |
Qan |
6 10 3 |
6 10 3 |
6:5 10 3 |
10 2 |
|
ln A2 |
29.33(41) |
28.35(160) |
28.70(24) |
29 |
|
E2 (eV) |
0.99(5) |
0.99(10) |
1.00(2) |
|
1.00 |
D(CN) Ea(NO2) (eV) |
0.30(5) |
0.29(10) |
0.35(1) |
|
0.25 |
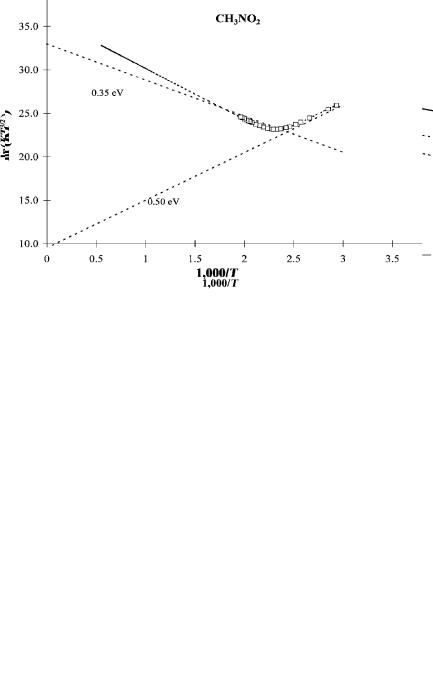
molecular ion formation and dissociative electron attachment via the intermediate molecular negative ion. Assumed values for A1 and E1 were fixed to fit the data to the equation with six parameters. The other four parameters were obtained from the ECD data. The results of this analysis have been published and the activation energy for dissociative electron attachment determined from E2. The electron affinity of the NO2 radical and the bond dissociation energy were both measured so that the EDEA could also be calculated. By using the value of E and its uncertainty, the other five parameters can be estimated and their uncertainties determined. In Table 5.6 the parameters obtained from the two sets of data are compared with a new fit using the experimental value of E ¼ DðC NÞ EaðNO2Þ ¼ 2:65 2:27 ¼ 0:38 0:05 eV. The values are clearly the same within the experimental uncertainties, but now estimates of the Ea are more precise. In Figure 5.9 the data and curves obtained for these data are plotted for one set of nitromethane data. Also shown in Figure 5.9 are linear plots through the different regions, which can be used to estimate parameters. Linear plots give an Ea of 0.5 eV and activation energy of 0.35 eV. The final least-squares values are 0.50(2) eV for the Ea and 0.35(1) eV for the activation energy. The simple graphical method yields reasonable results [19].
5.3.6Consolidation of Electron Affinities for Molecular Oxygen
The superoxide anion was the first homonuclear diatomic anion observed. According to a 1953 review, the AEa of O2 was 0.9 eV and low-energy electron attachment leads to an excited state. Experimental values now range from 0.15 to 1.07 eV: photodetachment, with Ea of 0:15, 1958; CTC, 0.75, 1961 to 1971; electron swarm, 0.45, 1961; EB, 0.6, 1 1, 1961 to 1971; AMB, 0.2, 0.3, 0.5, 0.8, 1 3, 1970 to 1977; IB, 1.07, 1970; PES, 0.43, 0.45, 1971 to 1995, and ECD, 0.45, 0.5, 0.9, 1970 to 2002. This large range of values indicates significant differences beyond random uncertainty [20–33]. The complete temperature dependence for a given state in the ECD is determined by four parameters: the Ea, the partition function ratio Qan for the anion and neutral, A1, and E1. The four parameters for the excited state with an Ea of 0.430, 0:450 0:002 eV have been determined by the swarm and PES methods. In the PES method two spin orbital coupling states
92 EXPERIMENTAL PROCEDURES AND DATA REDUCTION
Figure 5.9 Plots of ECD data as ln KT3=2 versus 1;000=T for nitromethane. The limiting slope at low temperatures is used to determine the Ea. The intercept gives a Qan less than 1. The high-temperature slope gives the quantity D(C N) Ea(NO2). By using the measured value of this quantity in the least-squares analysis, more precise values of the other parameters are obtained. These are given in Table 5.6.
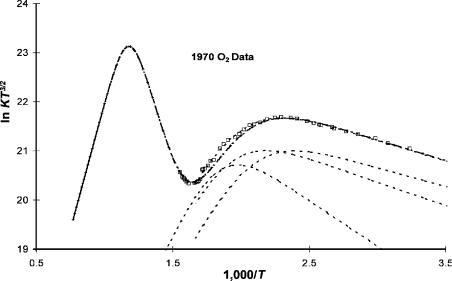
Figure 5.10 Plots of ECD data as ln KT3=2 versus 1;000=T for molecular oxygen. The Ea of two spin orbital coupling states are resolved by fixing the Ea for the two states.
REDUCTION OF NEGATIVE-ION MASS SPECTRAL DATA |
93 |
Figure 5.11 Plots of ECD data as ln KT3=2 versus 1;000=T for molecular oxygen. The Ea of the low-temperature data are used to estimate the Ea of two additional excited states based on higher Ea measured in other experiments.
were resolved [22, 29]. The low-temperature ECD data compiled in our laboratory agree with these values, and the sum of the squares of the deviations is reduced when two spin orbital coupling states are assumed. However, in the ECD data there is an increase in the response at higher temperatures, indicating excited states [22].
Figure 5.10 is a plot of the ECD data with the curves calculated using the experimental parameters measured in other experiments, including the high-resolution PES data that resolve the two spin orbital coupling states. By using these values and their associated uncertainties, it is possible to identify excited states at higher temperatures. The excited-state parameters that have not been measured in other experiments are obtained by sequentially fitting the data with the values that have been measured. Two additional postulated curves are shown in Figure 5.11. The quantities that define these states will be discussed further in Chapter 9.
5.4REDUCTION OF NEGATIVE-ION MASS SPECTRAL DATA
We have utilized two different negative-ion mass spectrometers. The first was an Extranuclear Spectra EL quadrupole mass spectrometer equipped with a custom
94 EXPERIMENTAL PROCEDURES AND DATA REDUCTION
atmospheric pressure ionization source. The data were obtained with a custom data collection system or on an X-Y recorder. The temperature was measured using a thermocouple imbedded in the ion source. The carrier gas was a mixture of argon and methane. Other details of this apparatus can be found in various publications and theses [5–10].
In Figure 5.4 NIMS data for SF6, m-C6H4(NO2)2, and C6H5NO2 are plotted. These data were collected in the 1980s and have not been published [7]. The majority of the data are in the b region for all three compounds. The data for SF6 and C6H5NO2 have small slopes at low temperatures. However, structure exists in the low-temperature data for m-C6H4(NO2)2. In addition, the Ea indicated by the slope in the high-temperature region is lower than the Ea for m-C6H4(NO2)2 measured by TCT. From these data it was suspected that there are two excited states. The E1 and A1 for SF6 and C6H5NO2 were determined from the low-temperature data and the Ea fit with a value of Qan ¼ 1. This essentially fixes the intercept. Each hightemperature data point defines a value of the Ea. The actual reported values were fit to all the data.
The second system used was a Hewlett Packard 5988A GC/MS equipped for chemical ionization negative-ion mass spectra. We carried out our studies in the early 1990s. E. A. Stemmler and R. A. Hites used a similar system to collect mass spectra for over 300 compounds at 373 K and 523 K [10]. In our experiments CO2 was used as the cooling gas, whereas methane was used in the other studies in the literature. The pressures in the ion source were about 1 torr in each case. The electron energies were thermal, as indicated by the absence of dissociation of molecules with large EDEA. In the case of our studies this was also verified by the ratio of SF5(-)/SF6(-) measured as a function of temperature. A small change in this ratio at temperatures below 473 K indicates thermal electrons. The temperature was measured by a thermocouple in the block. The data were collected using the commercial data system. The details of the instruments’ calibration can be found in the original publications.
The 1-torr CO2 chemical ionization mass spectra were taken after the instrument was tuned using peaks for perfluorotributylamine, (PFTBA). The tuning was optimized at 473 K and kept the same throughout the temperature variations. Tuning profiles were checked to verify the results at different temperatures. The spectra were taken from a single mixture containing SF6, C2Cl4, and C2HCl3 in concentrations to give peaks in the linear range at low temperatures. Only one solution was used so that at higher temperatures the parent negative ion of the C2HCl3 was not observed. The ion source temperature was allowed to equilibrate for approximately 45 min. Integrating the ion intensities for each of the isotopes over the chromatographic peak and calibrating to the SF6 peak at low temperatures give the molar response. This assumes that the instantaneous negative-ion concentration is proportional to the concentration of the neutral, and that the ionic reactions are fast relative to the elution time of the chromatographic peak [9].
Figure 5.12 illustrates the negative-ion abundances for SF6, C2Cl4, and C2HCl3 measured as a function of temperature using this system. In the original analysis only one state was assumed and the slope and intercepts determined using four

REDUCTION OF NEGATIVE-ION MASS SPECTRAL DATA |
95 |
Figure 5.12 Negative-ion mass spectrometry data plotted as ln KT3=2 versus 1;000=T for tetrachloroethylene, trichloroethylene, and sulfur hexafluoride. The magnitude was scaled to the value of k1 for SF6 at room temperature. The data for the chloroethylenes exhibit two states with a and b regions. The Qan values are determined by the data to be 1.0. The responses were obtained by injecting a solution with a known amount of the three compounds into the mass spectrometer. These data were collected with a chemical ionization mass spectrometer.
parameters. The intercepts for C2Cl4 and C2HCl3 were higher than for SF6 when the same scale factor was used. Now it is believed two bound states contribute to the ECD and NIMS data and unimolecular dissociation takes place. Thus, three lowlying curves are involved. If we use two states and fix the Q and A1 values, two electron affinities for C2Cl4 and C2HCl3 are obtained. The ground-state Ea are 0.70(5) eV and 0.48(10) eV, while the first excited-state values are 0.52(10) eV and 0.35(10) eV. The activation energies for C2HCl3 are 0.18(5) eV for both states. The E1 for the ground state for C2Cl4 is 0.10(5) eV and for the excited state is 0.01(5) eV [9].
These results suggest a method for converting the NIMS data in the literature to limits for the electron affinities. For this particular system the parent negative ion is observed at the higher temperature of 523 K and the lower temperature of 373 K when the electron affinity is greater than 0.7 eV. If the parent negative ion is not observed at the higher temperature but is observed at the lower temperature, 373 K, the electron affinity should be lower than 0.5 eV. If the parent negative ion is not observed at either temperature, the electron affinity of the molecule cannot be estimated. The parent negative ions of benz[a]pyrene, fluoranthene, and
96 EXPERIMENTAL PROCEDURES AND DATA REDUCTION
benz[g,h,i]perylene are observed at both the high and low temperatures. The electron affinities of these molecules are 0.80(3) eV, 0.82(4) eV, and 0.90(10) eV, all in agreement with the value of greater than 0.70 eV. The parent negative ions of chlorobenzene and chloronaphthalene are not observed at either temperature. Their electron affinities are both less than 0.5 eV. For other molecules such as dimethyl phthalate, the parent negative ion is observed at 373 K but not at 523 K. The electron affinity is 0.60(10) eV. Using these examples, we determine that the data will provide an approximate value of the Ea. Substitution effects or CURES-EC calculations can refine these estimates. For example, the electron affinities of the nitrophenols have not been measured. The parent negative ion is the base peak at both temperatures, implying an electron affinity greater than 0.7 eV. The fact that they are hydroxy-substituted nitrobenzenes gives an electron affinity greater than 1.0 eV. The addition of a hydroxyl group to an aromatic molecule increases the Ea by about 0.2 to 0.4 eV. This makes the electron affinities of the nitrophenols between 1.2 and 1.4 eV. The CURES-EC calculated values for the meta, ortho, and para nitrophenols are 1.25, 1.35, and 1.45 eV, with an uncertainty of 0.1 eV.
Some compounds undergo dissociative electron attachment and cannot be analyzed using this procedure. An HF molecule is eliminated in pentafluoroaniline with an electron affinity of about 0.8 eV and the parent negative ion is not observed at either temperature. For C6F5I with Ea greater than 1.5 eV, dissociative electron attachment predominates over molecular ion formation and the largest peak in NIMS is the C6F5 radical anion. The acetyl derivative of m-nitrophenol with an Ea greater than 1.0 eV forms an acetate anion radical and the parent negative ion is not observed. The acetyl derivative of 2,4, dinitrophenol loses an acetate radical and forms the dinitrophenyl radical anion and the parent negative ion is not observed. Another example is the dissociative electron attachment to tetrabromoethylene. The parent negative ion of this compound is not observed at the high or low temperature. The base peak is the 158, 160, 162 triplet for Br2( ), while the (M Br)( ) and Br( ) ions are of much lower intensity. The elimination of Br2( ) from the parent negative ion is preferred over the simple dissociation to give the Br( ) ion. The absence of a parent negative ion is not just evidence of low electron affinity. A parent negative ion can undergo dissociative electron attachment, involve ion molecule reactions, as well as detach an electron due to its low electron affinity.
5.5PRECISION AND ACCURACY
The concepts of precision and accuracy, ‘‘P and A plots,’’ and timelines are applied to the evaluation of the accuracy and precision of the electron affinities of selected atoms and molecules. The adiabatic electron affinities of the elements have been measured with a variety of techniques. Thus, the most accurate and precise values will be the weighted averages, which is also the least-squares solution.
The measurement of any property or measurand is the result of a series of steps that result in an end value. The required accuracy of the measurand is dependent on