
Chen The electron capture detector
.pdfNONDISSOCIATIVE ELECTRON CAPTURE |
57 |
than that for nitrobenzene. The activation energy for thermal electron attachment to SF6 is small. In NIMS the ion abundance can be scaled to measured values of A1 to obtain a measure of Qan directly for compounds that exhibit both a and b regions. The values of the Qan are unity for these data since the A1 for nitrobenzene is less than that for SF6. The intensity of the departing group in dissociative electron capture can be determined as a function of temperature and used to infer the presence of excited states [14–16].
A similar kinetic model has been developed for the measurement of ion complex formation kinetics and energies involving both dissociative and nondissociative electron capture, for example, the hydration of halide ions and of O2( ). The ratio of negative ions observed in NIMS can be used to determine energies of complex formation. In this case the sequential formation of the higher complexes must be added to the kinetic model. These studies are important because they demonstrate that the API mass spectrometer can be used to measure thermodynamic quantities. When we use the data for hydrates of O2( ) as an example, the kinetic expression is given by
½O2 ½H2O&Ið Þ&=½O2&½O2 ½H2O&i 1ð Þ& ¼ ki=k ifk i=fk i þ kN CCg ð4:17Þ
where the k’s are forward and reverse rate constants for the formation of the ith complex, CC is 1 þ Ri, and Ri is a measured ion ratio.
At low temperatures this reduces to a pseudo-b region in which the temperature dependence is small:
½O2 ½H2O&Ið Þ&=½O2&½O2 ½H2O&i 1ð Þ& ¼ ki=kN CC |
ð4:18Þ |
At high temperatures the expression becomes
½O2 ½H2O&Ið Þ&=½O2&½O2 ½H2O&i 1ð Þ& ¼ ki=k i |
ð4:19Þ |
which is the standard equilibrium expression.
These data can be reduced by nonlinear least squares using the relationship
lnf½O2 ½H2O&Ið Þ&=½O2&½O2 ½H2O&i 1ð Þ&g þ ln CC ¼ S=R H=RT
ð4:20Þ
to give the enthalpy and entropy of the complex formation [16].
Figure 4.6 shows the ion ratios measured in the determination of the energies of the hydrates of O2( ). The ratios are normalized to the most intense ion, n ¼ 1, m=z ¼ 50 ions. At 589 K the ratio of the 50/32 ions is about 1. When the temperature is 480 K, the m=z ¼ 32 ion is only about 1% of the m=z ¼ 50 ion, while the m=z ¼ 68 ion is about the same as the m=z ¼ 50 ion.
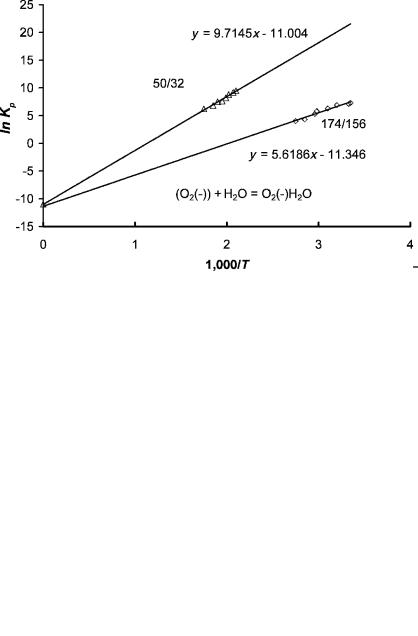
Figure 4.7 gives the plots of ln(Kp) versus 1;000=T for the 0-1 hydrates and 6-7 hydrates. The entropy changes for these complexes are essentially the same, but the enthalpy changes are 0.85 eV and 0.45 eV. The values for the 0-1, 1-2, and
58 THEORETICAL BASIS OF THE EXPERIMENTAL TOOLS
Figure 4.6 Atmospheric pressure ionization ion ratios measured in the determination of the energies of the hydrates of O2( ). The ratios are given as a function of temperature for the n ¼ 0, 1, 2 hydrates. The mass spectrometer is described in detail in Chapter 5.
Figure 4.7 Negative-ion mass spectrometry data for O2 ( ) (H2O)n for equilibrium constants obtained from the ion intensities as shown in Figure 4.6, plotted as ln Kp versus 1;000=T. The intercept multiplied by R is the standard entropy, while the slope multiplied by R is the heat of reaction. The plots for the n ¼ 0 to n ¼ 1 complex and the n ¼ 6 to n ¼ 7 complex have approximately the same intercept. Data from [16].
DISSOCIATIVE ELECTRON ATTACHMENT |
59 |
2-3 complexes have been measured by negative-ion mass spectrometry, but the higher hydrates were not studied [19]. This type of research was also carried out for the hydrates and methanolates of the halides. The hydrates are important to atmospheric processes and will be discussed in Chapter 11.
4.4DISSOCIATIVE ELECTRON ATTACHMENT
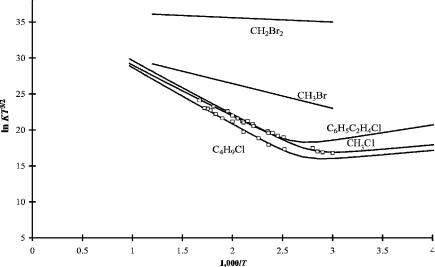
Dissociative electron capture is observed with hyperthermal electrons in NIMS electron impact experiments. In order for dissociative electron capture to take place with thermal electrons, there must be a dissociative pathway that is accessible by the thermal activation of the neutral molecule or a low-lying negative-ion state. The quantity DðR LeÞ Ea(Le) must be less than about 1.0 eV. This limit has been established empirically. Two types of dissociative thermal electron attachment have been observed in NIMS and ECD. The first occurs by unimolecular dissociation in which there is only one temperature region for many compounds. In the original work a low-temperature low-slope region was observed but unexplained. We now believe this could represent the formation of a molecular ion with an electron affinity of about 0.1 eV. The exact nature of this ion is not known, but it could represent stabilization to an excited state. In Figure 4.8 ECD data are plotted for several
Figure 4.8 ECD data plotted as ln Kp versus 1;000=T. These alkyl halides dissociate via activation of the molecule. They are designated DEC(1) for dissociative electron capture via activation of the molecule. The slope multiplied by R is equal to the activation energy in the high-temperature region. The low-temperature data were originally not explained, but could be an indication of a low molecular electron affinity. The curves were fit using both dissociation and molecular ion formation. Data from [16–19].
60 THEORETICAL BASIS OF THE EXPERIMENTAL TOOLS
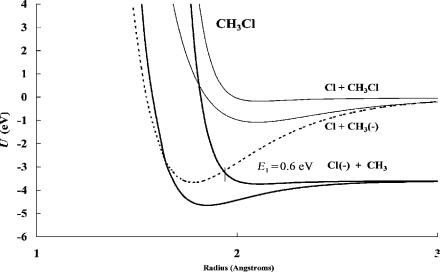
Figure 4.9 Morse potential energy curves for chloromethane and its ions. The curves are calculated using the activation energy determined from data in Figure 4.8. The hightemperature data is for unimolecular dissociation via the curve crossing on the approach side of the molecule. Only the VEa is negative and dissociation occurs in the Franck Condon transition. The thermal energy dissociation occurs through the thermal activation of the molecule, as is the case for all DEC(1) molecules.
compounds that dissociate unimolecularly. As shown in the graphs, the intercepts range from 33 to 37 and encompass the ln(DEBA) value of 36. The EDEA for many of these reactions are positive so dissociative thermal electron attachment is exothermic. These are designated as DEC(1) molecules [17–20].
In Figure 4.9 pseudo-two-dimensional Morse potentials are shown for CH3Cl. The quantity DðR ClÞ Ea(Cl) is about 0.05 eV so dissociative thermal electron attachment is slightly exothermic. The excited-state Morse potential energy curve that crosses on the right-hand side leads to unimolecular dissociation. However, the excited-state electron affinity is small but positive. If it were possible to stabilize the excited-state ion, then the equilibrium between that anion and the neutral could be responsible for the low-temperature data illustrated in Figure 4.8. Dissociation from the stabilized ground-state negative ion would have an activation energy of dissociation, E2 ¼ 1:0 eV. This is based on the adiabatic electron affinity of CH3Cl, assumed to be about 1 eV after comparison to the other chloromethanes [21].
In unimolecular dissociation the experimental activation energy is an upper limit to the quantity -EDEA ¼ DðR ClÞ Ea(Cl). It was empirically observed that the activation energy was linearly related to EDEA with a slope of unity and approached zero for an exothermicity of about 13 kcal/mole or 0.6 eV. Thus,
DISSOCIATIVE ELECTRON ATTACHMENT |
61 |
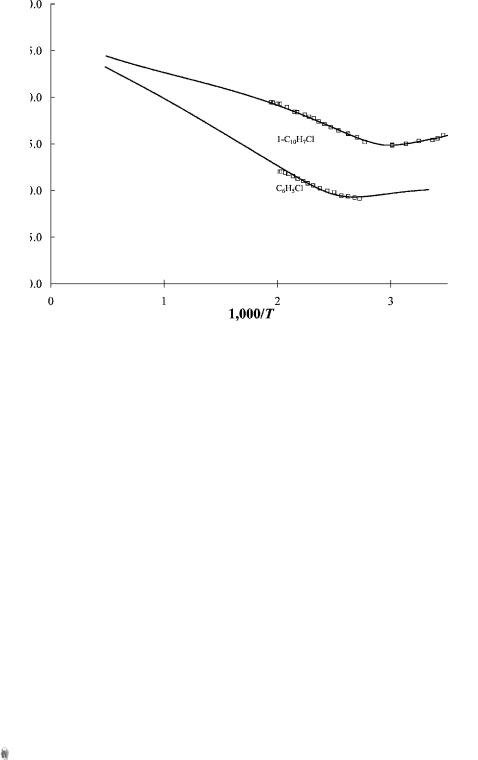
Figure 4.10 ECD data plotted as ln Kp versus 1;000=T. Chlorobenzene and chloronaphthalene dissociate via an intermediate molecular ion. They are designated DEC(2) for dissociative electron capture by a two-step process. The slope in the high-temperature region multiplied by R is equal to the EDEA. Given the electron affinity of the dissociating species, in this case Cl( ), the C Cl bond dissociation energy can be measured. Data from [17–19].
estimates of bond dissociation energies could be obtained from the ECD data for these compounds [20].
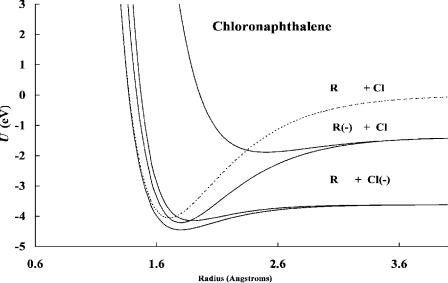
Another type of dissociative thermal electron attachment observed in the ECD is the sequential dissociation of a stabilized negative ion. These molecules are designated as DEC(2) molecules. Chlorobenzene, chloronaphthalene, nitromethane, and acetic anhydride are DEC(2) molecules. At high temperatures the dissociation proceeds via the intermediate molecular ion with an activation energy equal to -EDEA. At low temperatures the data are the same as for the Eql(1/1) molecules. The data for chlorobenzene and 1-chloronaphthalene can be seen in Figure 4.10. The electron affinities of the radicals, the C Cl bond dissociation energies, and electron impact distributions have been measured for both of these compounds so that one may examine the equality between the activation energy and –EDEA. In addition, the electron impact spectra for the formation of the chloride ion have been measured. The molecular electron affinities are obtained from ECD data and confirmed by reduction potentials. These data can be used to calculate negative-ion Morse potentials. There are two low-lying dissociation limits in the C Cl dimension, leading to Cl( ) þ R and Cl þ Rð Þ. A bonding and an antibonding curve
62 THEORETICAL BASIS OF THE EXPERIMENTAL TOOLS
Figure 4.11 Morse potential energy curves for chloronaphthalene and its ions. The curves are calculated using the activation energy and electron affinity determined from the data in Figure 4.10. The high-temperature data are for sequential dissociation. For the two lowest curves the VEa and EDEA are negative, but molecular ion formation precedes dissociation in the Franck Condon transition.
leading to each limit is drawn. The curves for 1-chloronaphthalene are shown in Figure 4.11. By comparing these curves to those for chloromethane, we see that the major difference is the electron affinity of R. In the case of the methyl group it is about zero, whereas in the case of the naphthyl radical it is 1.40(1) eV [22]. In both cases the ground-state curve crosses on the ‘‘backside’’ and thermal electron attachment will take place via an excited-state curve. In the case of chloronaphthalene there are at least two low-lying curves. In addition, there are curves leading to the radical anion and a hydrogen atom, and the hydrogen anion and radical in the C H dimension. The intermediate negative ions can be stabilized to the groundstate anion, from which dissociation takes place. The higher electron affinity of the naphthyl radical lowers the excited-state anion curve to the region where thermal electron attachment may occur.
Only compounds that undergo sequential dissociative thermal electron attachment can exhibit a g region, where (k2 kN ) and (k 1 k2), and K ¼ ½k2=2kD&½k1=k 1&, and the d region, where (k2 k 1 þ kN ) and K ¼ k1=2kD.
In the g region the slope is approximately equal to (Ea E2) |
since |
K ¼ ½k2=2kD&½k1=k 1&: |
|
ln KT3=2 ¼ lnðT=2ADÞ þ lnðA2A1=A 1Þ þ ðEa E2Þ=RT |
ð4:21Þ |
DISSOCIATIVE ELECTRON ATTACHMENT |
63 |
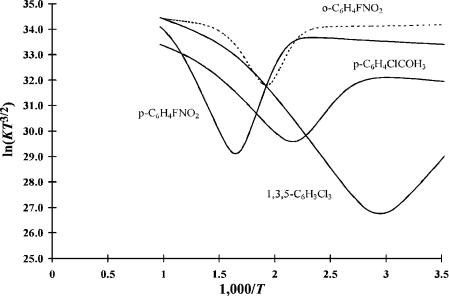
Figure 4.12 ECD data plotted as ln KT3=2 versus 1;000=T. The compounds in this graph are DEC(2). The electron affinities of the molecules are higher so that as many as four regions are observed: a, b, g, and d for o-F-nitrobenzene. The other molecules exhibit three regions. Data from [23, 24].
Since E2 is greater than Ea, there will be a change in the sign of the slope in the transition from the a to g region. The experimental quantity (EaðRLe) E2) is DðR LeÞ Ea(Le). In the b and d regions K ¼ k1=2kD, and the ECD data define A1 and E1. The specific regions observed will depend on the electron affinity of the dissociating species and the electron affinity of the compound.
Compounds with a large electron affinity and low activation energy can exhibit all four regions. Figure 4.12 is a plot of ln KT3=2 versus 1;000=T for two F-nitro- benzenes, 1,3,5-C6H3Cl3 and p-ClC6H4COCH3, obtained using the ECD. All six of the kinetic and thermodynamic parameters have been obtained for o-F nitrobenzene. The chloronaphthalene and chlorobenzene data shown in Figure 4.10 only have data in two regions. The curve for 1-chloronaphthalene at high temperatures was drawn with nominal values of A1 and E1.
The data for o-FNB is the prototypical data for a compound that exhibits four temperature regions. In the case of o-F-nitrobenzene the A1, E1, and Ea values have been measured using other techniques, and the values of A2 and E2 have been measured experimentally or calculated [23, 24]. The only parameter that has not been measured by an independent procedure is Qan. All the quantities obtained from the ECD agree with values obtained by other techniques. In other words, the ECD response could have been calculated from properties measured in independent experiments if the value of Qan was assumed to be unity.
64 THEORETICAL BASIS OF THE EXPERIMENTAL TOOLS
4.5 ELECTRON AFFINITIES AND HALF-WAVE REDUCTION POTENTIALS
The first experimental method for obtaining relative electron affinities was the measurement of half-wave reductions potentials in aprotic solvents. The electron affinities are related to the half-wave reduction potentials by a simple relationship
EaðeVÞ ¼ EðrefÞ ð GÞ þ E1=2 |
ð4:23Þ |
where G (mdd G) is the solution energy difference for the reaction in the gas phase and in solution, and E(ref) is the energy for the reference electrode (4.71 eV for the SCE electrode). The inclusion of the negative sign in the term G allows us to discuss absolute magnitudes. The gas phase Ea is obtained from half-wave reduction potentials by using the appropriate reference energy and mdd G. The G is a function of the solvent and the specific counter ion, but is constant for a given aprotic solvent.
When the ECD electron affinities were measured, the G for the aromatic hydrocarbons (2.0 eV) and the aromatic aldehydes and ketones (2.3 eV) were observed to be approximately constant within the class of molecules, but different from each other. The fullerenes ( G ¼ 1:76 eV) have a lower charge density and lower G than the majority of other compounds. With the determination of more gas phase electron affinities, the G values range from 1.7 eV for larger fullerenes to 2.7 eV for small anions [3, 10].
The majority of G obtained from experimental gas phase Ea’s fall into three groups that range from 2.0 to 2.4 eV. The average value for all these molecules is 2.2 0.2 eV. Five groups starting at 1.8 eV, with an increment of 0.2 eV for each group, are defined. For the A group, which includes the aromatic hydrocarbons, the charge is delocalized and G ¼ 2:00 eV. The B group, containing benzoquinones, is assigned the value G ¼ 2:20 eV. The C group, containing chlorinated-nitro aromatics, has higher charge densities with G ¼ 2:40 eV. For the D molecules, such as nitrotoluenes, G ¼ 2:60. For the fullerenes or F group G ¼ 1:80 eV and the charge disperses. The charge is localized
in the high-extreme |
EH group, such as acetate ion, with G ¼ 2:70 eV, |
while some of the |
larger fullerenes are at the lower extreme (EL) with |
G ¼ 1:70 eV. The groups and are their G EL, 1.70; F, 1.80; mAF, 1.90; A, 2.00; mAB, 2.1; B, 2.20; mBC, 2.30; C, 2.40; mCD, 2.50; D, 2.60; and EH, 2.70, respectively. The classifications yield a series of linear equations:
EAðeVÞ ¼ EðrefÞ 2:20 |
nfdevð GÞg þ E1=2 |
|
¼ EðrefÞ 2:20 |
nf0:10g þ E1=2 |
ð4:24Þ |
n ¼ 5; 4; 3; 2; 1; 0; 1; 2; 3; 4; 5 |
|
|
This may seem to involve merely grouping molecules according to their measured deviations. This would be true if there were no fundamental basis for the grouping.
ELECTRON AFFINITIES AND HALF-WAVE REDUCTION POTENTIALS |
65 |
However, it has been postulated that the different groups have different degrees of charge localization. The charge densities on the atoms in molecules can be calculated quantum mechanically. For the nitrobenzene anion it is about 0.8q on the nitro group and adjacent carbon atom. In the case of the acetophenone anion the charge in the vicinity of the carbonyl group is 0.5q, while that for each carbonyl group in the benzoquinone anion is 0.3q. In the anthracene anion the charges on the C H bonds range from 0.08 to 0.15q. The maximum charge on two adjacent C atoms in the C60 anion is about 0.04q. The change in charge density, 0.04 to 0.8q, mirrors theG change, 1.8 to 2.6 eV. To normalize this to unit charge, the G values extend from 1.70 to 2.70. With more data perhaps a continuous relationship can be found between charge density and G. Compounds for which gas phase Ea and reduction potentials have been measured define the set. The new problem is to accurately and objectively assign molecules and determine n [25].
In 1970 the MINDO/3 and E1/2 values were correlated with two parameters in the linear equation, E1=2 ¼ m (EaÞ þ b, to give a reported standard deviation of 0.028 eV. The slope was 0.92. In this data analysis outliers must have been statistically eliminated since some of the deviations are greater than 0.1 eV, three times the reported standard deviation. Using all the MINDO/3 Ea and a unit slope, we obtain an average G value of 1.94 0.08 eV. The greater deviation results from the use of one less parameter and all the data [26].
The aromatic hydrocarbons have been classified into subgroups based on the average and standard deviation, G ¼ 2:00 0:05 eV. For five groups the error in the G is reduced from 0.05 eV to 0.02 eV. For a larger set of 80 compounds the average deviation in the G is reduced from 0.08 eV to 0.015 eV by this classification into eight groups. Clearly, the number of degrees of freedom in this case is more than 70. If the integer range in equation 4.24 is extended from 10 to þ10, 21 subgroups are defined for the entire range, 1.70 eV to 2.70 eV. The groups can be designated, for example, by Aþ for an G of 2.05 eV.
In order to use these subgroups, enough accurate data must be available. Since the relative reduction potentials can be measured to within 0.01 volts (V), the errors in the Ea must be reduced. In the case of the aromatic hydrocarbon set there are enough such data. The deviation is defined as s(Ea) ¼ (Ea(experimental) Ea(calculated)). The ultimate goal is the reduction of s(Ea). These Ea can then be compared with the theoretical values or other experimental values such as those obtained from electronegativities. The procedure can be iterated to self-consistency. Groups separated by 0.05 eV are postulated for the fullerenes and aromatic hydrocarbons based on experimental data.
Table 4.3 lists G values, the ECD Ea, and the Ea from E1/2, of several aromatic hydrocarbons obtained in this manner. The electron affinity for pentacene was determined by TCT, while that of coronene is the value obtained from reduction potentials [6]. The Ea are verified using CURES-EC. The calculated values are given in Table 4.3. Also listed are the weighted average of the values that cluster about the ‘‘current evaluated values’’ from a 1983 compilation [27]. The consistency of the Ea values in this table support the gas phase experiment and the assignments of lower values to excited states.

66 THEORETICAL BASIS OF THE EXPERIMENTAL TOOLS
TABLE 4.3 Electron Affinities (in eV) and Solution Energies of Aromatic Hydrocarbons
Species |
ECD/TCT |
E(1/2) |
CURES |
1984 |
G |
Naphthalene |
0.16(2) |
0.17(3) |
0.15 |
0.15 |
2.10 |
Anthracene |
0.68(2) |
0.72(2) |
0.70 |
0.68 |
2.05 |
Tetracene |
1.08(4) |
1.09(3) |
1.08 |
1.08 |
2.05 |
Pentacene |
1.39(5) |
1.37(3) |
1.34 |
1.35 |
1.95 |
Phenanthrene |
0.30(2) |
0.31(3) |
0.32 |
0.31 |
1.95 |
Benz[a]anthracene |
0.72(2) |
0.72(3) |
0.74 |
0.69 |
1.90 |
Triphenylene |
0.29(2) |
0.29(3) |
0.27 |
0.29 |
1.95 |
Dibenz[a,h]anthracene |
0.69(3) |
0.65(3) |
0.66 |
0.69 |
1.95 |
Chrysene |
0.42(4) |
0.42(3) |
0.43 |
0.42 |
2.00 |
Benz[c]phenanthrene |
0.58(1) |
0.58(3) |
0.60 |
0.55 |
1.90 |
Picene |
0.54(3) |
0.49(3) |
0.50 |
0.52 |
1.90 |
Pyrene |
0.61(2) |
0.63(3) |
0.62 |
0.60 |
2.00 |
Perylene |
0.98(1) |
1.01(3) |
1.00 |
0.96 |
1.95 |
Benz[a]pyrene |
0.82(4) |
0.79(3) |
0.80 |
0.75 |
1.90 |
Fluoranthene |
0.82(4) |
0.83(3) |
0.81 |
0.76 |
2.00 |
Biphenyl |
0.13(2) |
0.10(3) |
0.10 |
0.15 |
2.00 |
Styrene |
0.10(5) |
0.12(3) |
0.10 |
0.05 |
2.10 |
Azulene |
0.84(5) |
0.83(5) |
0.78 |
0.75 |
2.25 |
Coronene |
— |
0.79(5) |
0.80 |
0.82 |
1.80 |
|
|
|
|
|
|
4.6 ELECTRON AFFINITIES AND IONIZATION POTENTIALS OF AROMATIC HYDROCARBONS
The electronegativity of hydrocarbons is half the sum of the ionization potential plus the electron affinity, the Mulliken definition of the electronegativity of atoms. In the simplest approximation the electronegativity is constant and equal to the work function of graphite. This gives the relationship:
2EN ¼ IP þ Ea |
ð4:28Þ |
If two of these quantities are measured, then the third can be obtained.
As more experimental values of both electron affinities and ionization potentials were measured, this relationship was tested. For the alternate aromatic hydrocarbons the EN is approximately 4.02 eV, as opposed to the work function of graphite that is 4.39 eV. The EN for the smaller aromatic hydrocarbons is 4.1 eV. The EN for hydrocarbons with five-membered rings, 4.4 eV, and C60, 4.5 eV, is closer to the work function of graphite. Table 4.4 gives the Ea, IP, and EN values for several hydrocarbons. From a larger set of data the EN is not constant. If the values for styrene, fluoranthene, naphthalene, styrene, and azulene are not included, then EN ¼ 4:02 0:02 eV can be used to calculate either the Ea or IP. The calculated Ea are compared to the ECD values in Table 4.4 [10].
