
Chen The electron capture detector
.pdf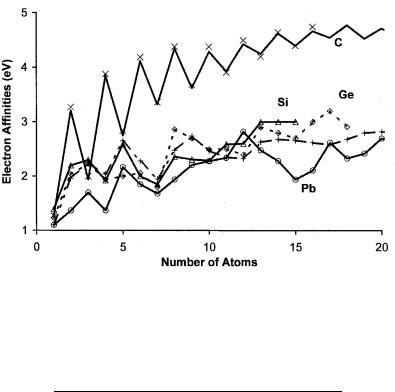
ELECTRON AFFINITIES OF ATOMIC CLUSTERS |
187 |
Figure 8.15 Plot of experimental and theoretical electron affinities of carbon silicon, germanium tin, and lead clusters versus number of atoms. The experimental data are from [12, 45–54].
TABLE 8.5 Electron Affinity (in eV) of Linear Carbon
Clusters and Si, Ge, Sn, and Pb Clusters, n ¼ 2 to 20 [12]
N |
C |
Si |
Ge |
Sn |
Pb |
|
|
|
|
|
|
1 |
1.27 |
1.39 |
1.23 |
1.11 |
1.10 |
2 |
3.27 |
2.20 |
2.04 |
1.97 |
1.37 |
3 |
2.00 |
2.30 |
2.23 |
2.24 |
1.70 |
4 |
3.88 |
1.92 |
1.94 |
2.04 |
1.37 |
5 |
2.84 |
2.59 |
2.00 |
2.65 |
2.17 |
6 |
4.19 |
2.00 |
2.06 |
2.28 |
1.85 |
7 |
3.36 |
1.85 |
1.80 |
1.95 |
1.68 |
8 |
4.38 |
2.36 |
2.86 |
2.48 |
1.94 |
9 |
3.68 |
2.31 |
2.70 |
2.74 |
2.21 |
10 |
4.38 |
2.29 |
2.50 |
2.47 |
2.28 |
11 |
3.91 |
2.59 |
2.50 |
2.35 |
2.34 |
12 |
4.50 |
2.60 |
2.40 |
2.33 |
2.82 |
13 |
4.20 |
3.00 |
2.90 |
2.63 |
2.48 |
14 |
4.65 |
3.00 |
2.80 |
2.68 |
2.28 |
15 |
4.40 |
3.00 |
2.70 |
2.66 |
1.94 |
16 |
4.75 |
— |
3.00 |
2.62 |
2.11 |
17 |
— |
— |
3.20 |
2.58 |
2.62 |
18 |
— |
— |
2.91 |
2.68 |
2.33 |
19 |
— |
— |
— |
2.80 |
2.42 |
20 |
— |
— |
— |
2.82 |
2.70 |
|
|
|
|
|
|
188 SELECTION, ASSIGNMENT, AND CORRELATIONS OF ATOMIC ELECTRON AFFINITIES
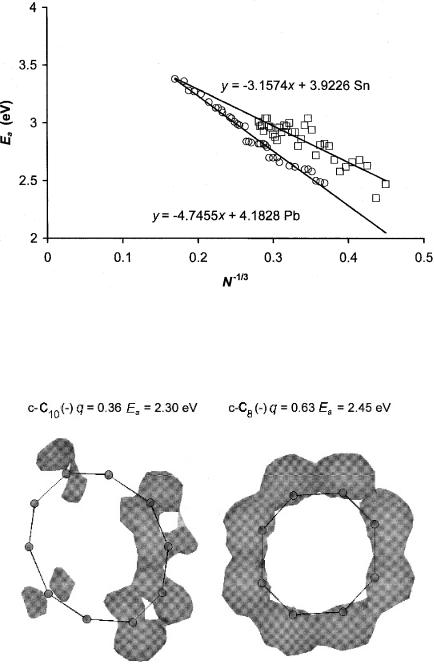
Figure 8.16 Plot of experimental and theoretical electron affinities of tin and lead clusters versus N 1=3, where N is the number of atoms. This plot should extrapolate to the work functions for metals. The extrapolated value for lead is approximately the same as the work function, but that for tin is lower than the work function. The experimental data are from [12].
Figure 8.17 Three-dimensional spin densities of the negative ions of cyclic C8 and cyclic C10 calculated for the addition of one electron to the combined system using AM1. The values of the charge densities indicate that the electron affinity of c-C8 > c-C10 ¼ 2.30 eV.
SUMMARY 189
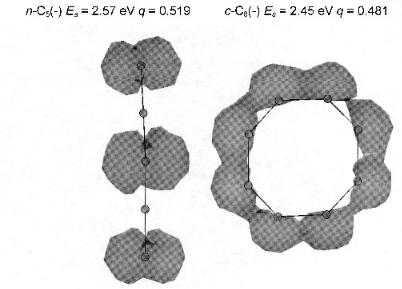
Figure 8.18 Three-dimensional spin densities of the negative ions of cyclic C8 and linear C5 calculated for the addition of one electron to the combined system using AM1. The CURES-EC value for c-C8 is equal to 2.45 eV, while the density functional value is 2.57 eV. The READS-TCT data shown in Figures 8.17 and 8.18 are consistent with a value of 2:5 0:1 eV for the Ea of c-C8.
4.25 eV, using a metallic model where Ea is related to N 1=3. The extrapolated value for Sn is less than the work function, indicating some covalent rather than metallic bonding. These plots can be observed in Figure 8.16 [54].
In Figures 8.17 and 8.18 the results of a READS-TCT calculation are given. The three-dimensional spin densities of the negative ions of the cyclic C8 and C10 are shown in Figure 8.17, while those for the cyclic C8(-) and linear C5(-) are shown in Figure 8.18. The experimental electron affinity of C10 is 2.30 eV, whereas that for the cyclic C8 has not been reported. The CURES-EC and density functional values are 2.47 eV and 2.59 eV for the cyclic C8. The READS TCT calculation shows electron transfer from C10 ðq ¼ 0:36Þ to C8 ðq ¼ 0:63Þ. This indicates the Ea of C8 > 2:30 eV. The electron affinity of the cyclic C8 is about the same as that for the linear C5, as are the q values. The experimental Ea for the linear C5 is 2.57 eV. This is consistent with an Ea of cyclic C8 ¼ 2:5 0:1 eV. The spin densities reflect the charge distribution and illustrate electron transfer through space.
8.5SUMMARY
Three groups of atomic AEa can be discerned: those that are precisely and accurately measured to one meV; those that have been precisely measured but have
190 SELECTION, ASSIGNMENT, AND CORRELATIONS OF ATOMIC ELECTRON AFFINITIES
not been confirmed; and those that have only been estimated. If a value has been measured by two or more methods and those values agree within the random uncertainty, the weighted average is the ‘‘best’’ value. When this is the largest value, it is the AEa. A single very precise value will dominate the weighted average and the uncertainty will be approximately equal to that determination. Precise positive electron affinities for the Group 0 to Group VII elements can be assigned to the ground state. Some other positive values are assigned to excited states. Experimental values for the electron affinities of all the d elements and some of the f elements are available. However, based on the abnormalities in periodic trends of the d and f group elements and the lack of verification of the experimental values, these are not necessarily the AEa.
The experimental work functions of the metals are related to the Mulliken electronegativities by a constant displacement, P ¼ 0:9, 0.5, 0, 0.2, and 0.5 eV, for the majority of the elements. The Pauling and Allen Rochow electronegativities have systematic variations similar to the Mulliken electronegativities for the main group of elements, but the values are different in magnitude for the d and f block elements.
The electron affinities of the linear and monocyclic Cn clusters have been calculated using the CURES-EC method and agree with the experimental values. The electron affinities of the Sin, Gen, Snn, and Pbn vary with N in a manner similar to those of the cyclic Cn compounds. Up to N ¼ 15 to 20, the values are considerably lower than the bulk work function. This behavior is different from that for metallic clusters, where the electron affinity is a function of N 1=3. However, the data for Pb taken up to N ¼ 204 can be extrapolated to the work function.
REFERENCES
1.Pritchard, H. O. Chem. Rev. 1953, 52, 529.
2.Berry, R. S Chem. Rev. 1969, 69, 533.
3.Zeforov, Y. V. Zh. Strukturnoi Khimi 1973, 14, 762.
4.Chen, E. C. M. and Wentworth, W. E. J. Chem. Educ. 1975, 52, 486.
5.Hotop, H. and Lineberger, W. C. J. Phys. Chem. Ref. Data 1975, 4, 539.
6.Massey, H. S. W. Negative Ions. New York: Cambridge University Press, 1976.
7.Christodoulides, A. A.; McCorkle, D. L.; and Christophorou, L. G. ‘‘Electron Affinities of Atoms, Molecules and Radicals’’ in Electron-Molecule Interactions and Their Applications. New York: Academic Press, 1984.
8.Hotop, H. and Lineberger, W. C. J. Phys. Chem. Ref. Data 1985, 14, 731.
9.Wheeler, J. C. J. Chem. Educ. 1997, 74, 123.
10.Nadeau, M.-J.; Garwan, M. A.; Zhao, X.-L.; and Litherland, A. E. Nucl. Instr. Meth. Phys. Res. B 1997 123, 521.
11.Andersen, T., Haugen, H. K.; and Hotop, H. J. Phys. Chem. Ref. Data 1999, 28, 1511.
12.National Institute of Standards and Technology (NIST). Chemistry WebBook, 2003. Available at http://webbook.nist.gov.
REFERENCES 191
13.Rienstra-Kiracofe, J. C.; Tschumper, G. S.; Schaeffer, H. F.; Nandi, S.; and Ellison, G. B.
Chem. Rev. 2002, 102, 231.
14.Davis, V. T. and Thompson, J. S. Phys. Rev. A 2001, 65, 10501R.
15.Davis, V. T. and Thompson, J. S. J. Phys. B 2001, 354, L433.
16.Davis, V. T. and Thompson, J. S. J. Phys. B 2002, 35, L11.
17.Davis, V. T. and Thompson, J. S. Phys. Rev. Lett. 2002, 88, 073003.
18.Page, F. M. and Goode, G. C. Negative Ions and the Magnetron. New York: WileyInterscience, 1969.
19.Khvostenko, V. I. and Dukel’skil, V. M. Zh. Eksp. Teor. Fiz. 1958, 37, 651.
20.Sheer, M. D. and Fine, J. J. Chem. Phys. 1967, 46, 3998.
21.Sheer, M. D. and Fine, J. J. Chem. Phys. 1969, 50, 4343.
22.Sheer, M. D. J. Res. Nat. Bur. Stds. 1970, A74, 37.
23.Bailey, T. L. J. Chem. Phys. 1958, 28, 792.
24.Zandberg, E. Y.; Kamenev, A. G.; and Paleev, V. I. Sov. Phys.-Tech Phys. 1971, 16, 832.
25.Zandberg, E. Y.; Kamenev, A. G.; and Paleev, V. I. Sov. Phys.-Tech Phys. 1972, 16, 1657.
26.Ansdell, D. A. and Page, F. M. Trans. Faraday Soc. 1962, 58, 1084.
27.McCullum, K. J. and Mayer, J. E. J. Chem. Phys. 1943, 11, 56.
28.Doty, P. M. and Mayer, J. E. J. Chem. Phys. 1944, 12, 323.
29.Sutton, J. and Mayer, J. E. J. Chem. Phys. 1935, 3, 20.
30.Feldman, D. In Proc. 8th Internat. Conf. on Electr. Atom. Collis. Belgrade, 1973.
31.Williams, W. W.; Carpenter, D. L.; Covington, A. M.; Koepnick, M. C.; Calabrese, D.; and Thompson, J. S. J. Phys. B 1998, 31, L341.
32.Lippa, T. P.; Xu, S. J.; Lyapustina, S. A.; Nilles, J. M.; and Bowen, K. H. J. Chem. Phys. 1998, 109, 10727.
33.Dukel’skil, V. M.; and Sokolov, V. M. Zh. Eksp. Teor. Fiz. 1957, 32, 394.
34.Brunot, A.; Cottin, M.; Gotchiguian, P.; and Muller, J. C. Int. J. Mass Spectrom. Ion Phys. 1981, 41, 31.
35.Feigerle, C. S.; Corderman, R. R.; and Lineberger, W. C. J. Chem. Phys, 1981, 74, 1513.
36.Buckman, S. J. and Clark, C. W. Rev. Mod. Phys. 1994, 66, 539.
37.Williams, W. W.; Carpenter, D. L.; Covington, A. M.; Thompson, J. S.; Kvale, T. J.; and Seely, D. G. Phys. Rev. A 1998, 58, 3582.
38.Brunot, A.; Cottin, M.; Donnart, M. H.; and Muller, J. C. Int. J. Mass Spectrom. Ion Phys. 1980, 33, 417.
39.Carpenter, D. L.; Covington, A. M.; and Thompson, J. S. Phys. Rev. A 2000, 61, 42501.
40.Landau, A.; Eliav, E.; Ishikawa, Y.; and Kaldor, U. J. Chem. Phys. 2001, 115, 2389.
41.Pauling, L. The Nature of the Chemical Bond, 3rd ed. Ithaca, NY: Cornell University Press,
1960.
42.Porterfield, W. W. Inorganic Chemistry. New York: Academic Press, 1993.
43.Chen, E. C. M.; Wentworth, W. E.; and Ayala, J. A. J. Chem. Phys. 1977, 67, 2642.
44.Michaelson, H. B. IBM J. Res. Dev. 1978, 22, 72.
45.Chen, E. C. M.; Schulze, Welk, S.; Brown, T.; and Chen E. S. D. The Chemist 1999.
46.Yang, S.; Taylor, K. J.; Craycraft, M. J.; Conceicao, J.; Pettiette, C. L.; Cherhnovsky, O.; and Smalley, R. E. Chem. Phys. Lett. 1989, 144, 431.
192 SELECTION, ASSIGNMENT, AND CORRELATIONS OF ATOMIC ELECTRON AFFINITIES
47.Kohno, M.; Suzuki, S.; Shiromaru, H.; Moriwaki, T.; and Achiba, Y. Chem. Phys. Lett. 1998, 282, 330.
48.Arnold, D. W.; Bradforth, S. E.; Kitsopoulos, T. N.; and Neumark. J. Chem. Phys. 1991, 95, 8753.
49.Van Orden, A. and Saykally, R. J. Chem. Rev. 1998, 98, 2313.
50.Lepine, F. Allouche, A. R.; Baguenard, B.; Bordas, C.; and Aubert-Frecon, M. J. Phys. Chem. A 2002, 106, 7177.
51.Giuffreda, M. G.; Deluze, M. S.; and Francois, J. P. J. Phys. Chem. A 2002, 106, 8569.
52.Liu, Y.; Zhang, Q.-L.; Tittel, F. K.; Curl, R. F.; and Smalley, R. E. J. Chem. Phys. 1986, 85, 7434.
53.Negishi, Y.; Kawamata, H.; Nakajima, A.; and Kaya, K. J. Elec. Spectrosc. Rel. Phenom. 2000, 106, 117.
54.Luder, C. and MeiwesBroer, K. H. Chem. Phys. Lett. 1998, 294, 391.

 CHAPTER 9
Diatomic and Triatomic Molecules
and Sulfur Fluorides
9.1INTRODUCTION
In Chapter 8 the electron affinities of atoms were evaluated. In this chapter the electron affinities of diatomic and triatomic molecules and SFn (n ¼ 1 to 6) will be considered. The ECD has been used to study Cl2, Br2, I2, NO, O2, CO2, COS, CS2, N2O, NO2, SO2, SF6. All the Ea for these molecules have been calculated by the CURES-EC method. The comparison of the relative electron affinities of COS, CS2, and N2O will be illustrated by READS-TCT calculations.
The homonuclear diatomic molecules are the simplest closed set of molecules. Many of the electron affinities of the main group diatomic molecules have been measured by anion photoelectron spectroscopy (PES), but only a few have been confirmed. These Ea can be examined by their systematic variation in the Periodic Table. Calculating Morse potential energy curves for the anions and comparing them with curves for isoelectronic species confirm experimental values. The homonuclear diatomic anions of Group IA, IB, VI, VII, and 3d elements and NO are examined first.
Next, electron affinities and Morse potential energy curves for triatomic molecules will be considered. Electron affinities have been reported for CO2, COS, CS2, SO2, N2O, NO2, O3, and N3. The experimental Ea for CO2, COS, CS2, and N2O are uncertain. These are linear in the neutral form and bent in the anion. The valencestate electron affinities are very different, ranging from a negative value for CO2 to 0.89(2) eV for CS2. The energy of these ions is calculated as a function of the bonding angle using CURES-ES. Morse potential energy curves are constructed for the bent and linear forms of these anions from theoretical and experimental data.
Anions of SFn (n ¼ 1 to 6) provide a transition to larger molecules. The anions of SF6 and SF4 are among the most frequently studied in the gas phase. The ECD, atmospheric pressure ionization, and low-pressure chemical ionization mass spectrometry have been used to study SF6. The precise and accurate adiabatic electron
The Electron Capture Detector and the Study of Reactions with Thermal Electrons by E. C. M. Chen and E. S. D. Chen
ISBN 0-471-32622-4 # 2004 John Wiley & Sons, Inc.
193
194 DIATOMIC AND TRIATOMIC MOLECULES AND SULFUR FLUORIDES
affinity of SF6 was measured independently using high-pressure and atmospheric pressure negative-ion mass spectrometry. Values that differ from this largest precise value have been assigned to excited anion states. Morse potential energy curves were constructed for the ground state and excited states using these assignments, electron affinities, and electron impact ion distributions. The ground-state curve of SF6( ) is compared with an ab initio calculation. By analogy the Morse curves for other SFn( ) are calculated. These illustrate the use of excited states to explain the different Ea reported for these compounds. The anion curves provide examples of the Herschbach classifications, D(0–2) and M(0–3).
9.2DIATOMIC MOLECULES
9.2.1 Electron Affinities and Periodic Trends of Homonuclear
Diatomic Molecules
The electron affinities of the main group homonuclear diatomic anions have been measured by PES. A few experimental values for the transition metal dimers are also available. The electron affinities of all the 3d homonuclear diatomic molecules have been calculated using density functional methods [1–4]. Only the AEa of I2, 2.524 eV; C2, 3.27; Si2, 2.20; S2, 1.67; F2, 3.08; Cl2, 2.45; Br2, 2.56; and O2, 1.07 have been measured by more than one method [1–3]. CURES-EC calculations confirm these to within 0.1 eV. Positive excited states Ea have been measured for O2, C2, and I2 and are inferred for other X2 [5–8]. Just as in the case of the atomic Ea, the trends in the Periodic Table can support the assignments of AEa for the other elements.
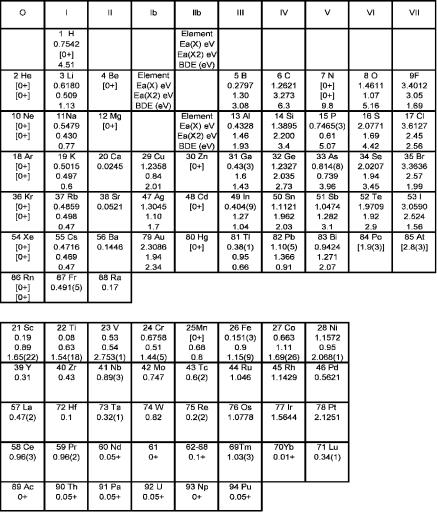
The establishment of accurate and precise Ea for molecules is the ultimate goal of experimental and theoretical studies. The Ea and bond dissociation energies for the Group IA, IB, and IIIA–VIIA homonuclear diatomic molecules are shown in the form of a Periodic Table in Figure 9.1. These are the second entry in each block below the Ea for the atoms [1–3]. The specific references for these data are given in Appendix I, where the Ea of the homonuclear diatomic molecules are listed. The values for the rare gases are 0þ because they only result from the polarization attractions of the dimers.
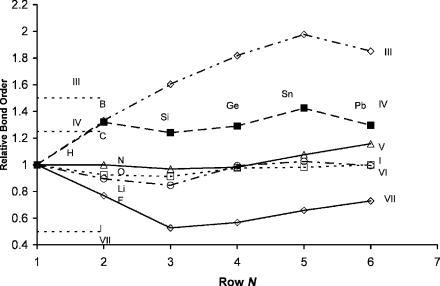
The Ea of the main group homonuclear diatomic molecules are consistent with molecular orbital predictions of the bond order: BO ¼ DeðX2ð ÞÞ=DeðX2Þ ¼ the net number of bonding electrons in the ion divided by that of the neutral, as shown in Figure 9.2. The Group I and VII dimers have two net bonding electrons in the neutral and one in the anion such that the predicted bond order is 0.5. The experimental values range from 0.55 to about 1.0. The predicted bond order for Groups III and IV are 1.5 and 1.25, but the experimental values are larger. The change in the bond
dissociation |
energy |
DeðX2Þ DeðX2ð ÞÞ |
is approximately |
given by |
EaðX2Þ |
EaðXÞ and |
obtained |
by subtracting the |
first two entries |
in each |
block in |
Figure 9.1. The largest increase in dissociation energy for the ground state is for C2( ), 3.273 1.261 ¼ 2.012 eV, while the largest decrease occurs for Cl2( ), 2.45 3.6127 ¼ 1.16 eV.
DIATOMIC MOLECULES |
195 |
Figure 9.1 Electron affinities of the elements, electron affinities, and bond dissociation energies of the homonuclear diatomic molecules in the form of a Periodic Table [1].
The bond order is BO ¼ 1 þ ½DeðX2Þ DeðX2ð ÞÞ&=DeðX2Þ ¼ 1 þ ½EaðX2Þ
EaðXÞ&=DeðX2Þ. This is obtained from the data in Figure 9.1 by adding 1 to the difference in the electron affinities divided by the bond dissociation energy given as the third entry for each element. For C2 BO ¼ 1 þ 2/6.3 ¼ 1.32; for Cl2 BO ¼ 1 1.16/2.56 ¼ 0.55. The value for the rare gases is 1. The bond orders for the Group IA and VIA elements approach 1 going down the table. The values for the Group IIIA and IVA elements are all above unity and increase down the table. The bond orders for the Group VA elements go from less than 1 to greater than 1 from P to Bi. The vertical trends can be observed in Figure 9.2. The smooth
196 DIATOMIC AND TRIATOMIC MOLECULES AND SULFUR FLUORIDES
Figure 9.2 Bond energies of the homonuclear diatomic anions divided by bond energies of the neutral versus the row number. This illustrates the consistency of the values for a given family, from Figure 9.1.
changes down the Periodic Table support the assignments of the AEa of the main group elements.
The horizontal trends in the bond order are shown in Figure 9.3, where the relative bond orders are plotted against the atomic number. The values for the 3d homonuclear diatomic molecules are a combination of experimental and theoretical values. The bond dissociation energies for the anions are calculated from the average of the density functional electron affinities for the elements where experimental data are not available. The values for the 4d and 5d elements should follow the same trend as for the 3d elements and are shown with dotted lines. The relative bond orders not determined experimentally are set to unity to plot the complete graph. The extreme values are identified. The values for O2 and Pb2 are pointed out to illustrate their consistency with the periodic trends. For Pb the BO ¼ 1 þ 0.27/0.91 ¼ 1.30 and supports the assignment of the 1.10(5) eV value for the AEa of Pb. For the lower atomic Ea of Pb with a value of 0.364(8) eV
the bond order |
is |
1 þ 1/0.9 ¼ 2.11, which would be the largest |
value |
in the |
graph. For O2 |
the |
BO ¼ 1 0.39/5.2 ¼ 0.92, consistent with the |
other |
Group |
VIA elements. If the lower electron affinity of O2 was used, the bond order would be lower than Li2 and slightly higher than the value for F2. The horizontal trends also support the assignments for the AEa of the main group diatomic anions and elements made in Chapter 8. These are the major support for the assignment of the experimental Ea of the homonuclear diatomic molecules to the AEa. The horizontal trend in the relative bond orders for 3d homonuclear diatomic anions and
