

Chen The electron capture detector
.pdfELECTRON AFFINITIES AND CHARGE TRANSFER COMPLEX ENERGIES |
67 |
|||||
TABLE 4.4 Electron Affinities, Ionization Potentials, and |
|
|
|
|||
Electronegativity of Aromatic Hydrocarbons (in eV) |
|
|
|
|
||
|
|
|
|
|
|
|
Species |
ECD/TCT |
2EN-IP |
IP |
EN |
|
|
|
|
|
|
|
|
|
Anthracene |
0.68(2) |
0.68 |
7.40 |
4.04 |
|
|
Tetracene |
1.08(2) |
1.11 |
6.97 |
4.04 |
|
|
Pentacene |
1.39(5) |
1.47 |
6.61 |
4.04 |
|
|
Phenanthrene |
0.30(2) |
0.22 |
7.86 |
4.04 |
|
|
Benz[a]anthracene |
0.72(2) |
0.65 |
7.43 |
4.04 |
|
|
Triphenylene |
0.29(2) |
0.24 |
7.84 |
4.04 |
|
|
Dibenz[a,h]anthracene |
0.69(3) |
0.78 |
7.30 |
4.04 |
|
|
Chrysene |
0.42(4) |
0.57 |
7.59 |
4.04 |
|
|
Benz[c]phenanthrene |
0.58(1) |
0.48 |
7.60 |
4.04 |
|
|
Picene |
0.54(3) |
0.54 |
[7.5] |
4.04 |
|
|
Pyrene |
0.61(2) |
0.67 |
7.41 |
4.04 |
|
|
Perylene |
0.98(1) |
1.16 |
6.92 |
4.04 |
|
|
Benz[a]pyrene |
0.82(4) |
0.96 |
7.12 |
4.04 |
|
|
Fluoranthene |
0.82(4) |
— |
7.95 |
4.38 |
|
|
Biphenyl |
0.13(2) |
0.13 |
7.95 |
4.04 |
|
|
Styrene |
0.10(5) |
— |
8.43 |
4.27 |
|
|
Azulene |
0.84(5) |
— |
7.41 |
4.13 |
|
|
Coronene |
— |
0.79 |
7.29 |
4.04 |
|
|
|
|
|
|
|
|
|
It was possible to obtain better resolution for these compounds because there are three independent experimental methods for estimating the electron affinities that could be iterated to consistency. These were the ECD measurements, half-wave reduction potential measurements, and electronegativity values. In addition, these electron affinities had been calculated with the MINDO/3 procedure. We also calculated the values using the CURES-EC procedure and obtained estimates of the charge densities. These procedures were extended to a larger set of 80 compounds, some without gas phase Ea that will be discussed in Chapter 10.
4.7 ELECTRON AFFINITIES AND CHARGE TRANSFER COMPLEX ENERGIES
The theory of charge transfer complexes relates the maximum in the absorption spectrum, the charge transfer energies ECT , and energies for complex formationGCT to the vertical ionization potential of the donor and the vertical electron affinities of the acceptor. The relationship uses constants related to the geometry of the complexes. Mulliken described the theory of charge transfer as follows:
The basic idea is the qualitatively familiar one that any two bits of matter, whether they are atoms, or positive or negative ions, or molecules or even solids have a
68 THEORETICAL BASIS OF THE EXPERIMENTAL TOOLS
tendency to exchange electrons. Quantum mechanically the interaction may be formulated by saying that when any two such entities get together their joint or combined wave function may be expressed as:
c ¼ acðD; A þ bcðDþ; A Þ |
ð4:25Þ |
Sometimes, the donor and acceptor are nearly equal in strength and a b. For the strengths, one must not use the adiabatic ionization potential and (adiabatic) electron affinity (AEa) corresponding to the passage of D with its natural skeleton to D with its natural skeleton or from A with its natural shape to A( ) in its natural shape; instead, one must take the so-called vertical values of IP (VIP) and Ea (VEa) corresponding to no change in skeleton. Moreover, one must take VIP and VEa for such deformed skeletons for both D and A as in the final compromise skeleton of the complex. . . .
Values of Ea and especially VEa are less available. [28]
The energy for the formation of a charge transfer complex is related to the VIP and VEa of the donor. To examine this relationship for the aromatic hydrocarbons with the measured electron affinities, the energies of complexes of methylbenzenes as the donors and aromatic hydrocarbons as the acceptors were determined. The charge transfer bands for these complexes were not observed [29]. Therefore, only the relation between the energy for complex formation and the VIP and VEa could be examined. The equation is
RT ln KCT ¼ C1 þ 1=ðVIP VEa C2Þ |
ð4:26Þ |
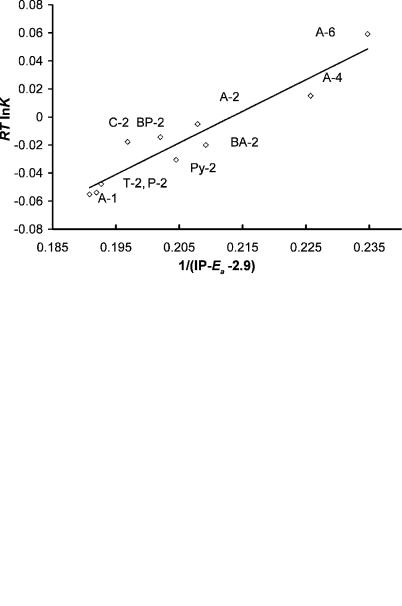
Figure 4.13 is a plot of the experimental data for a series of methylbenzenes with n ¼ 1 to 6 with the aromatic hydrocarbons anthracene, A; pyrene, Py; phenanthrene, P; chrysene, C; and triphenylene, T; versus 0.1/ðIP Ea C2Þ with the least-squares value of C2 ¼ 2:90 0:10 eV. If we consider the narrow range of values for these complexes, the correlation is quite good.
The maximum energy of the charge transfer transition is given by
ECT ¼ VIP VEa C2 þ C1=ðVIP VEa C2Þ |
ð4:27Þ |
For a series of acceptors with a given donor, C2 VEa is constant so that a plot of ECT versus the VIP will be represented by the above equation. In some cases this is approximately linear, so that given an experimental value for ECT , the IP can be determined from the linear plot. This implies that the C1 value is small. Plots for a series of donors with different acceptors are given in Figure 4.14. The horizontal displacement of the curves is due to the differences in the VEa. Similarly, a plot of ECT for a given donor with various acceptors can be used to estimate the electron affinity. Thus, given the VIP, ECT , and C2, the Ea can be calculated. If the data are scaled to the AEa so that the rearrangement energies are included in the C2 term, adiabatic electron affinities can be estimated. Table 4.5 gives the values of C1 and
ELECTRON AFFINITIES AND CHARGE TRANSFER COMPLEX ENERGIES |
69 |
Figure 4.13 Free energy for complex formation by methyl benzene and aromatic hydrocarbons is plotted versus 1/(IP Ea 2:90). The aromatic hydrocarbons are A, anthracene; BA, benzanthracene; C, chrysene; Py, pyrene; T, triphenylene; and P, phenanthrene. The numbers refer to the number of methyl groups on benzene. Toluene is 1, while s-tetramethylbenzene is 4. Original data from [29].
Figure 4.14 Energy for the maximum absorbance for charge transfer complexes of s-trinitrobenzene, tetracyanoethylene, and chloranil with various donors plotted against the adiabatic ionization potential of the donor. Recent ionization potentials from the NIST tables were used. The vertical displacement results from the differences in the Ea of the molecules. The calculated curves were obtained by using a two-parameter nonlinear least squares. The values of the constants are given in Table 4.5, where they are compared with published values. Data from [8, 30, 32].

70 THEORETICAL BASIS OF THE EXPERIMENTAL TOOLS
TABLE 4.5 Charge Transfer Complex Constants C1 and C2 for equation 4.27 (in eV)
|
C2 |
C1 |
|
sC1C2 |
C2 |
C1 |
Species |
This Work |
|
|
[32] |
|
|
|
|
|
|
|
|
|
Tetracyanoethylene |
5.86(11) |
0.31(23) |
0.026 |
6.10 |
0.54 |
|
Tetracyanoquinodimethane |
5.81(15) |
0.06(27) |
0.037 |
— |
— |
|
Chloranil |
5.71(8) |
0.63(15) |
0.010 |
5.70 |
0.44 |
|
s-Trinitrobenzene |
5.36(7) |
1.55(21) |
0.015 |
5.00 |
0.70 |
|
Trinitrofluorenone |
5.34(8) |
0.60(.20) |
0.015 |
— |
— |
|
Benzoquinone |
4.91(30) |
0.0(15) |
0.26 |
— |
— |
|
Iodine |
4.61(18) |
0.26(18) |
0.11 |
5.20 |
1.50 |
|
Tetrachlorophthalic anhydride |
4.60(4) |
0.15(20) |
0.01 |
4.9 |
— |
|
Maleic anhydride |
4.43(3) |
0.55(13) |
0.04 |
4.4 |
— |
|
C2 determined for acceptors using a nonlinear least-squares fit to equation 4.27 and data compiled by Briegleb [32]. These constants are compared to similar values given by Briegleb.
In 1975 when more reliable electron affinities for the reference compounds were available, a large number of calculated Ea were published. Since organic acceptors
Figure 4.15 Electron affinities of charge transfer complex acceptors calculated from C2 ¼ 2:9 versus the current ‘‘best’’ adiabatic electron affinities. This is a precision and accuracy plot. The zero intercept slope indicates that the same quantities are measured. The compounds are maleic anhydride, tetrachlorophthalic anhydride, benzoquinone, trinitroflourenone, s-trinitrobenzene, chloranil, tetracyanoquinodimethane, and tetracyanoethylene in order of their electron affinities.
SUMMARY 71
typically contain electronegative elements such as N, O, and the halogen atoms, this offers an additional method for estimating the substitution and replacement effects. In Figure 4.15 the Ea calculated from AEa ¼ C2 2:9 eV (using the C2 given in Table 4.5) are plotted against the current best adiabatic values. The deviations are within the experimental errors and the slope is approximately 1. The Ea are adiabatic values since the data have been scaled to adiabatic Ea [29–31]. Based on the values of C2, the AEa of trinitrofluorenone is 2.4 0.1 eV, while that of tetrachlorophthalic anhydride is 1.7 0.1 eV. These values have not been measured in the gas phase. The electron affinity of phthalic anhydride is 1.25 eV and the addition of four Cl atoms could easily raise the Ea to 1.7 eV. The electron affinity of fluorenone has not been measured.
4.8SUMMARY
Molecules studied in the ECD can be grouped into three classes. If the EDEA is less than about 35 kcal/mole ( 1.5 eV), the compounds fall under group Eql(1/1) (equilibrium 1 with one temperature region). Molecules with two states and two regions are designated Eql(2/2). For the Eql(1/1) group the VEa and AEa can be positive. For molecules in group DEC(1) (dissociative electron capture, unimolecular) the EDEA is positive, and for molecules in group DEC(2) (dissociative electron capture, unimolecular) it is an intermediate value.
Compounds such as tetramethylbenzene, phenanthrene, chrysene, acetophenone, and benzaldehyde belong to group Eql(1/1) since only the a region is observed in the temperature region. Compounds that exhibit both a and b regions, such as nitrobenzene, pentafluoronitrobenzene, and acetonaphthone, belong to group Eql(1/2). Since thermal electron reactions with C6Cl6, C6F6, and CS2 involve two lowlying bound negative-ion states, they belong to group Eql(2/2). The chloromethanes are classified under group DEC(1) since thermal electron attachment is exothermic. The C6HnCl6 n for n ¼ 1 to 4 are in group DEC(2) since the reaction of thermal electrons leads to dissociation via an intermediate molecular ion and all four temperature regions may be observed.
Examples of the temperature dependence for different classes of molecules are given as global plots of ln KT3/2 versus 1;000=T. The curves that are drawn used the
equations for the complete model. Excited-state Ea have been measured with the ECD. The clearest indication of an excited state is structure in the data, as illustrated for carbon disulfide and C6F6. The temperature dependence of the ions formed in NIMS of the chloroethylenes indicate multiple states. NIMS also supports AEa, as in the case of SF6 and nitrobenzene. The quantity D Ea can be obtained from ECD data for DEC(2) dissociative thermal electron attachment. If one is measured, then the other can be determined. In the case of the chlorinated benzenes this quantity gives the C Cl bond dissociation energy. The highest activation energy of 2.0 eV has been observed for the dissociation of the anion of o-fluoronitrobenzene.
72 THEORETICAL BASIS OF THE EXPERIMENTAL TOOLS
For compounds with positive slopes in a plot of ln KT3/2 versus 1;000=T with an intercept in the region of 11.7 3, a nondissociative mechanism is indicated. The slope is Ea=R. At lower temperatures, Eql(1/1), the data could level off with an intercept in the region of 34 3. The slope will be E1=R and the intercept ln [A1=2AD], Eql(1/2). The maximum value of A1 is determined by the DeBroglie
wavelength of the electron and the stabilization term Z. The value of A1 when Z ¼ 1 is 5 1015 K 1/2-l-mole 1, which gives ln ðA1Þ ¼ 36. Excited states could
exist at lower temperatures, Eql(2/2).
For compounds that dissociate unimolecularly, DEC(1), the slope will be negative and the intercept will fall in the region 34 3. The slope is E1=R and the intercept ln[A1=2AD]. The magnitude of E1 is a function of the D Ea for the molecule. In the case of CCl4 and CH3I the E1 are approximately zero. For CH3Cl, the activation energy is greater than 0.5 eV and there is a large increase in K with increasing temperature. For some DEC(1) molecules an excited-state molecular ion is formed with a low electron affinity.
For compounds that dissociate via an intermediate negative ion, DEC(2), a change in slope from positive to negative will occur at higher temperatures. This indicates the opening up of the dissociative pathway for the loss of ions in competition with recombination but lower than detachment. The lower-temperature portion will be the same as for the formation of a stable negative ion. At a higher temperature the negative slope will be equal to D Ea. In this case there are six parameters, one pre-exponential, and one exponential (energy) parameter for each of k1, k 1, and k2. In order to observe this type of behavior, the A2 must be large. Thus, the intercepts in the high-temperature region will be ln{A1A2=2A 1AN } and can rise as high as 45. At still higher temperatures the dissociation overwhelms detachment and K will be k1/2kD, as in the low-temperature case.
The kinetic model for the determination of the energies of complex formation was described. Examples of negative-ion mass spectrometry data for the monoand di-hydrates of O2( ) were given, and typical plots of the equilibrium constants for the 0-1 and 6-7 complexes were presented. Once the equilibrium constants are determined, the equations used to obtain the entropy and energy for the consecutive reactions become the standard.
The basic equations for the calculation of electron affinities from half-wave reduction potentials in aprotic solvents were presented. More accurate values of the Ea of organic molecules can be obtained by using variable-solution energy differences. The electronegativity concepts and CURES-EC calculations support the use of these modified equations. Equations relating the free energy of charge transfer complex formation to the electron affinity of the acceptor and ionization potential of the donor were summarized. Complexes with aromatic hydrocarbons as acceptors and methylbenzenes as donors were used as an example. The good correlation of the complex formation energy supports the Ea of the aromatic hydrocarbon acceptors. The maximum energy in the new absorption band for charge transfer complexes for trinitrobenzene, tetracyanoethylene, and other acceptors was related to the ionization potentials of the donor and the electron affinities of the acceptors. By using adiabatic, rather than vertical Ea, the
REFERENCES 73
rearrangement energy is automatically included in the correlation terms. Given additional ECT data, the adiabatic Ea can be obtained. The Ea of trinitrofluorenone (2.5 0.1 eV) and tetrachlorophthalic anhydride (1.7 0.1 eV) were determined in this manner.
REFERENCES
1.Chen, E. C. M.; Carr, S. D.; Wentworth, W. E.; and Chen, E. S. D. J. Chromatogr. A 1998, 827, 91.
2.Chen, E. C. M.; Wentworth, W. E.; and Lovelock, J. E. J. Phys. Chem. 1966, 70, 445.
3.Ruoff, R. S.; Kadish, K. M.; and Chen, E. C. M. J. Phys. Chem. 1995, 99, 8843.
4.Chen, E. C. M. and Wentworth, W. E. J. Phys. Chem. 1983, 87, 45.
5.Wojnarvits, L. and Foldiak, G. J. Chromatogr. 1981, 206, 511.
6.Crocker, L.; Wang, T. B.; and Kebarle, P. J. Amer. Chem. Soc. 1993, 115, 7818.
7.Scheidt, J. and Weinkauf, R. Chem. Phys. Lett. 1997, 266, 201.
8.Chen, E. C. M. Ph.D. dissertation, Universtiy of Houston, 1967.
9.Chen, E. C. M. and Wentworth, W. E. Mol. Cryst. Liq. Cryst. 1989, 171, 271.
10.Chen, E. S. D.; Chen, E. C. M.; Sane, N.; Talley, L.; Kozanecki, N.; and Shultze, S. J. Chem. Phys. 1999, 110, 9319.
11.Chen, E. C. M. and Chen, E. S. D. J. Chromatogr. A 2002, 952, 173.
12.National Institute of Standards and Technology (NIST). Chemistry WebBook, 2003. Available at http://webbook.nist.gov.
13.Lyons, L. E.; Morris, G. C.; and Warren, L. J. J. Phys. Chem. 1968, 72, 3677.
14.Wiley, J. R.; Chen, E. C. M.; and Wentworth, W. E. J. Phys. Chem. 1993, 97, 1256.
15.Wentworth, W. E.; Limero, T.; Batten, C. F.; and D’sa, E. D. J. Chem. Phys. 1988, 88, 4711.
16.D’sa, E. D. Ph.D. dissertation, University of Houston, 1987.
17.Wentworth, W. E.; Becker, R. S.; and Tung, R. J. Phys. Chem. 1967, 71, 1652.
18.Wentworth, W. E.; George, R.; and Keith, H. J. Chem. Phys. 1969, 51, 1791.
19.Steelhammer, J. C. and Wentworth, W. E. J. Chem. Phys. 1969, 51, 1802.
20.Chen, E. C. M.; Albyns, K.; Dussak, L.; and Wentworth, W. E. J. Phys. Chem. 1989, 93, 6827.
21.Page, F. M. and Goode, G. C. Negative Ions and the Magnetron. New York: WileyInterscience 1969.
22.Ervin, K. M.; Ramond, T. M.; Davico, G. E.; Schwartz, R. L.; Casey, S.M.; and Lineberger, W. C. J. Phys. Chem. A 2001, 105, 10822.
23.Chen, E. S. D.; Chen, E. C. M.; and Wentworth, W. E. J. Phys. Chem. 1991, 95, 520.
24.Han, C. C. and Brauman, J. I. J. Phys. Chem. 1990, 94, 3415.
25.Chen, E. S. D.; Chen, E. C. M. Sane, N.; and Shulze, S. Bioelectrochem. Bioenerget. 1999, 48, 69.
26.Dewar, M. J. S.; Hashmall, J. A.; and Trinajstic, N. J. Amer. Chem. Soc. 1970, 92, 5555.
74THEORETICAL BASIS OF THE EXPERIMENTAL TOOLS
27.Christodoulides, A. A.; McCorkle, D. L.; and Christophorou, L. G. ‘‘Electron Affinities of Atoms, Molecules and Radicals’’ in Electron-Molecule Interactions and Their Applications. New York: Academic Press, 1984.
28.Mulliken, R. S. and Person, W. B. Molecular Complexes, a Lecture and Reprint Volume. New York: Wiley, 1969.
29.Chen, E. C. M. and Wentworth, W. E. J. Phys. Chem. 1963, 67, 2201.
30.Chen, E. C. M. and Becker, R. S. J. Chem. Phys. 1966, 45, 2403.
31.Briegleb, G. Angew. Chem. Internat. Edit. 1964, 3, 617.
32.Briegleb, G. Elektronen Donator Acceptor Komplexe. Berlin: Springer-Verlag, 1961.

 CHAPTER 5
Experimental Procedures and
Data Reduction
5.1INTRODUCTION
All electron affinities are of course relatively small (perhaps mostly 1–3 eV). From chemical behavior and stability of molecular complexes, we may reach some qualitatively conclusions about relative electron affinities. . . . Quantitative methods for determining molecular electron affinities are not very well developed but there seem to be possibilities for the future.
—Robert Sanderson Mulliken
Molecular Complexes, a Lecture and Reprint Volume
In this chapter the experimental ECD and NIMS procedures for studying the reactions of thermal electrons with molecules and negative ions are described. Gas phase electron affinities and rate constants for thermal electron attachment, electron detachment, anion dissociation, and bond dissociation energies are obtained from ECD and NIMS data. Techniques to test the validity of specific equipment and to identify problems are included. Examples of the data reduction procedure and a method to include other estimates of quantities and their uncertainties in a nonlinear least-squares analysis will be given. The nonlinear least-squares procedure for a simple two-parameter two-variable case is presented in the appendix.
The procedures for the measurement of reduction potentials are described in original articles and will not be repeated here. Carefully dried aprotic solvents must be used and measurements are referenced to the same electrode. Once it is established that the process is reversible, the data can be used to obtain Ea [1].
Both the GC/ECD and GC/NICI instruments commonly analyze compounds that form negative ions such as pesticides and polychlorinated biphenyls, making devices to carry out the study of thermal electron attachment reactions commercially available. These include the radioactive and nonradioactive ECD,
The Electron Capture Detector and the Study of Reactions with Thermal Electrons by E. C. M. Chen and E. S. D. Chen
ISBN 0-471-32622-4 # 2004 John Wiley & Sons, Inc.
75
76 EXPERIMENTAL PROCEDURES AND DATA REDUCTION
atmospheric pressure ionization sources, methane thermal electron chemical ionization sources, an electron monochrometer source for GC/NIMS, and the ion mobility spectrometers. The GC/NIMS and ion mobility spectrometers have not been used extensively to measure fundamental properties. However, such information can be obtained by measuring responses as a function of temperature [2].
The ECD used to establish the kinetic model was custom-built. Affordable commercial ECD and negative-ion gas chromatograph chemical ionization mass spectrometers are now available. Thus in order for an investigator to use these techniques, it is simply a matter of calibrating the instrument by reproducing the experimental results to verify that no artifacts result from the equipment. The major work described in this book was conducted with the radioactive ECD. The mechanisms for the pulsed discharge electron capture detector are the same as with the radioactive ECD that is now commercially available [4]. We have used commercial detectors and a quadrupole mass spectrometer with a home-made data collection system to determine electron affinities and to study the complexes of negative ions [5–9].
In many cases the mere observation of a parent negative ion in mass spectrometry or ion mobility spectrometry is evidence of the positive electron affinity of a molecule. The ECD kinetic model is applicable to the ions observed in NICI experiments so the same quantities measured in the ECD can also be measured with this technique. There is a large body of NIMS data taken at two temperatures for compounds significant to those used in environmental chemistry that can be analyzed to obtain approximate electron affinities and activation energies [10].
5.2EXPERIMENTAL ECD AND NICI PROCEDURES
The objective of the ECD and NIMS experiments is to measure the molar response of different compounds as a function of temperature. From these data the fundamental kinetic and thermodynamic properties of the reaction of thermal electrons with molecules and negative ions can be determined. The measurement is carried out in the same manner as the calibration of any detector. Known amounts of a compound are injected into the chromatograph and purified on a column, they then enter the detector. The response of the detector is normalized to the number of moles injected. When obtaining physical parameters, the detector temperature is changed and the procedure repeated. Since the molar response can vary by three to four orders of magnitude, the concentrations of the test molecule and the conditions in the detector at different temperatures must be taken into account.
Once an ECD/GC or NIMS has been obtained, its suitability for the determination of fundamental properties can be examined by measuring the temperature dependence of the response for standard compounds. Although strictly speaking, it would only be necessary to measure the temperature dependence of three com- pounds—CCl4, acetophenone, and CH2Cl2—to obtain AD and AN , other compounds should also be studied. In addition, is valuable to determine the temperature