Chen The electron capture detector
.pdf
 CHAPTER 4
Theoretical Basis of the
Experimental Tools
4.1INTRODUCTION
Research is seeing what others have seen and thinking what nobody has thought. —Commonly attributed to Albert Syent Gyorgi
The equations used in our study of the thermodynamics and kinetics of thermal electron reactions using the ECD and NIMS are presented. The ECD and NIMS methods were developed in our laboratories. These are used to determine the rate constants, electron affinities, partition function ratios, and bond dissociation energies of molecules and energies for the formation of complexes of anions. The general kinetic model for the ECD and negative-ion mass spectrometry is presented. Molecules will be classified using example data.
The electron affinities of many of the molecules determined in the ECD or NIMS have been verified by half-wave reduction potentials and charge transfer complex data. These methods were developed in the 1960s but have been significantly improved. The relationship between the electronegativity and the electron affinities and ionization potentials for aromatic hydrocarbons can be used to support the Ea. The use of the ECD model and these techniques to estimate the electron affinities of aromatic hydrocarbons are illustrated for selected compounds. We will also describe the use of charge transfer complex data to obtain the electron affinities of acceptors.
4.2THE KINETIC MODEL OF THE ECD AND NIMS
The reactions in the ECD and in NIMS were given in Chapter 2 as equations 2.1 to 2.6. They involve electron attachment and detachment, unimolecular dissociative
The Electron Capture Detector and the Study of Reactions with Thermal Electrons by E. C. M. Chen and E. S. D. Chen
ISBN 0-471-32622-4 # 2004 John Wiley & Sons, Inc.
47
48 THEORETICAL BASIS OF THE EXPERIMENTAL TOOLS
electron attachment, and sequential dissociation. These reactions are combined with a constant source of electrons to define the kinetic model. When the standard kinetic expressions are written for these reactions and steady state applied to the negative ions and electrons, an expression for the ECD response can be obtained. This is illustrated as follows:
kP |
|
ð4:1Þ |
R ) eð Þ þ P |
|
|
kD0 |
|
ð2:5Þ |
eð Þ þ P ! Neutrals |
|
|
kN0 |
|
ð2:6Þ |
AB þ P ! Neutrals |
|
|
k1 |
ð2:1 and 2:2Þ |
|
eð Þ þ AB ,k 1 ABð Þ |
||
|
|
|
k2 |
|
ð2:4Þ |
ABð Þ ! A þ Bð Þ |
|
|
kN0 |
|
ð2:6Þ |
Bð Þ þ P ! Neutrals |
|
|
In the absence of AB |
|
|
d½e&=dt ¼ kp kD0 ½P&½e& ¼ 0 |
|
ð4:2Þ |
Ib ¼ kp=fkD0 ½P&g |
|
ð4:3Þ |
In the presence of AB |
|
|
d½e&=dt ¼ kp kD0 ½P&½e& k1½AB&½e& þ k 1fAB & ¼ 0 |
|
ð4:4Þ |
d½AB &=dt ¼ k1½AB&½e& ðk 1 þ k2Þ½AB & kN0 ½P&½AB & ¼ 0 |
ð4:5Þ |
|
d½B &=dt ¼ k2½AB & kN0 ½P&½B & ¼ 0 |
|
ð4:6Þ |
Solving simultaneously and setting kD0 ½P& ¼ kD and kN0 ½P& ¼ kN , we get |
|
|
Ie ¼ kpðk 1 þ kN Þ=ðkD þ k1kN ½AB&Þ |
|
ð4:7Þ |
For low fractional capture |
|
|
ðIb IeÞ=Ie ¼ k1ðkN þ k2Þ½AB&=2ðk 1 þ kN þ k2ÞkD |
|
ð4:8Þ |
KECD ¼ k1ðkN þ k2Þ=2ðk 1 þ kN þ k2ÞkD |
|
ð4:9Þ |
The values of some of the rate constants may be small because of energetic considerations. The original model considered only electron attachment to a single negative-ion state. With more than one state the ECD response is given by a sum of terms if we assume no interconversion of states. In the remainder of the book the subscript ECD will be dropped for convenience.

|
|
|
THE KINETIC MODEL OF THE ECD AND NIMS |
|
49 |
|||||||||
The response equation is |
|
|
|
|
|
|
|
|
|
|
|
|
|
|
K |
|
2 |
|
k ð |
k1i |
kN þ k2iÞ |
|
|
|
4:10 |
|
|||
|
|
|
|
k |
|
|
||||||||
|
¼ X |
ð |
|
kÞð |
k |
N þ |
ð |
|
Þ |
|||||
|
|
DÞð |
|
i1 þ |
|
|
2iÞ |
|
||||||
i ¼ 1 to n |
|
|
|
|
|
|
|
|
|
|
|
|
||
For multiple states the expression is expanded. The value of k1 can refer to direct dissociation, previously designated k12 or non-dissociative capture.
Four regions are observed in the nominal temperature range accessible to NIMS and ECD combined with chromatography. These are defined based on the relative values of the rate constants. From low (298 K) to high temperatures (600 K) these are:
1.The b region, where (kN k 1 þ k2) and K ¼ k1=2kD
2.The a region, where (k 1 kN þ k2) and K ¼ ½kN =2kD&½k1=k 1]
3.The g region, where (k2 kN ) and (k 1 k2) and K ¼ ½k1k2=2kDk 1]
4.The d region, where (k2 k 1 þ kN ) and K ¼ k1=2kD
Using these approximations and limiting values of equation 4.10, we obtain the fundamental kinetic and thermodynamic properties of the thermal electron reactions from ECD or NIMS data. In the a region the molecular electron affinity Ea and partition function ratio Qan are measured. In the b region and d region A1 and E1 are obtained, and in the g region A2 and E2 are determined. Often the ECD gives data that overlap these regions so that nonlinear least-squares procedures are used. From equation 4.10 and the kinetic expressions an equation for least-squares analysis can be obtained:
kN ¼ AN ¼ constant ðthis can be estimated for a given systemÞ
kD ¼ AD ¼ constant ðthis can be estimated for a given systemÞ
k1 ¼ A1T 1=2 expð E1=RTÞ
k 1 ¼ A 1T expð E 1=RTÞ
k2 ¼ A2T expð E2=RTÞ
In the case of a single state, there are six parameters, two each for three rate constants k1, k 1, and k2. The least-squares equation is
K |
¼ |
A1T 1=2 expð E1=RTÞfAN þ A2T expð E2=RTÞg |
ð |
4:11 |
Þ |
|
2AD½AN þ A 1T expð E 1=RTÞ þ A2T expð E2=RTÞ& |
||||||
|
|
The data can exhibit a, b, g, and d regions in a sufficiently large temperature range. In the event that two or more states are involved, there will be additional terms as indicated in equation 4.10. For two states there will be 12 parameters, two each for
50 THEORETICAL BASIS OF THE EXPERIMENTAL TOOLS
the six rate constants. We have not encountered a case in which all 12 parameters can be determined from ECD data. The most that we have determined is eight for the nondissociative two-state case (e.g., CS2) or six for the dissociative single-state case (e.g., CH3NO2). We will now consider the limiting cases for the ECD model beginning with nondissociative electron capture [1].
4.3NONDISSOCIATIVE ELECTRON CAPTURE
In the event that [DðABÞ EaðBÞ > 1:5 eV], the value of k2 will be small and the data can exhibit both an a and a b region. At most, four parameters will be determined. In some cases only a single slope and intercept are observed. We obtain the absolute electron affinity from the slope in the a region:
K ¼ ½kN =2kD&½k1=k 1& ¼ ½kN =2kD&½A1 |
=A 1&T 3=2fexpðEa=RTÞg |
ð4:12Þ |
ln KT3=2 ¼ lnðAN =2ADÞ þ lnðA1=A 1Þ þ Ea=RT |
ð4:13Þ |
|
From equation 4.13 the slope in a plot of ln KT3=2 versus 1,000=T is Ea=R. The intercept is ln ðAN =2ADÞ þ lnðA1=A 1Þ. The statistical mechanical expression for k1=k 1 ¼ Keq for the reaction of thermal electrons gives
ð |
A |
=A |
1Þ ¼ ½ |
g |
A |
=g |
A h3 |
= |
2 |
p |
m |
k |
Þ |
3=2 |
ð |
4:14 |
Þ |
1 |
|
ð |
Þ |
ð |
Þ& |
ð |
|
e |
|
|
|
The g’s are partition functions, k and h, the Boltzmann and Planck constants, and me, the electron mass.
From this equation lnð½gðA Þ=gðAÞ&Þ ¼ lnðA1=A 1Þ 12:43 lnðAN =2ADÞ. The value of 12.43 is obtained from fundamental constants. This involves the ratio of (AN =2AD) so that the concentration of the positive species and the temperature dependence of the intrinsic rate constants will cancel out and not affect the value of the slope. With an experimental intercept and lnðAN =2ADÞ, a value for Qan, the partition function ratio Qan ¼ ½gðA Þ=gðAÞ&Þ, can be calculated. The observed Qan values range from 1 to 10 4. The ECD and NIMS experiments are the primary source of Qan in the literature. A value of AN =2AD can be obtained by measuring the ECD temperature dependence of a compound with an accurate Ea and a unit partition function ratio such as acetophenone. A unit value of Qan implies that the negative ion and neutral have the same partition functions except for spin multiplicity. Thus, equation 4.13 becomes
ln KT3=2 ¼ lnðAN =2ADÞ þ 12:43 þ lnðQanÞ þ Ea=RT |
ð4:13bÞ |
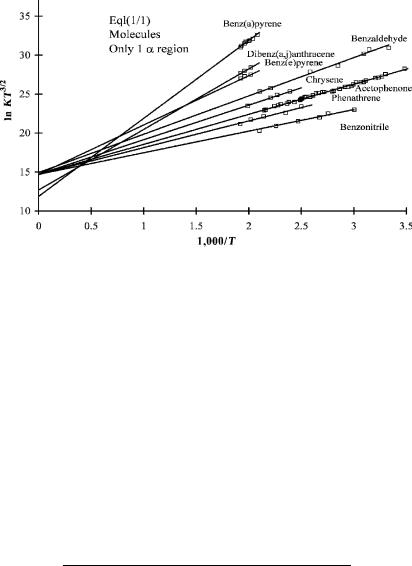
In Figure 4.1 a plot of ln KT3=2 for acetophenone and several compounds that exhibit only an a region is given. Table 4.1 provides the values of Ea and Qan. The data for Figure 4.1 were obtained using a parallel plate detector at the ‘‘long’’ reaction time of 1,000 msec. The compounds are classified as Eql(1/1) since there is only one

NONDISSOCIATIVE ELECTRON CAPTURE |
51 |
Figure 4.1 Linear plots of ECD data versus 1;000=T. The compounds exhibit only one a region and are designated Eql(1/1) for equilibrium compounds with one state and one region. The electron affinities are determined from the slope. The intercepts for all but dibenz(a,j)anthracene and benz(a)pyrene are the same, indicating that Qan is 1.0. Some of the parameters are given in Table 4.1. The range of electron affinities is 0.25 eV to 0.82 eV. Data from [2, 8, 30].
linear region. The Ea of benz[a]pyrene is about 0.80 eV and that for tetramethylbenzene is 0.1 eV. This is called a global plot because it shows the extrapolation outside of the region of the data to higher temperatures (lower 1,000/T). The intercepts for several aromatic hydrocarbons, acetophenone, and benzaldehyde are the same within the experimental error. For these compounds the Qan values are 1.
Some of the Eql(1/1) compounds are predicted to have a second region at lower temperatures. If one or two data points exist in the second region, the slope will be lower and the intercept higher than the average value. In the case of benz[e]pyrene the linear least-squares fit gives an intercept of 15.10 1.60, which is higher than
TABLE 4.1 ECD Parameters for Eql(1/1) Compounds
Species |
Q |
Ea (eV) |
Benzonitrile |
1.0 |
0.25(2) |
Phenanthrene |
1.0 |
0.305(7) |
Acetophenone |
1.0 |
0.338(2) |
Chrysene |
0.8 |
0.42(4) |
Benzaldehyde |
1.0 |
0.458(10) |
Benz{e}pyrene |
[1.0] |
0.534(10) |
Dibenz[a,j]anthracene |
0.2 |
0.68(10) |
Benz[a]pyrene |
0.1 |
0.83(10) |
|
|
|

52 THEORETICAL BASIS OF THE EXPERIMENTAL TOOLS
Figure 4.2 Plots of ECD data as ln KT3/2 versus 1;000=T. Nitrobenzene, pentafluoronitrobenzene, and 1-acetonaphthone exhibit both an a and a b region. They are designated Eql(1/2) for equilibrium compounds with one state and two regions. The electron affinities are determined from the slope in the a region. The intercepts for all but pentafluoronitrobenzene are the same, indicating that Qan is 1.0. The Qan for the latter is less than 1.0, the parameters are given in Table 4.1. The range of electron affinities is 0.16 eV to 1.50 eV. Data [1, 5, 8].
the average value of 14.7 0.05. Since the higher intercept would imply a Qan greater than unity and the uncertainty encompasses the average value, we fix the intercept and determine the slope from the average intercept with its error. In the case of dibenzanthracene and benz[a]pyrene the intercepts are lower than the average intercept and, therefore, the Qan is lower than unity.
Originally, it was assumed that the Qan should always be unity and that the electron affinity should be obtained from the ‘‘fixed’’ intercept. Other experimental determinations of the electron affinities for CS2, CH3NO2, tetracene, and benz[a]- pyrene demonstrate that Qan can be lower than 1. It is not expected that Qan is greater than 1 so the electron affinity is obtained by assuming it is 1, as in the case of benz[e]pyrene. If the intercept is lower than the average intercept, then the actual slope through the data should be used to obtain the electron affinity along with its associated errors [2–4].
In Figure 4.2 a and b regions are shown for nitrobenzene, pentafluoronitrobenzene, and acetonaphthone. These are designated Eql(1/2). They are compared to the Eql(1/1) molecules, naphthalene and acetophenone. Independent investigators using a ‘‘constant current’’ mode of electron collection obtained the data for naphthalene [5]. The data for the nitrocompounds were obtained in our laboratories
NONDISSOCIATIVE ELECTRON CAPTURE |
53 |
[1]. The maximum value of A1 for the reactions with thermal electrons is the DeBroglie A1 value (DeBA). The value of ln(DeBA) is about 36 at 400 K. The A1 value for C6F5NO2 is equal to the DeBA. The electron affinity of C6F5NO2 determined by thermal charge transfer experiments was used to obtain the calculated curve, and the data are then utilized to obtain the Qan value, which is less than 1. From Figure 4.2 we see that the A1 values for C6H5NO2 and acetonaphthone are lower than that for C6F5NO2. The parameters for these compounds are given in Table 4.1. The b regions are well defined for the nitrocompounds, but is less apparent for acetonaphthone. The Ea range from 0.16 eV to 1.5 eV [1, 4–7].
In the b region K ¼ k12kD and it is possible to obtain values for A1 and E1. We generally use a global plot where ln KT3/2 is plotted even though the actual expression has a different T dependence in the b region. The different values of A1 result from the fact that electron attachment is a two-step process that requires stabilization to the ground state. Thus at sufficiently high pressures or third-body concentrations, A1 will approach DeBA when the stabilization occurs on every collision. The stabilization term is analogous to the Z factor in traditional collision theories of kinetic rate constants. When the experimental A1 is less than DeBA, the value of Z is low, most notably for O2, COS, SO2, and NO2 [4].
For the two-state nondissociative case, where k2 ¼ 0, there are eight parameters to be determined, two each for the four rate constants k1, k 1, k1x, and k 1x. These are designated Eql(2/2) compounds. Each of the values of AN and AD is assumed to be equal for the ground and excited states. Two temperature extremes can be considered. At temperatures high enough to populate only the ground state, the region is called the ag region. At low enough temperatures to populate only the excited
state, it is called the ax region. Here the value of K is |
|
ln KT3=2 ¼ lnðAN =2ADÞ þ 12:43 þ lnðQaniÞ þ Eai=RT |
ð4:13bÞ |
where i represents either the ground or excited states. This is the same as equation 4.13, except it refers to either the ground state or excited state.
In going to lower temperatures from the ag region, there may be an apparent plateau, called the bg temperature region, followed by a rise with a slope corresponding to the excited-state electron affinity, the ax temperature region. At still lower temperatures another plateau region, the bx temperature region, is observed, where K ¼ ðk1 þ k1xÞ=ð2ADÞ. In this region the response will be relatively tempera- ture-independent when k1x is larger than k1. Thus, the four kinetic parameters for the rate constants k1 and k1x can be determined from the temperature dependence in the two b regions. The electron affinities and Qan values for the two states can be determined from the two a regions.
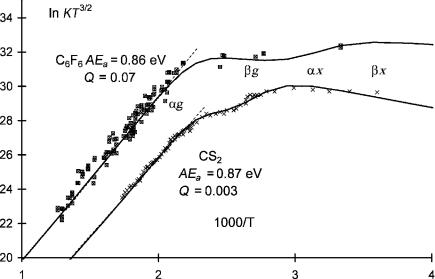
It was believed that the population of excited states in the ECD was quite rare, but it now appears more common. The first excited states observed in the ECD were for C6F6 and CS2. The data for these two compounds are shown in Figure 4.3. The structure is apparent in the data for CS2. There may be some fine structure in the data. This set of data for C6F6 is not as precise, but the lower-temperature data points are clearly higher than the higher-temperature points

54 THEORETICAL BASIS OF THE EXPERIMENTAL TOOLS
Figure 4.3 Plots of ECD data as ln KT3/2 versus 1;000=T. CS2 and C6F6 exhibit two a and two b regions. They are designated Eql(2/2) for equilibrium compounds with two states and two regions. The electron affinities are determined from the slope in the a regions. The ground-state Qan are much less than 1.0, the parameters are given in Table 4.2. Data from [1, 8, 15].
in the excited-state region. The curves were obtained from a least-squares analysis and include parameters determined in multiple ECD experiments and electron affinities determined from TCT and PES experiments. The Qan for these compounds are about 10 3 and are among the lowest values observed to date [1, 8, 9].
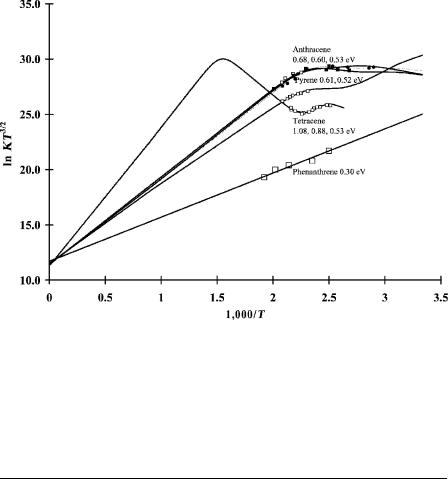
With the recognition of multiple states and the measurement of Qan less than unity, revisiting the electron affinities of the aromatic hydrocarbons originally reported in the 1960s became possible. This was done in 1998, 1999, and 2002 [3, 10, 11]. The National Institute of Standards and Testing (NIST) list of electron affinities for the aromatic hydrocarbons determined in the gas phase by various techniques has been evaluated [12]. Data for some of the aromatic hydrocarbons with revised Ea are shown in Figure 4.4. Several sets of anthracene data are shown. The data for phenanthrene are given for comparison. Table 4.2 provides the parameters for these molecules. The Qan for the excited state of tetracene is less than 1. The Ea of tetracene was reported to be 0.88 eV for many years based on the slope through the low-temperature data. This required a low value for the intercept. Such was not reported [13]. A higher Ea is definitively measured as 1.08 eV and the lower value is assigned to an excited state. In addition, a third state is postulated by analogy to anthracene and the existence of three distinct types of C H bonds in both anthracene and tetracene. Average values are given for the multiple sets of anthracene data [6, 7, 11–13].

NONDISSOCIATIVE ELECTRON CAPTURE |
55 |
Figure 4.4 Plots of ECD data as ln KT3/2 versus 1; 000=T. Anthracene and tetracene exhibit multiple a and b regions. They are designated Eql(n/2) for equilibrium compounds with n states and two regions. The curve for pyrene is shown with two states and two regions. The data for phenanthrene are given for comparison Table 4.2 lists the parameters. Data from [1, 11].
TABLE 4.2 ECD Parameters for Eql(2/n) Compounds
Species |
ln(A1) |
E1 (eV) |
Q |
Ea (eV) |
E 1ðeVÞ |
Hexafluorobenzene |
34.7(1) |
0.04(1) |
0.07(1) |
0.86(2) |
0.90(2) |
Hexafluorobenzene(ex) |
34.9(2) |
0.00(1) |
1.0(1) |
0.61(5) |
0.61(5) |
Carbon disulfide(bent) |
31.2(4) |
0.10(1) |
0.003(1) |
0.87(2) |
0.97(2) |
Carbon disulfide(linear) |
31.9(2) |
0.03(2) |
0.40(1) |
0.61(4) |
0.64(4) |
Tetracene |
37.0(1) |
0.95(5) |
1.0(1) |
1.10(4) |
2.05(4) |
Tetracene(ex) |
36.0(1) |
0.80(5) |
10 4 |
0.88(4) |
1.66(4) |
Tetracene(ex) |
36.0(1) |
0.65(5) |
1.0(1) |
0.53(4) |
1.18(4) |
Anthracene |
35.2(1) |
0.17(1) |
1.0(1) |
0.69(2) |
0.86(4) |
Anthracene(ex) |
35.2(1) |
0.10(5) |
0.9(1) |
0.60(2) |
0.70(2) |
Anthracene(ex) |
35.2(1) |
0.14(5) |
1.0(1) |
0.52(5) |
0.66(5) |
Pyrene |
35.1(1) |
0.26(1) |
0.7(1) |
0.61(2) |
0.87(4) |
Pyrene(ex) |
35.1(1) |
0.39(1) |
1.0(1) |
0.50(2) |
0.98(5) |
Naphthalene |
34.2(5) |
0.21(1) |
1.0(1) |
0.16(2) |
0.37(4) |
Naphthalene(ex) |
33.8(5) |
0.62(1) |
0.8(1) |
0.13(2) |
0.75(5) |
|
|
|
|
|
|

56 THEORETICAL BASIS OF THE EXPERIMENTAL TOOLS
In the case of negative-ion mass spectrometry it is possible to obtain an expression for both the parent negative ion and the products of dissociative capture using a kinetic model similar to that in the ECD. The reactions and rate constants are attachment k1, detachment k 1, dissociation k2, recombination of both the electrons kD, and the negative ions kN . In some cases excited states are present, but for simplicity we will not include these here.
AB |
k1a½e & |
ð |
4:15 |
Þ |
½ ð Þ& ¼ |
ðk 1 þ kN þ k2Þ |
|
For nondissociative capture the molar response of the mass spectrometer is
½ |
AB |
ð Þ& ¼ |
k1a½e & |
ð |
4:16 |
Þ |
|
ðk 1 þ kN Þ |
|||||||
|
|
The electron affinities of SF6, nitrobenzene, triand tetrachloroethylene, and C6F6 have been determined from the kinetic model by measuring the temperature dependence of NIMS responses. The similarity of the global plots of the parent negative ions versus 1,000/T is an indication of the validity of the model. This can be seen in Figure 4.5 for SF6 and nitrobenzene. The A1 value for SF6 is larger
Figure 4.5 Negative-ion mass spectrometry data plotted as ln KT3/2 versus 1;000=T for nitrobenzene and sulfur hexafluoride. The data exhibit one a and one b region. The magnitude was scaled to the value of the k1 for SF6 at room temperature. The curves are calculated using the measured electron affinities of SF6 and C6H5NO2. The data determine the Qan values to be 1.0. The responses were obtained by injecting a solution with a known amount of the two compounds into the mass spectrometer.
