Pharmacokinetics 1
Pharmacokinetic characteristics of drug molecules concern the processes of absorption, distribution, metabolism, and excretion. The biodisposition ofa drug involves its permeation across cellular membrane barriers.
Drug administration (IM, PO, etc.)
Absorption into plasma
Plasma
Distribution to tissues
Bound drug
Free drug
/ |
|
' |
|
Drug metabolism |
Drug excretion |
||
(Renal, biliary, |
|||
(Liver, lung, blood, etc.) |
|||
|
|
exhalation, etc.) |
Figure 1-1 -1 . Drug Biodisposition
MEDICAL 3


Chapter 1 • Pharmacokinetics
Bioavailability(t)
Measure ofthe fraction of a dose that reaches the systemic= circulation. By defini tion, intravascular doses have 100% bioavailability, f 1.
..... |
lntravascular dose |
|
|
- |
(e.g., IV bolus) |
c:: |
|
0 |
|
:g |
|
c:: |
|
Q) |
|
() |
|
c:: |
Extravascular dose |
..... |
|
0 |
|
() |
|
Ol |
|
:J |
|
-0 |
(e.g., oral) |
cu |
|
E |
|
U) |
|
cu |
|
a: |
|
|
Time |
Figure 1-1-5. Area Under the Curve for an
IV Bolus and Extravascular Doses
First-Pass Effect
With oral administration, drugs are absorbed into the portal circulation and ini tially distributed to the liver. For some drugs, their rapid hepatic metabolism de creases bioavailability-the "first-pass" effect.
Examples:
•Lidocaine (IV vs. PO)
•Nitroglycerin (sublingual)
|
Bioavailability |
|
- EJ |
Mouth |
First pass |
|
Portal |
Stomach |
circulation |
|
GI tract |
Systemic circulation
Figure 1-1 -6. Bioavailability and First-Pass Metabolism
Abbreviations
AUC: area under the curve
PO: oral
IV: intravenous bolus
AUC1v: horizontally striped area AUCp0: vertically striped area
MEDICAL 7

Section I • General Principles
Bridge to Physiology
ApproximateVd Values
(weight 70 kg)
•plasma volume (3 L)
•blood volume (5 L)
•extracellular fluid (ECF 12-14 L)
•total bodywater (TBW 40-42 L)
DISTRIBUTION
•The processes of distribution of a drug from the systemic circulation to organs and tissue.
•Conditions affecting distribution include:
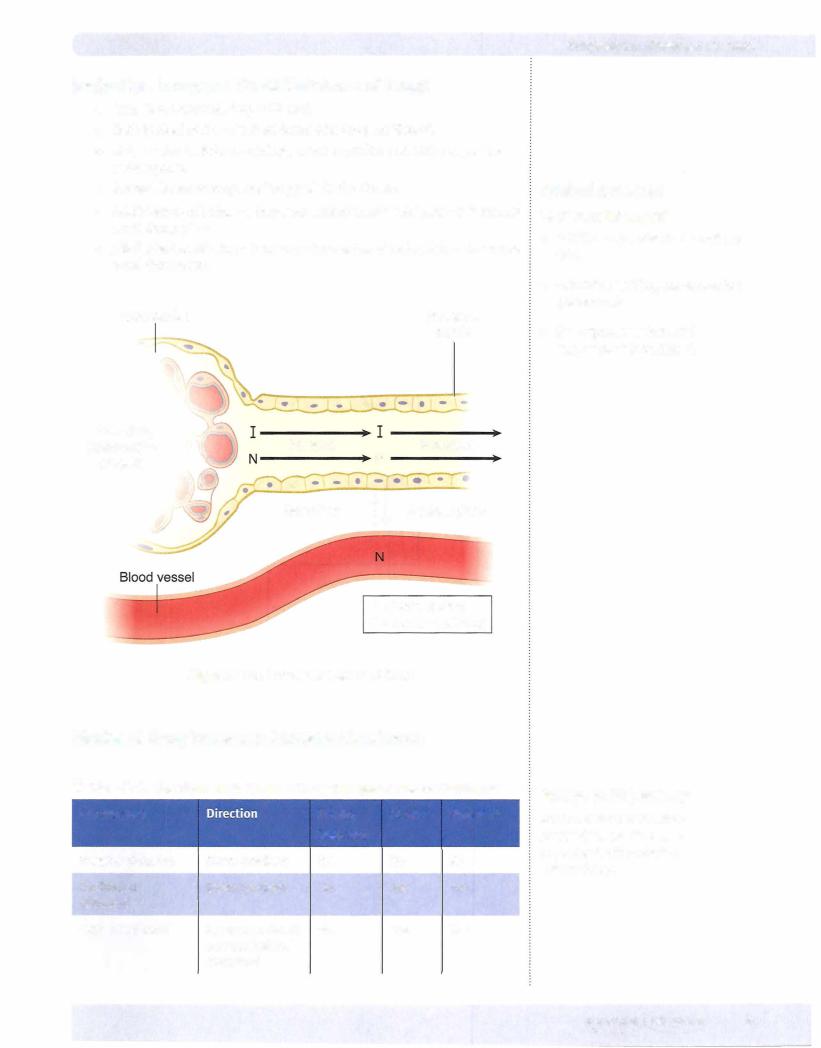
Under normal conditions, protein-binding capacity is much larger than is drug concentration. Consequently, the free fraction is gener ally constant.
-Many drugs bind to plasma proteins, including albumin, with an equi librium between bound and free molecules (recall that only unbound drugs cross biomembranes).
Drug + Protein |
Drug-Protein Complex |
(Active, free) |
(Inactive, bound) |
-Competition between drugs for plasma protein-binding sites may increase the "free fraction;' possibly enhancing the effects of the drug displaced. Example: sulfonamides and bilirubin in a neonate
Special Barriers to Distribution
•Placental-most small molecular weight drugs cross the placental barri er, although fetal blood levels are usually lower than maternal. Example: propylthiouracil (PTU) versus methimazole
•Blood-brain-permeable only to lipid-soluble drugs or those of very low molecular weight. Example: levodopa versus dopamine
Apparent Volume of Distribution (Vd)
A kinetic parameter ofa drug that correlates dose with plasma level at zero time.
Vd |
- |
Dose |
where c0 =[plasma] at zero time |
|
Co |
•This relationship can be used for calculating Vd by using the dose only if one knows c0•
•Vd is low when a high percentage of a drug is bound to plasma proteins.
•Vd is high when a high percentage of a drug is being sequestered in tis sues. This raises the possibility of displacement by other agents; exam ples: verapamil and quinidine can displace digoxin from tissue-binding sites.
•Vd is needed to calculate a loading dose in the clinical setting (see Pharmacokinetic Calculation section, Equation 4).
8MEDICAL

Chapter 1 • Pharmacokinetics
Redistribution
In addition to crossing the blood-brain barrier (BBB), lipid-soluble drugs redis tribute into fat tissues prior to elimination.
In the case of CNS drugs, the duration of action of an initial dose may depend more on the redistribution rate than on the half-life. With a second dose, the blood/fat ratio is less; therefore, the rate of redistribution is less and the second dose has a longer duration of action.
Blood |
Fat |
4
Drug (D) D 2 Slow
Inactive
Figure 1-1-7. Redistribution
BIOTRANSFORMATION
•The general principle of biotransformation is the metabolic conver sion of drug molecules to more water-soluble metabolites that are more readily excreted.
•In many cases, metabolism of a drug results in its conversion to com pounds that have little or no pharmacologic activity.
•In other cases, biotransformation of an active compound may lead to the formation of metabolites that also have pharmacologic actions.
•A few compounds (prod.rugs) have no activity until they undergo meta bolic activation.
Drug |
Inactive metabolite(s) |
Drug |
Active metabolite(s) |
Prodrug |
Drug |
Figure 1-1 -8. Biotransformation of Drugs
Clinical Correlate
Active Metabolites
Biotransformation ofthe benzodiazepine diazepam results in formation of nordiazepam, a metabolite with sedative-hypnotic activity and a long duration of action.
MEDICAL 9
Chapter 1 • Pharmacokinetics
 Nonmicrosomal metabolism
Hydrolysis
0Phase I reaction involving addition of a water molecule with sub- sequent bond breakage
0Includes esterases and amidases
0Genetic polymorphism exists with pseudocholinesterases
0Example: local anesthetics and succinylcholine
Monoamine oxidases
0Metabolism of endogenous amine neurotransmitters (dopamine, norepinephrine, and serotonin)
0Metabolism of exogenous compounds (tyramine)
Alcohol metabolism
0Alcohols are metabolized to aldehydes and then to acids by dehy drogenases (see CNS Pharmacology, section IV)
0Genetic polymorphisms exist
Phase II
•Definition: Conjugation with endogenous compounds via the activity of transferases
•May follow phase I or occur directly
•Types of conjugation:
Glucuronidation
-Inducible
-May undergo enterohepatic cycling (Drug: Glucuronide ---intestinal7 bacterial glucuronidases ---free7 drug)
Reduced activity in neonates
Examples: morphine and chloramphenicol
Acetylation
0Genotypic variations (fast and slow metabolizers)
0Drug-induced SLE by slow acetylators with hydralazine > procain amide > isoniazid (INH)
Glutathione (GSH) conjugation
0Depletion of GSH in the liver is associated with acetaminophen hepatotoxicity
MEDICAL 11

Section I • General Principles
ELIMINATION
Concerns the processes involved in the elimination of drugs from the body (and/ or plasma) and their kinetic characteristics. The major modes of drug elimina tion are:
•Biotransformation to inactive metabolites
•Excretion via the kidney
•Excretion via other modes, including the bile duct, lungs, and sweat
•Definition: Time to eliminate 50% of a given amount (or to decrease plasma level to 50% of a former level) is called the elimination half-life (tl/2).
Zero-Order Elimination Rate
• A constant amount of drug is eliminated per unit time; for example, if 80 mg is administered and 10 mg is eliminated every 4h, the time course of drug elimination is:
4h |
4h |
4h |
4h |
80mg --7 70 mg |
--7 60 mg |
--7 |
50 mg --7 40 mg |
•Rate of elimination is independent of plasma concentration (or amount in the body).
•Drugswith zero-order elimination have no fixedhalf-life (t112 is a variable).
•Drugs with zero-order elimination include ethanol (except low blood levels), phenytoin (high therapeutic doses), and salicylates (toxic doses).
..... |
..... |
|
- |
||
O'l |
O'l |
|
::::l |
||
::::l |
"'O |
|
"'O |
0 |
|
0 |
|
2 |
|
·c: |
|
::::l |
||
c |
O'l |
|
:::> |
||
|
|
0 |
|
|
_J |
|
Time |
Time |
Figure l-1-9a. Plots of Zero-Order Kinetics
First-Order Elimination Rate
• A constant fraction of the drug is eliminated per unit time (t112 is a con stant). Graphically, first-order elimination follows an exponential decay versus time.
•For example, if 80mg of a drug is administered and its elii:nination half life = 4h, the time course of its elimination is:
4h |
4h |
4h |
4h |
80mg --7 40 mg |
--7 20 mg |
--7 |
10 mg --7 5 mg |
12 MEDICAL

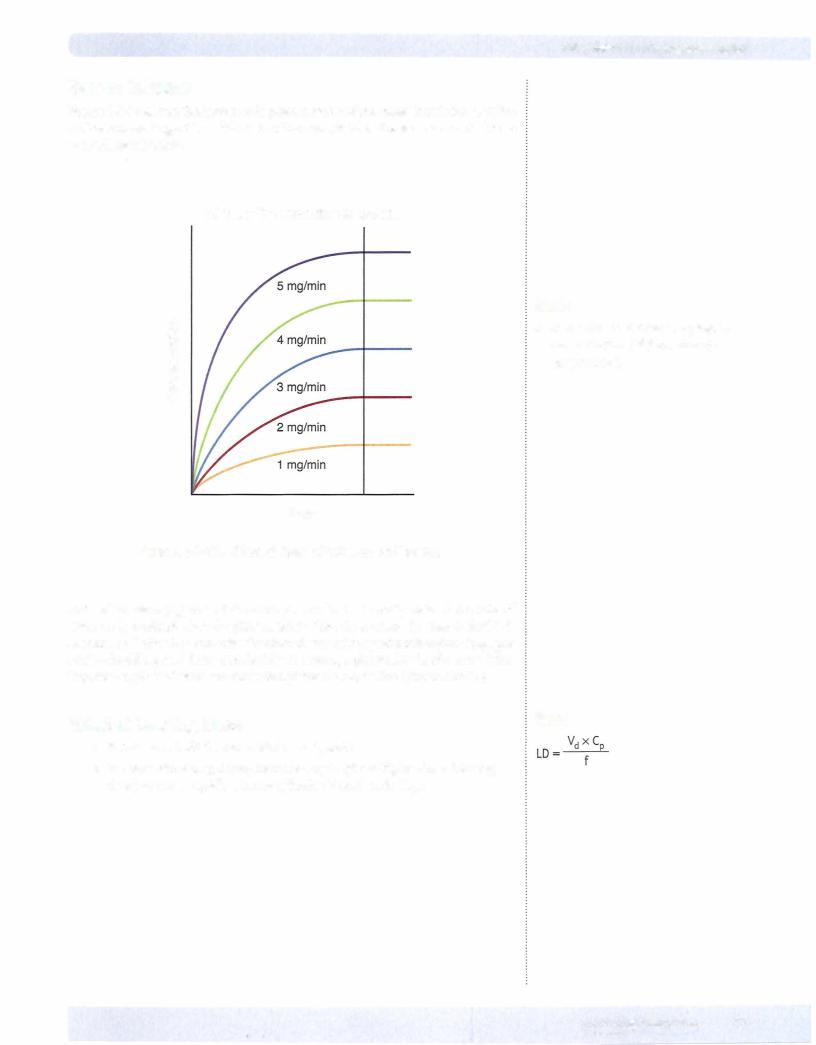
Rate of Infusion
Figure I-1-12 shows the increases in plasma levels of the same drug infusedatfive different rates. Regardless of the rate of infusion, it takes the same amount of time to reach steady state.
All have the same time to plateau
c 0
....
c
(!)
()
c 0 ()
Time
Figure 1-1-1 2. Effect of Rate of Infusion on Plasma
Chapter 1 • Pharmacokinetics
Note
•Remember that dose and plasma concentration ccss) are directly proportional.
Rate of infusion Cko) does determine plasma level at steady state. If the rate of infusion is doubled, then the plasma level of the drug at steady state is doubled. A similar relationship can exist for other forms of drug administration (e.g., per oral)-doubling oral doses can double the average plasma levels of a drug. Plot ting dose against plasma concentration yields a straight line (linear kinetics).
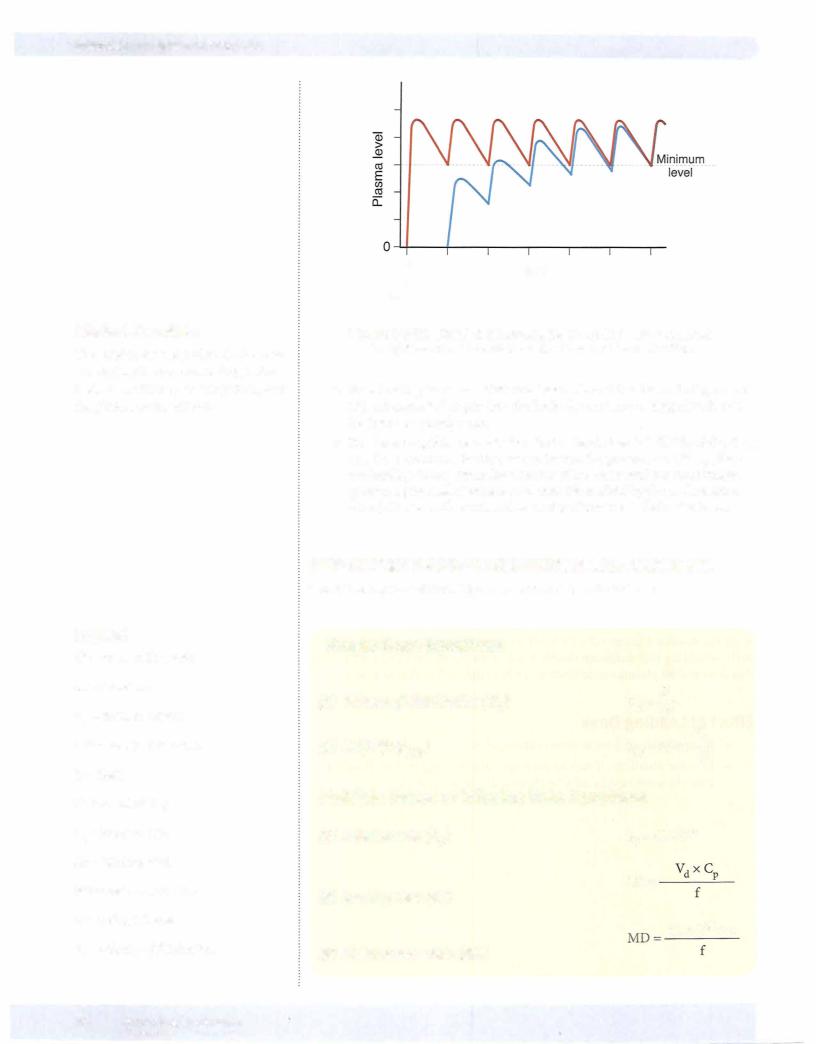
Effect of Loading Dose |
Note |
|
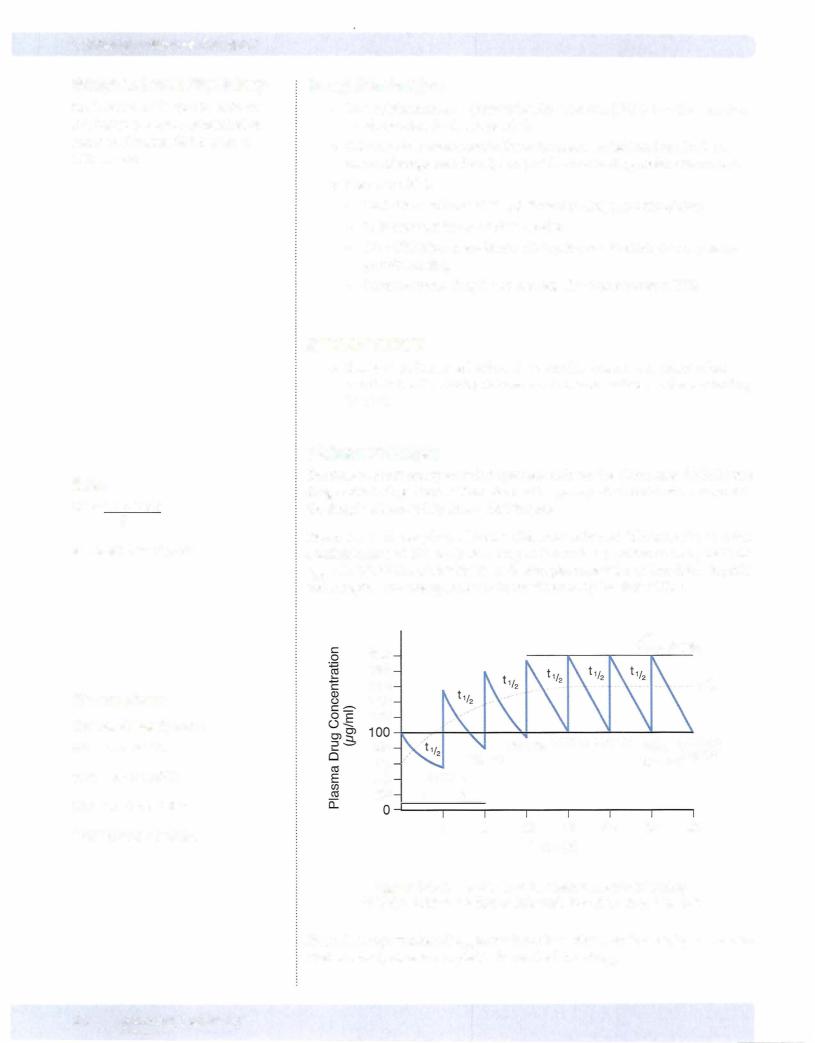
•It takes 4-5 half-lives to achieve steady state.
•In some situations, it may be necessary to give a higher dose (loading dose) to more rapidly achieve effective blood levels (CP).
MEDICAL 1 5

Chapter 1 • Pharmacokinetics
Chapter Summary
•The pharmacokinetic characteristics of a drug are dependent upon the processes of absorption, distribution, metabolism, and excretion. An important element concerning drug biodistribution is permeation, which is the ability to cross membranes, cellular and otherwise.
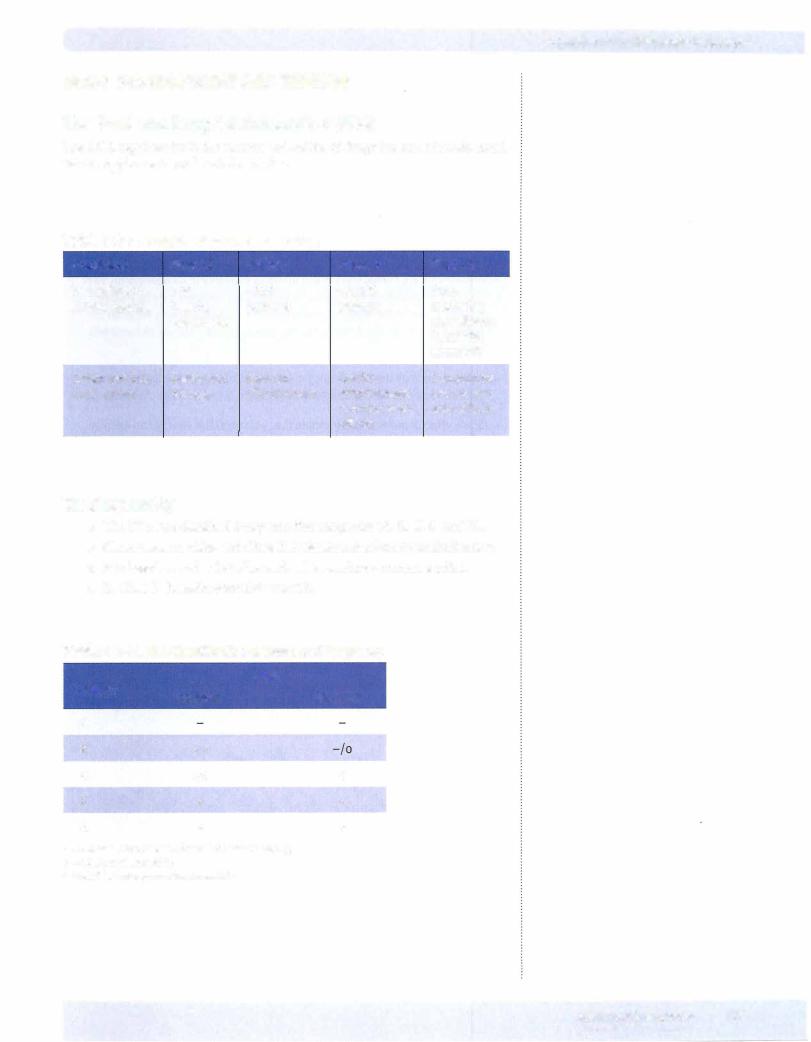
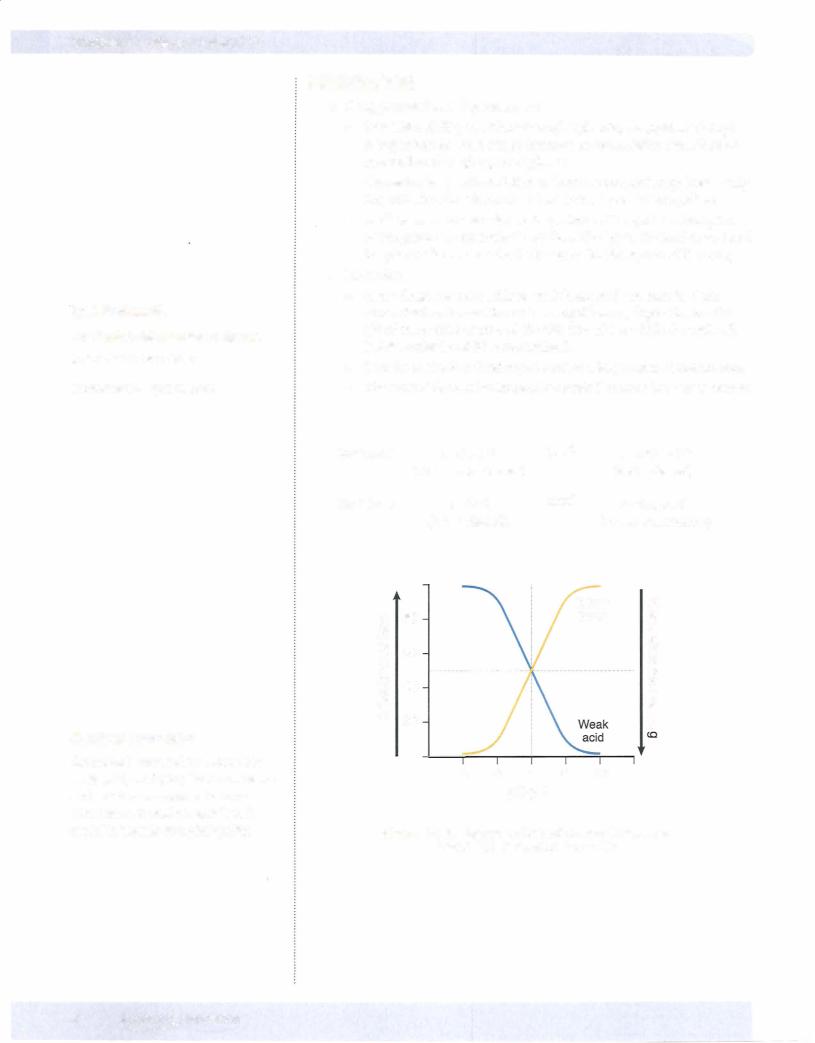
•A drug's ability to permeate is dependent on its solubility, the concentration gradient, and the available surface area, which is influenced by the degree ofvascularity. Ionization affects permeation because unionized molecules are minimallywater soluble but do cross biomembranes, a feat beyond the capacity of ionized molecules. Figure 1-1-2 illustrates the principles associated with ionization; Table 1-1-1 summarizes the three basic modes oftransport across a membrane: passive, facilitated, and active.
•Absorption concerns the processes of entry into the systemic circulation. Exceptforthe intravascular route, some absorptive process is always involved. These have the same determinants as those of permeation. Because absorption may not be 100% efficient, less than the entire dose administered may get into the circulation.
•Any orally administered hydrophilic drug will be absorbed first into the portal vein and sent directly to the liver, where it may be partially deactivated. This is the first-pass effect.
•The distribution of a drug into the various compartments ofthe body is dependent upon its permeation properties and its tendency to bind to plasma
proteins. The placental and blood-brain barriers are of particular importance in considering distribution. The Vd is a kinetic parameter that correlates the dose given to the plasma level obtained: the greater the Vd value, the le$S the plasma concentration.
•Aswell as having the abilityto cross the blood-brain barrier, lipophilic drugs have a tendency to be deposited in fat tissue. As blood concentrations fall, some ofthis stored drug is released. This is called redistribution. Because with each administration more lipophilic drug is absorbed into the fat, the duration of action of such a drug increases with the number of doses until the lipid stores are saturated.
•Biotransformation is the metabolic conversion of drugs, generally to less active compounds but sometimes to iso-active or more active forms. Phase I biotransformation occurs via oxidation, reduction, or hydrolysis. Phase II metabolism occurs via conjugation.
•The cytochrome P-450 isozymes are a family of microsomal enzymes that collectively have the capacity to transform thousands of different molecules. The transformations include hydroxylations and dealkylations, as well as the promotion ofoxidation/reduction reactions. These enzymes have an absolute
requirement for NADPH and 02• The various isozymes have different substrate and inhibitor specificities.
•Other enzymes involved in phase I reactions are hydrolases (e.g., esterases and amidases) and the nonmicrosomal oxidases (e.g., monoamine oxidase and alcohol and aldehyde dehydrogenase).
(Continued)
MEDICAL 1 7
Section I • General Principles
Chapter Summary (confd)
•Phase II reactions involve conjugation, sometimes after a phase I hydroxylation. The conjugation may be glucuronidation, acetylation, sulfation, or addition of glutathione.
•Modes of drug elimination are biotransformation, renal excretion, and excretion by other routes (e.g., bile, sweat, lungs, etc.). Most drugs follow first-order elimination rates. Figures l-1-9a and l-1-9b compare zeroand
first-order elimination, and Figure 1-1-10 demonstrates howthe t112 and the theoretical zero time plasma concentration (C0) can be graphically determined. An important relationship is dose= Vdx c0.
•Renal clearance (CIR) represents the volume of blood cleared by the kidney per unit time and is a constant for drugs with first-order elimination kinetics.
Total body clearance equals renal plus non renal clearance. An important relationship is Cl= k x Vd.
•A steady state is achieved when the rate coming in equals the rate going out. The time to reach a steady state is dependent only on the elimination half-life. It is independent of dose and frequency of administration or rate of infusion (see Figures 1-1-11, -12, and -13).
•Other equations describing relationships important for calculation are those used to determine the loading dose, infusion rate, and maintenance dose.
18 MEDICAL

Section I • General Principles
Noncompetitive antagonists:
°Cause a nonparallel shift to the right
°Can be only partially reversed by i the dose of the agonist 0 Appear to l the efficacy of the agonist
•Physiologic antagonism (different receptor)
-Two agonists with opposing action antagonize each other
-Example: a vasoconstrictor with a vasodilator
•Chemical antagonism:
-Formation of a complexbetween effector drug and another compound
-Example: protamine binds to heparin to reverse its actions
•Potentiation
Causes a parallel shift to the left to the D-R curve - Appears to i the potency of the agonist
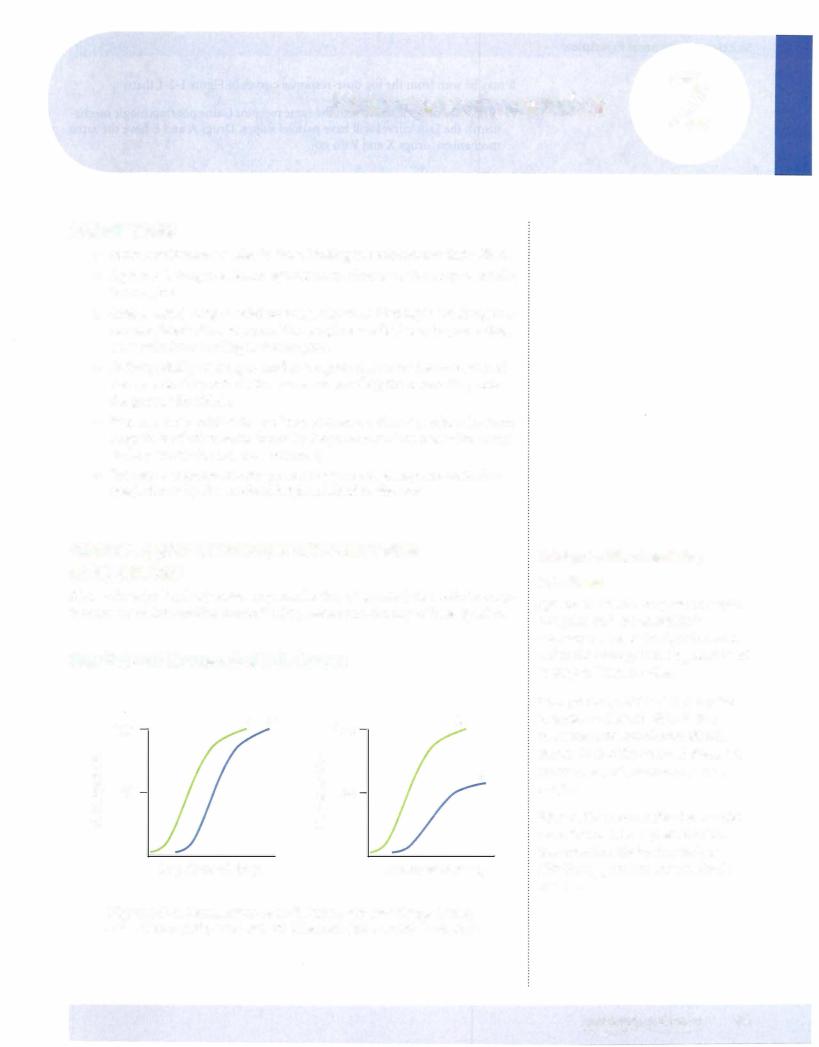
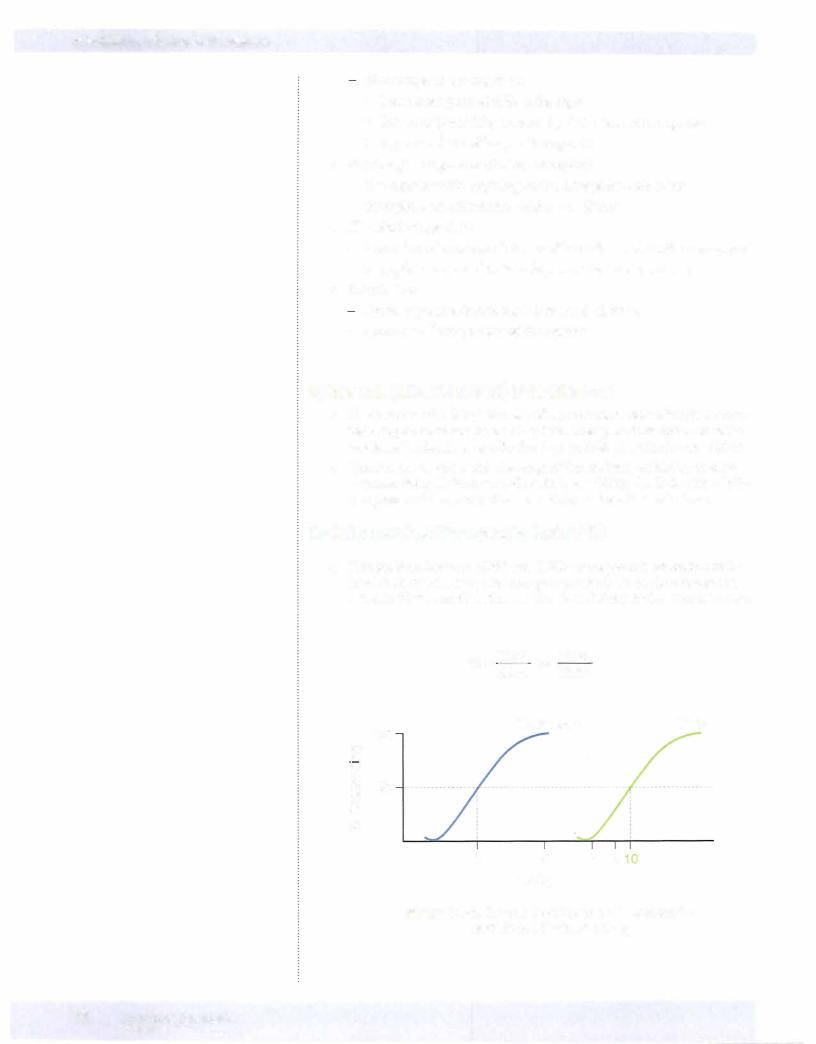
QUANTAL (CUMULATIVE) D-R CURVES
•These curves plot the percentage of a population responding to a speci fied drug effect versus dose or log dose. They permit estimations of the median effective dose, or effective dose in 50% of a population-EDSO.
•Quanta! curves can reveal the range of intersubject variability in drug response. Steep D-R curves reflect little variability; flat D-R curves indi cate great variability in patient sensitivity to the effects of a drug.
Toxicity and the Therapeutic Index (Tl)
•Comparisons between EDSO and TDSO values permit evaluation of the relative safety of a drug (the therapeutic index), as would comparison between EDSO and the lethal median dose (LDSO) if the latter is known.
|
TI = |
TDSO |
or |
LDSO |
|
|
|
EDSO |
|
EDSO |
|
||
|
|
|
|
|||
OJ |
100 |
Therapeutic |
Toxic |
|||
|
|
|
|
|
||
c: |
|
|
|
|
|
|
"O |
|
|
|
|
|
|
c: |
|
|
|
|
|
|
g_ |
50 |
|
|
|
|
|
CJ) |
|
|
|
|
|
|
Q) |
|
|
|
|
|
|
er: |
|
|
|
|
|
|
cJ. |
|
|
|
|
|
|
|
2 |
|
|
4 |
6 |
8 |
mg/kg
Figure 1-2-5. Quantal D-R Curves of Therapeutic
and Toxic Effects of a Drug
22 MEDICAL

Chapter 2 • Pharmacodynamics
•As shown in Figure I-2-5, these D-R curves can also be used to show the relationship between dose and toxic effects of a drug. The median toxic
dose of a drug (TDSO) is the dose that causes toxicity in 50% of a popu lation. = =
• From the data shown, TI 10/2 5
•Such indices are of most value when toxicity represents an extension of the pharmacologic actions of a drug. They do not predict idiosyncratic reactions or drug hypersensitivity.
SIGNALING MECHANISMS: TYPES OF DRUG
RESPONSIVE SIGNALING MECHANISMS
•Binding of an agonist drug to its receptor activates an effector or signal ing mechanism.
•Several different types of drug-responsive signaling mechanisms are known.
Intracellular Receptors
•These include receptors for steroids. Binding of hormones or drugs to such receptors releases regulatory proteins that permit activation and in some cases dimerization of the hormone-receptor complex. Such com plexes translocate to the nucleus, where they interact with response ele ments in spacer DNA. This interaction leads to changes in gene expres sion. For example, drugs interacting with glucocorticoid receptors lead to gene expression of proteins that inhibit the production of inflamma tory mediators.
•Other examples include intracellular receptors for thyroid hormones, gonadal steroids, and vitamin D.
•Pharmacologic responses elicited via modification of gene expression are usually slower in onset but longer in duration than many other drugs.
Membrane Receptors Directly Coupled to Ion Channels
•Many drugs act by mimicking or antagonizing the actions of endog enous ligands that regulate flow of ions through excitable membranes via their activation of receptors that are directly coupled (no second messengers) to ion channels.
•For example, the nicotinic receptor for ACh (present in autonomic ner vous system [ANS] ganglia, the skeletal myoneural junction, and the central nervous system [CNS] ) is coupled to a Na+/K+ ion channel. The receptor is a target for many drugs, including nicotine, choline esters, ganglion blockers, and skeletal muscle relaxants.
•Similarly, the GABAA receptor in the CNS, which is coupled to a chlo ride ion channel, can be modulated by anticonvulsants, benzodiazepines, and barbiturates.
MEDICAL 23
Section I • General Principles
In A Nutshell
KeyANS Receptors
M1, M3, a1:
Gq activation of phospholipase C
M2, 0:2, D2:
Gi inhibition of adenylyl cyclase
P1. P2. D1:
G5 activation of adenylyl cyclase
Receptors Linked Via Coupling Proteins to Intracellular
Effectors
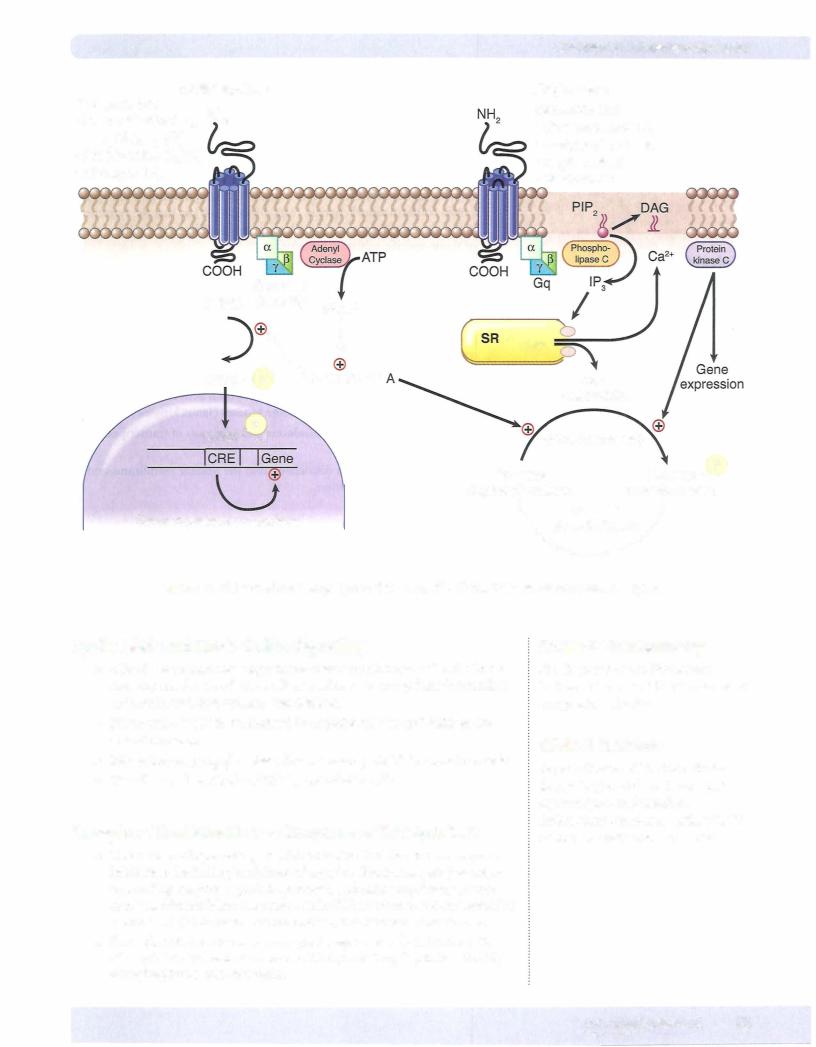
•Many receptor systems are coupled via GTP-binding proteins
(G-proteins) to adenylyl cyclase, the enzyme that converts ATP to cAMP, a second messenger that promotes protein phosphorylation by activat ing protein kinase A. These receptors are typically "serpentine;' with seven transmembrane spanning domains, the third of which is coupled to the G-protein effector mechanism.
•Protein kinase A serves to phosphorylate a set of tissue-specific substrate enzymes or transcription factors (CREB), thereby affecting their activity.
G5 proteins
•Binding of agonists to receptors linked to G5 proteins increases cAMP production.
•Such receptors include those for catecholamines (beta), dopamine (D1), glucagon, histamine (H2), prostacyclin, and some serotonin subtypes.
G;proteins
•Binding of agonists to receptors linked to Gi proteins decreases cAMP production.
•Such receptors include adrenoreceptors (alpha2), ACh (M2), dopamine (D2 subtypes), and several opioid and serotonin subtypes.
Gqproteins
•Other receptor systems are coupled via GTP-binding proteins (Gq), which activate phospholipase C. Activation of this enzyme releases the
second messengers inositol triphosphate (IP3) and diacylglycerol (DAG) from the membrane phospholipid phosphatidylinositol bisphosphate (PIP2). The IP3 induces release of Ca2+ from the sarcoplasmic reticulum (SR), which, together with DAG, activates protein kinase C. The protein kinase C serves then to phosphorylate a set of tissue-specific substrate enzymes, usually not phosphorylated by protein kinase A, and thereby affects their activity.
•These signaling mechanisms are invoked following activation of recep
tors for ACh (M1 and M3), norepinephrine (alpha1), angiotensin II, and several serotonin subtypes.
24 MEDICAL
Section I • General Principles
Clinical Correlate
lmatinib is a specific tyrosine-kinase (TK) inhibitor, while sorafenib is a non-specific TK inhibitor.
Receptors That Function as Transmembrane Enzymes
•These receptors mediate the first steps in signaling by insulin and growth factors, including epidermal growth factor (EGF) and platelet-derived growth factor (PDGF). They are membrane-spanning macromolecules with recognition sites for the binding
of insulin and growth factors located externally and a cytoplasmic domain that usually functions as a tyrosine kinase. Binding of the ligand causes conformational changes (e.g., dimerization) so that the tyrosine kinase domains become activated, ultimately leading to phosphorylation of tissue-specific substrate proteins.
•Guanyl cyclase-associated receptors: stimulation of receptors to atrial natriuretic peptide activates the guanyl cyclase and i cyclic GMP (cGMP)
Receptors for Cytokines
•These include the receptors for erythropoietin, somatotropin, and inter ferons.
•Their receptors are membrane spanning and on activation can activate a distinctive set of cytoplasmic tyrosine kinases (Janus kinases [JAKs]).
•JAKs phosphorylate signal transducers and activators oftranscription (STAT) molecules.
•STATs dimerize and then dissociate, cross the nuclear membrane, and modulate gene transcription.
26 MEDICAL