

Mathematics for Life Sciences and Medicine - Takeuchi Iwasa and Sato
.pdf7
Directional Evolution of Virus Within a Host
Under Immune Selection
Yoh Iwasa, Franziska Michor, and Martin Nowak
Summary. Viruses, such as the human immunodeficiency virus, the hepatitis B virus, the hepatitis C virus, undergo many rounds of inaccurate reproduction within an infected host. They form a heterogeneous quasispecies and change their property following selection pressures. We analyze models for the evolutionary dynamics of viral or other infectious agents within a host, and study how the invasion of a new strain a ects the composition and diversity of the viral population. We previously proved, under strain specific immunity, that (Addo et al. 2003) the equilibrium abundance of uninfected cells declines during viral evolution, and that (Bittner et al. 1997) the absolute force of infection increases during viral evolution. Here we extend the results to a wider class of models describing the interaction between the virus population and the immune system. We study virus induced impairment of the immune response and certain cross-reactive stimulation of specific immune responses. For nine di erent mathematical models, virus evolution reduces the equilibrium abundance of uninfected cells and increases the rate at which uninfected cells are infected. Thus, in general, virus evolution tends to increase its pathogenicity. Those trends however do not hold for general cross-reactive immune responses, which introduce frequency dependent selection among viral strains. Hence an idea for combating HIV infection is to construct a virus mutant that can outcompete the existing infection without being pathogenic itself.
7.1 Introduction
Many pathogenic microbes have high mutation rates and evolve rapidly within a single infected host individual. For example, the human immunodeficiency virus (HIV) can generate mutations, and escape from immune responses and drug treatment (Hahn et al. 1986; Holmes 1992; Fenyo 1994; McMichael and Phillips 1997; Borrow et al. 1997). The continuous evolution of HIV within an infected individual over several years shifts the balance of power between the immune system and the virus in favor of the virus (Nowak et al. 1991). Virus evolution as mechanism of disease progression in HIV infection has been a common theme for the last 15 years (Nowak et al. 1990,
156 Yoh Iwasa et al.
1995; DeBoer and Boerlijst 1994; Sasaki 1994; Nowak and May 2000). The basic theoretical idea is that a rapidly replicating HIV quasispecies establishes a permanent infection that goes through many viral generations within a short time. The immune system responds to various viral epitopes, but the virus population escapes from many such responses by generating mutants that are not recognized in particular epitopes. During the cause of infection, virus evolution proceeds toward increasing pathogenicity by reducing immune control and increasing viral abundance. There is ample experimental evidence for this mode of disease progression: (i) The HIV population in any one infected host is fairly homogeneous during primary phase but becomes heterogeneous afterwards (Bonhoe er and Nowak 1994; Bonhoe er et al. 1995; Wolinsky et al. 1996); (ii) the average life-cycle of HIV during the asymptomatic phase of infection is short, about 1-2 days (Ho et al. 1995; Perelson et al. 1996; Bonhoe er et al. 1997); hence the HIV quasi-species can rapidly respond to selection pressure; (iii) HIV escapes from B-cell and T-cell mediated immune responses (Phillips et al. 1991; Wei et al. 2003; Addo et al. 2003).
In Iwasa et al. (2004), we analyze three models for the interaction between a virus population and immune responses (Perelson 1989; McLean and Nowak 1992; De Boer and Booerlijst 1994; Nowak and Bangham 1996; De Boer and Perelson 1998; Bittner et al. 1997; Perelson and Weisbuch 1997; Wodarz et al. 1999; Wahl et al. 2000; Nowak and May 2000). The models describe deterministic evolutionary dynamics in terms of uninfected cells, infected cells and strain-specific immune responses, in which there are n virus strains (or mutants) which induce n immune responses that are directed at the strains that induce them. Virus mutants can di er in all virological and immunological parameters.
In the absence of immune responses only one virus strain with the maximum fitness can survive at equilibrium. However, in the presence of immune responses, multiple strains can coexist stably. Consider a population of viral strains at a stable equilibrium. Suppose that a new strain is generated by mutation. There can be several di erent outcomes: the new strain may simply be added to the existing population thereby increasing the number of strains by one; the new strain may invade the existing population and other strains may become extinct; or the new strain may not be able to invade.
We ask whether there are quantities that will consistently increase (or decrease) during such viral evolution. We can prove that neither viral load nor viral diversity increases monotonically with virus evolution (although they are likely to increase in a probabilistic sense). Iwasa et al. (2004) proved that any successful invasion of a new virus strain always decreases the total abundance of uninfected cells if the immune response is specific to the strain. Further
we find that any successful invasion increases the total force of infection,
n
denoted by i=1 βiyi. In the present chapter, after summarizing Iwasa et al. (2004), we mathematically examine how the invasion of a new strain a ects
7 Directional Evolution of Virus within a Host under Immune Selection |
157 |
the composition and diversity of viral population in a host for some classes of models with virus induced impairment of immune responses or cross-reactive immune stimulations. We can show that the same directional evolutionary trends as in the models without cross-immunity hold for a class of model with cross-reactive impairment or activation of immune response. Under these settings. pathogenicity always increases by evolution within a host individual.
However we can also illustrate that these unidirectional trends of virus evolution under immune selection do not hold for general cross-reactive immune responses, in which a new strain can increase the uninfected cell number.
7.2 Model of cytotoxic immunity
We start with a model in which cytotoxic immune responses reduce the lifetime of infected cells (Iwasa et al. 2004). Let x be the abundance of uninfected target cells, and yi be the abundance of cells infected with virus strain i. Let zi be the abundance of immune cells specific to strain i. Consider the following system of ordinary di erential equations:
[ Model 1 ] : Strain specific immunity
|
d |
n |
|
|
|||
|
|
|
|
||||
|
|
|
|
x = λ − dx − |
|
βixyi , |
(1a) |
|
dt |
i=1 |
|||||
|
|
|
|
|
|
|
|
|
d |
|
|
|
|||
|
|
yi = (βix − ai |
− pizi)yi , i = 1, 2, 3, . . . , n , |
(1b) |
|||
dt |
|||||||
|
d |
|
|
|
|||
|
zi = ciyi − bizi , |
i = 1, 2, 3, . . . , n . |
(1c) |
||||
dt |
|||||||
Target cells are supplied at a constant rate, λ, and die at a rate proportional to their abundance, dx. The infection rate is proportional to the abundance of uninfected and infected cells, βixyi. Infected cells die at rate aiyi because of viral cytopathicity. The immune response zi is specific to virus strain i. The e cacy of the immune response in killing infected cells is given by pi. Immune activity increases at a rate proportional to pathogen abundance, ciyi, and decreases at rate bizi. We do not model the dynamics of free viral particles explicitly, but we simply assume that the number of free viral particles is proportional to the number of cells infected. This is valid because the number of free vial particles changes at a much shorter time scales than those variables in (1) (Regoes et al. 1998; Iwasa et al. 2004).
The equilibrium
The model given by (1) has a stable equilibrium. The equilibrium values of yi and zi can be written as functions of x, derived from (1b) and (1c). We
158 Yoh Iwasa et al.
denote these by yi(x) and zi(x) for i = 1, 2, . . . , n. For given x, these values are either positive or zero.
yi = |
bi |
[βix − ai]+ , |
and zi = |
1 |
[βix − ai]+ , |
(2) |
cipi |
pi |
where [x]+ = x, for x > 0, and [x]+ = 0, for x ≤ 0. Hence the equilibrium
abundance of infected cells is a function of uninfected cell abundance x, and
n
the total intensity of immune reaction Y . Combining Y = i=1 βiyi with (2), we have
n
Y = βibi [βix − ai]+ , (3)
i=1 cipi
at equilibrium. From, (2), yi is zero for x ≤ ai/βi, but is positive and an increasing function of x for x > ai/βi. The minimum level of uninfected cells required to sustain virus strain i is by ai/βi. On the other hand, (1a) indicates that Y = λ/x − d holds at equilibrium.
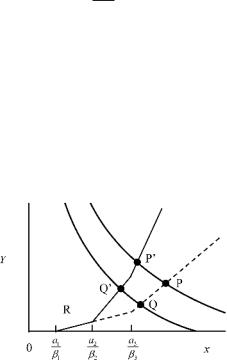
The right hand side of (3) is a sum of increasing functions, and hence it is also an increasing function of x. Incontrast Y = λ/x − d is a decreasing function of x. Hence there is always a single positive solution x at which (3) is equal to Y = λ/x − d. x is the equilibrium number of uninfected cells. Figure 7.1 plotted (3) and Y = λ/x − d, in which the horizontal axis is x,
Fig. 7.1. Graphical representation of (3) and Y = λ/x − d for a population before and after the invasion of a new strain. The model is given by (1). Broken curve is for the population with strain 1 and strain 3. Solid curve is for the population with strain 2 is added. Three arcs connected by kink is (3), indicating per capita risk of uninfected cells. The curves with negative slopes are Y = λ/x − d, with di erent value of λ. Horizontal axis is the abundance of uninfected cells x. P and Q are for the equilibrium corresponding to di erent λ, both including two strains. After invasion of strain 2, (3) would change to a solid curve and the equilibria would shift
to P and Q . All three strains coexist in P . But strain 3 is replaced by strain 2 in Q
7 Directional Evolution of Virus within a Host under Immune Selection |
159 |
and the vertical axis is Y . Equation (3) is a piecewise straight line |
with |
a positive slope. Y = λ/x−d is a curve with a negative slope. The equilibrium solution x is given by their cross point.
As explained in Iwasa et al. (2004), the model given by (1) has a Lyapunov function and hence the equilibrium calculated in this way is globally stable.
The possibility of invasion of a new strain into the population and its outcome is also known from a figure such as Fig. 7.1. After invasion, (3) increases by βj yj (x). If, before the invasion of strain j, the population has a level of uninfected cells less than aj /βj , the invasion is not successful. If instead the level of uninfected cells before the invasion is greater than aj /βj , then strain j can increase. As an outcome of invasion, the cross–point would shift to above and toward left. The level of uninfected cells x becomes smaller
than before the invasion, and Y is larger than before the invasion, and hence |
||
|
|
|
Y = |
n |
βiyi should increase. |
i=1 |
||
Figure 7.1 illustrates the situation where two strains (strain 1 and strain 3) exist in the initial population, and then strain 2 invades it (a1/β1 < a2/β2 < a3/β3). The broken curve in Fig. 7.1 is for the population before the invasion including strains 1 and 3 only. It consists of three arcs connected by kinks. Two curves with negative slopes are Y = λ/x − d for di erent levels of λ. Both P and Q are the communities with two strains. Strain 2 with an intermediate value of a2/β2 is added to the population.
Consider the case in which population indicated by P is realized before the invasion of strain 2. When the strain 2 invades, the equilibrium would be shifted to P in which all the three strains coexist because the new cross point is larger than ai/βi of these strains. In this case the outcome of invasion is simply the addition of a new strain 2 without extinction of the resident strains. If the population before invasion is the one indicated by Q with strains 1 and 3. The outcome of the invasion of strain 2 is the one indicated by Q in which strains 1 and 2 coexist, but strain 3 is not maintained. This implies that the invasion of strain 2 is successful, and it drives strain 3 to extinction– the replacement of strain 3 by strain 2 occurs. The new level of uninfected cells x is too low for the strain 3 to be maintained.
From these arguments, we can see the following: (Addo et al. 2003) The invasibility of a novel strain is determined by whether or not the equilibrium abundance of uninfected cells before the invasion is greater than ai/βi (inva-
sible if xbefore > ai/βi; not invasible otherwise). (Bittner et al. 1997) As the result of a successful invasion, the location of the equilibrium would move
upward and the abundance of uninfected cells downward (xafter < xbefore). (Bonhoe er and Nowak 1994) If x moves less than the threshold for some
resident species xafter < aj /βj , they should go extinct, while those species would remain positive if xafter > aj /βj is satisfied. As a result of invasion, the equilibrium intensity of immune reaction Y increases, but the number
of strains maintained in the system may increase or remain unchanged or decrease. To clarify, we state this as the following proposition:

160 Yoh Iwasa et al.
Proposition 1. After a new strain succeeds in invasion, the equilibrium
abundance of uninfected cells x always becomes less than the level before the
n
invasion. The equilibrium total force of infection i=1 βiyi always increases after such an evolutionary change.
A rigorous proof will be given in a later section. Before giving a formal proof, we would like to explain several di erent models of interaction between strains in which a similar evolutionary trend holds.
Note that the number of coexisting strains may not increase monoton-
ically, because the invasion of a strain may cause the extinction of many
existing residents. We also note that the total virus load i yi may decrease, but a properly weighted sum of viruses would increase all the time as stated in Proposition 1.
7.3 Cytotoxic immunity
with proportional activation term
Next, we study another model for strain specific immunity, given by (1) in which (1c) is replaced by the following:
[ Model 2 ]: |
|
d |
|
dt zi = (ciyi − bi)zi , i = 1, 2, 3, . . . , n . |
(4) |
Here the immune response reduces the life-time of infected cells, as in model 1, but the population growth rate of immune cells specific to strain i is proportional to their current number as well as the number of infected cells: the rate of immune cell production in (4) is given by ciyizi instead of ciyi as in (1c). If viral abundance is kept constant, the immune activity shows an exponential increase in (4), but a linear increase in (1c). Again, there is a single, globally stable equilibrium (see appendix A of Iwasa et al. 2004). It is also similar to a model by Regoes et al. (1998), but parameters ai, pi, ci were assumed common among strains (no su x) in Regoes et al., but they can di er between strains in (4).
The equilibrium abundance of yi can be expressed as a function of unin-
fected cell number x and the intensity of total immunity Y . |
|
|
|||||||||||
|
ai |
|
bi |
|
βi |
x |
|
ai |
, |
|
|||
(Case 1) for x > |
|
, |
yi = |
|
, |
zi = |
|
− |
|
(5a) |
|||
βi |
ci |
pi |
βi |
||||||||||
(Case 2) for x = |
ai |
, |
0 < yi < |
bi |
, zi = 0 , |
|
|
|
(5b) |
||||
βi |
|
|
|
|
|||||||||
|
|
|
|
|
ci |
|
|
|
|
|
|||
(Case 3) for x < |
ai |
, |
yi = zi = 0 . |
|
|
|
|
(5c) |
|||||
βi |
|
|
|
|
|||||||||
|
|
|
|
|
|
|
|
|
|
|
|
|
|

7 Directional Evolution of Virus within a Host under Immune Selection |
161 |
Fig. 7.2. Graphical representation of (6) and Y = λ/x − d for a population before and after the invasion of a new strain. The model is given by (1a), (1b) and (4). Equation (6) is a step like function. Broken curve is for the population with strain 1 and strain 3. Solid curve is for the population with strain 2 is added. The curves with negative slopes are Y = λ/x − d with di erent λ. Horizontal axis is the abundance of uninfected cells x. P and Q are for the equilibrium corresponding to di erent λ, both including two strains. After invasion of strain 2, (6) would change to a solid curve. The equilibrium P remains the same on this graph, but now includes three strains. But the uninfected cell number (horizontal axis x) does not change. In contrast Q will shift to Q , and the strain 3 is replaced by strain 2 and the equilibrium number of uninfected cell x decreases (moves toward left) after invasion
On a (x, yi)–plane, with fixed Y , equilibrium condition (5) is represented as three straight lines with a step-like form yi is a continuous function of x except for a single point x = ai/βi, at which yi can take any value within an
interval 0 < yi < bi , which appears as a vertical line. Figure 7.2 illustrates
ci
an example. Equation (3) now becomes
n βibi |
H x − |
ai |
, |
|
|
Y = i=1 |
|
|
(6) |
||
ci |
βi |
||||
where H[x] = 1, for x ≥ 0 and H[x] = 0, for x < 0 is a Heaviside function. Equation (6) can be used except for ai/βi(i = 1, 2, . . . , n), at which one of yi is discontinuous. When the right hand side is discontinuous (x = ai/βi), we can interpret (6) as indicating that Y is between the limit from below and the limit from above of the right hand side.
We assume that species di er in discontinuous points (ai/βi). Then there is at most one species that might cross the curve if (4) and vertical line of x = ai/βi, all the other species are either x > ai/βi or x < ai/βi at equilibrium. This requires a slight modification to Proposition 1. There can be the situation in which a new strain invades successfully and replace the resident, and yet the abundance of uninfected cells x remains exactly the same as before. Graphical representation of (6) and Y = λ/x−d is shown in Fig. 7.2. Here equilibrium P did not change, and the equilibrium number of uninfected cells (x ) remains the same as before. But a new strain is added without
162 Yoh Iwasa et al.
extinction of the residents. In contrast, equilibrium Q would shift to Q after the invasion of strain 2, which causes the extinction of strain 3 and x becomes smaller than before. (Iwasa et al. 2004). However the equilibrium abundance of the uninfected cells should not increase after a successful invasion, it either
decreases or remains unchanged. As a result, the value of Y |
= |
n |
βiyi |
i=1 |
|||
either increases or remains unchanged after a successful invasion, |
respectively. |
||
|
|
|
|
We summarize the result as follows:
Proposition 2. If the invasion of a new strain is successful, the equilibrium abundance of uninfected cells x never decreases in the evolutionary change.
It never increases. The equilibrium total force of infection |
n |
β |
y |
|
either |
i=1 |
|
||||
increases or remains the same as before, respectively. |
i |
|
i |
|
|
A formal proof of this proposition 2 will be given later. |
|
|
|
|
|
7.4 Models of immune impairment
Before explaining the proof of the two propositions, we would like to explain other models that behave in a similar manner. We examine the models including the interaction between the immune reaction to di erent strains, such as cross-reactive immune impairment and cross–reactive immune activation, which were not covered in Iwasa et al. (2004).
[ Model 3 ]: Cross-reactive immune impairment
Consider the model of the virus-immunity dynamics, which is composed of (1a) and (1b), but using the following, instead of (1c):
dz |
|
|
1 + u |
n |
. |
|
|
|
|
|
|
||||
i |
= ciyi |
− |
bizi |
βj yj |
(7) |
||
dt |
|||||||
|
|
|
|
j=1 |
|
|
|
Equation (7) indicates that the decay rate is not a constant but an increas-
ing function of the total abundance of virus, bi |
1 + u |
n |
βj yj |
. This as- |
|
j=1 |
|||||
sumption represents that any viral strain |
impairs immune activity against |
||||
|
|
|
|
|
|
other viral strains. Based on a similar logic, we can prove Proposition 1 the same evolutionary trend to hold for the model given by (7), which includes cross-immunity (u > 0). Hence the successful invasion of a new strain always decreases the equilibrium abundance of uninfected cells, and always increases
|
|
n |
|
βiyi. |
|
|
|
the total force of infection i=1 |
|
|
|
||||
[ Model 4 ]:Same as Model 3 but with a proportional activation term |
|
||||||
We may consider the following dynamics of immune cells, |
|
||||||
|
dti = ciyi |
|
bi 1 + u |
n |
βj yj zi . |
(8) |
|
|
dz |
|
− |
|
|
|
|
|
|
j=1 |
|
||||
7 Directional Evolution of Virus within a Host under Immune Selection |
163 |
In this model, immune cells that are specific against virus mutant i are activated at a rate, ciyizi, which is proportional to the product of virus abundance and immune cell abundance (Nowak and Bangham 1996). The second
term within brackets of (8) implies that the mortality of immune cells in-
n
creases with general activity of viral load (u i=1 βiyi). This is also similar to a model by Regoes et al. (1998), but parameters ai, pi, ci were assumed common among strains (no su x) in Regoes et al., but they can di er between strains in (8).
The equilibrium abundance of yi can be expressed as a function of uninfected cell number x and the intensity of total immunity Y .
|
ai |
|
bi |
|
βi |
|
|
ai |
|||||
(Case 1) for x > |
|
, |
yi = |
|
(1 + uY ) , zi = |
|
(x |
− |
|
) (9a) |
|||
βi |
ci |
pi |
βi |
||||||||||
(Case 2) for x = |
ai |
, |
0 < yi < |
bi |
(1 + uY ) , |
zi = 0 |
|
|
(9b) |
||||
βi |
|
|
|
||||||||||
|
|
|
|
|
ci |
|
|
|
|
|
|
||
(Case 3) for x < |
ai |
, |
yi = zi = 0 |
|
|
|
|
|
(9c) |
||||
βi |
|
|
|
|
|
||||||||
|
|
|
|
|
|
|
|
|
|
|
|
|
|
The graphical representation is useful. On a (x, yi)-plane, with fixed Y , equilibrium condition (9) is represented as three straight lines with a step-like form, similar to (6). (3) now becomes
Y |
n βibi |
H x − |
ai |
+ . |
|
|
|
= i=1 |
|
|
(10) |
||
1 + uY |
ci |
βi |
||||
For this model we can prove Proposition 2. The equilibrium abundance of
the uninfected cells should not increase after a successful invasion, it either
n decreases or remains unchanged. As a result, the value of Y = i=1 βiyi also
either increases or remains unchanged after a successful invasion, respectively.
[ Model 5 ]: Impairment of immune cell activation
Regoes et al. (1998) also consider the case in which the immune system impairment appear as a factor reducing the rate of immune activation:
dzi |
|
|
|
ciyi |
|
|
|
|
|
|
= |
11 + u |
|
|
− |
bi |
zi . |
(11) |
|
dt |
|
j=1 |
βj yj |
|
2 |
|
|||
In this model, all virus mutants contribute with di erent e ciency, βj , to impairment of immune cell activation. For this model too, we can prove Proposition 2.
[Model 6]: Cross-reactive immune activation
In all the models of interaction between immune systems to di erent strains studied so far, the presence of a strain impairs the immune reaction of other
164 Yoh Iwasa et al.
strains. This may be plausible for HIV infection because infection of one strain would impair the general immune system.
A common way of interaction between di erent immune reactions is crossimmunity, in which an antigen stimulates the immune reaction of other antigens that are similar to the original one. To represent this, we consider
dz |
n |
|
|
|
|
11 + u i=1 |
|
2 |
|
|
|
dti = ciyi |
βiyi |
− bizi . |
(12) |
Here, the presence of any strain would reduce the equilibrium abundance of all the other strains. For dynamics with (1a), (1b), and (12), Proposition 1 holds. In fact, as we show later, the proof of the proposition is easier for cross-immunity models than the models with immune impairment.
[ Model 7 ]: Cross-immunity with an alternative form
We can also consider the following form:
dz |
1ciyi |
n |
|
|
|
|
11 + u i=1 βiyi |
2 |
|
2zi . |
|
||
dti = |
− bi |
(13) |
which is an alternative form of cross-immunity. For model with (1a), (1b), and (13), we can prove Proposition 2.
7.5 Proof of directional evolution
To prove the directionality of the evolutionary process, as stated in Propositions 1 and 2, we consider the following general model in which immune
reaction to di erent strains interact. Let Y = |
βiyi. |
|
||||
|
|
|
|
|
i A |
|
|
|
dx |
= λ − dx − xY , |
|
|
(14a) |
|
|
|
|
|
||
|
|
dt |
|
|
||
|
dyi |
= yifi(x, yi, Y, zi) , |
i = 1, 2, 3, . . . , n . |
(14b) |
||
|
|
dt |
||||
|
|
|
|
|
|
|
|
dzi |
= gi(x, yi, Y, zi) , |
i = 1, 2, 3, . . . , n . |
(14c) |
||
|
|
dt |
||||
|
|
|
|
|
|
|
Let A be a set of strains (A {1, 2, 3, . . . , n}). Suppose there is an equilibrium formed by a group of strains in set A. Let x and Y be the equilibrium number of uninfected cells and the total force of immunity. We further assume that, starting from any point in which all the strains in A have a positive abundance, it will converge to the equilibrium (i. e. it is globally stable).
From the dynamics given by (14b) and (14c), we can calculate yi and zi as a function of x and Y . In the situation for Proposition 1 to hold, such as