

files / 421_гис-2 / arcview 3.2a / avdocs / newin32
.pdfWhat’snewinArcViewGIS 21
Extensions
ArcView GIS extensions are add-on programs that provide specialized GIS functionality. When you load an extension, the ArcView GIS user interface changes to reflect the functionality available in the extension. Depending on the extension, new menus, buttons, tools, and dialog options will be available.
Extensions are loaded and unloaded using the Extensions dialog box. To access the Extensions dialog, choose Extensions from the File menu.
The following extensions are included with ArcView GIS:
3.2CAD Reader extension
CAD Reader extension has been upgraded to support AutoCAD® 2000 (Release 15) drawing and DXF™ files in ArcView GIS. The extension also supports 3D CAD drawings which can be used with the ArcView 3D Analyst™ extension, allowing you to add 3D CAD drawings directly into 3D Analyst (similar to any other 3D themes) for analysis and interactive perspective viewing.
The CAD Reader extension is not available on UNIX.
3.2Database Access extension
Database Access extension provides multiuser, client/server access to spatial and nonspatial data stored in relational databases. You can create database themes to see the spatial data, and database tables to see the nonspatial data in ArcView GIS.
Database Access 2.0 provides substantially enhanced access to ODBC compliant databases as well a significantly improved access to SDE. Database Access Version 2.0 is compatible with SDE 3.0.2 and 4.0.
In addition to selection support, selection enabled database tables now always display all of the records returned from a query instead of just an initial subset to which additional records can be added. The database table also exists entirely in memory and is no longer cached to disk. This is accomplished by maintaining a subset of records in memory and adjusting the subset as the table is scrolled.
whatsnewin32.p65 |
21 |
8/5/99, 9:26 AM |
22 What’snewinArcViewGIS
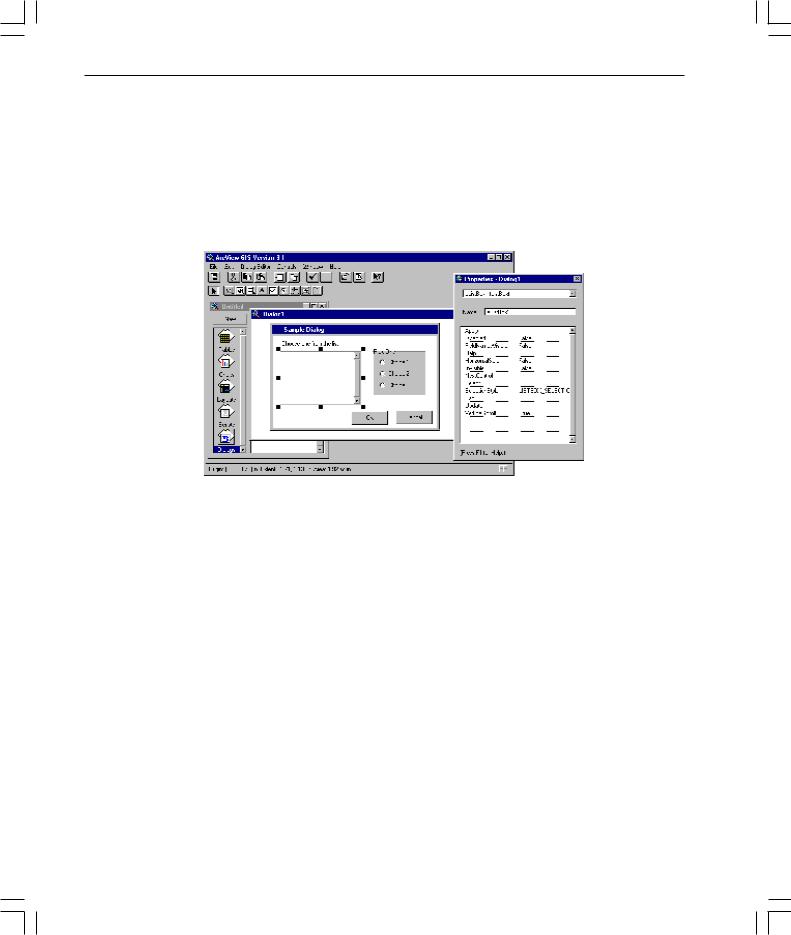
Dialog Designer extension
Dialog Designer extension provides Avenue developers with tools for customizing the ArcView GIS interface. With this extension, you can create specialized input forms, organize related tools in separate dialogs, add buttons directly to your view or layout, and link what’s displayed to your data. The extension supports the display of symbols in list and combo boxes. Multiple rows and columns in a list box are also supported. The Dialog Designer user guide is included with ArcView GIS 3.2.
Digitizer extension
Digitizer extension has been enhanced to support stream mode digitizing. Using this method, you click only the first vertex and simply trace over the feature on a paper map. When you complete tracing the feature, you click another button to end the line. ArcView GIS does the rest by automatically adding vertices based on a stream tolerance distance that you specify in the current map units. Stream mode digitizing makes it quick and easy to capture complex features, such as streams, rivers, and contours, off the paper map. When you load the Digitizer extension, ArcView GIS adds two new choices to the View menu: Stream Tolerance and Enable/Disable Stream Mode.
whatsnewin32.p65 |
22 |
8/5/99, 9:26 AM |
What’snewinArcViewGIS 23
StreamTolerance
When you trace features over the paper map in stream mode, ArcView GIS automatically adds vertices at a specified interval. You can set this interval in current map units and change the distance at any time, even while tracing an existing line. You can also specify the stream tolerance distance interactively using the Stream Tolerance tool  in the tool bar. (The Stream Tolerance tool allows you to perform the same functions interactively as the Stream Tolerance menu choice.)
Enable/Disable Stream Mode
This menu item allows you to switch between digitizing in point mode and the new enhanced method of digitizing in stream mode. The default option is point mode digitizing. You may also use the F3 function key to switch between the two modes.
For detailed information on how to digitize features in stream mode, refer to the ‘Digitizers, Stream mode digitizing’ topic in the ArcView GIS online help index.
The Digitizer extension is not available on UNIX.
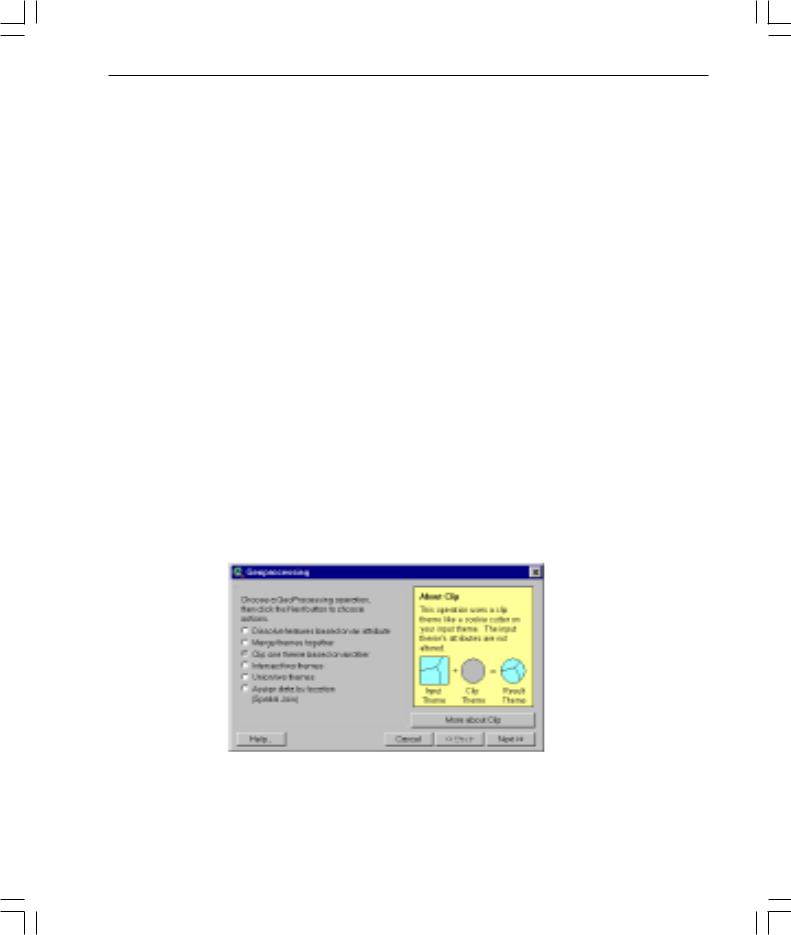
GeoProcessing extension
The wizard-based interface in this extension lets you perform some new spatial analysis functions in ArcView GIS. To access the GeoProcessing extension, load the extension using the Extensions dialog. Make sure a view is open and active. Then, from the View menu, choose GeoProcessing.
The following functions are provided:
whatsnewin32.p65 |
23 |
8/5/99, 9:26 AM |

24 What’snewinArcViewGIS
Dissolve features based on an attribute
This process will aggregate features in a theme based on an attribute of that theme. For example, Dissolve could be used to create a theme showing sales regions by salesperson, where each salesperson is responsible for several counties. Sales territories could be established by removing shared county boundaries from those counties represented by the same salesperson.
Merge themes together
This process will append two or more themes into one theme. The merge process will create a new theme using the fields from the theme you select. If the other themes you’re merging have more fields than the theme you have specified, those fields won’t be in the new theme’s table. If the other themes don’t have the same fields as the theme you’ve specified, empty cells will be added to the new theme’s table. You might merge several tiled county themes with census data to make a metropolitan area.
Clip one theme based on another
This process creates a new shapefile by using one theme (the clip theme) like a cookie cutter on another (the input theme). For instance, you might use a county boundary from a counties theme to clip a roads theme. This would create a new theme containing only the roads that fall inside the county boundary.
Intersect two themes
This process computes the geometric intersection of two themes and adds it to your view as a new theme. The two spatial data sets are integrated, but only the features that fall within the spatial extent common to both themes are preserved. For example, suppose you’re a builder and want to build a retirement center within the city boundaries. You want to create a theme that assigns land use information (like building codes) to your parcel data so you can look for areas meeting the requirements for multifamily dwellings.
Union two themes
The Union process creates a new theme by overlaying two polygon themes. The output theme contains the combined polygons and attributes of both themes. Suppose you want to analyze the erosion potential of soils in a given area. Some combinations of slope and soil type represent high risk for erosion and knowing where these conditions exist enables risk assessment of crops. You have one theme with boundaries of slope and another with soil type data. You use Union to create a new theme that contains the spatial combination of information with attribute data, permitting evaluation of erosion potential.
whatsnewin32.p65 |
24 |
8/5/99, 9:26 AM |
What’snewinArcViewGIS 25
Assign data by location
The assign data by location operation performs a spatial join between two selected themes. A spatial join is similar to an attribute join; however, it is based on the spatial relationship between the features in the two themes. For example, a travel agency concerned about client safety might assign data from a theme of hotels in a major city to a theme of crime events. The hotel data would be added to the crime event data, along with the distance to the hotel nearest the crime event. As a result, the hotels nearest the most crimes may not be recommended to the travel agency’s safety-conscious clientele.
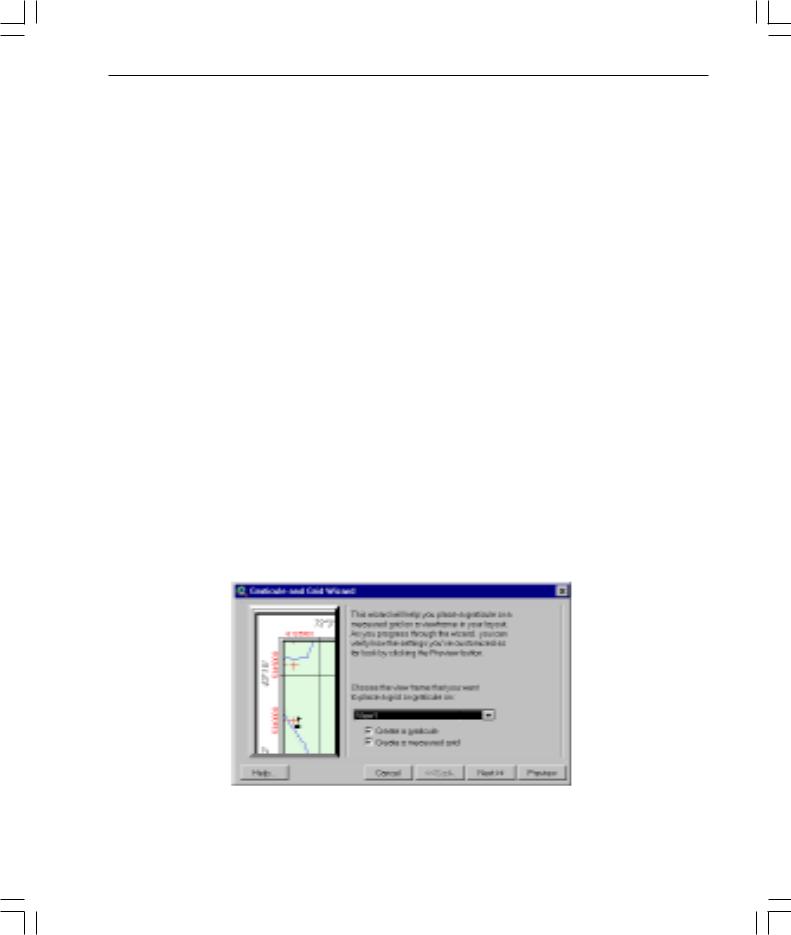
Graticules and Measured Grids extension
Graticules and grids are used to show latitude and longitude on a reference map such as a navigational chart, regional map, or a topographic map. Using a set of easy-to-use wizard panels, you’ll be able to create a grid, graticule, or both. If you’re not satisfied with the best-guess evaluation of ArcView GIS for settings, you can customize them yourself.
Customization options include the ability to show only graticule lines and labels or create a full or partial grid. There are also options for choosing the font style and size of your labels. The interval between graticule lines can be adjusted by changing the settings for degrees, minutes, and seconds. If you’re showing graticule lines, you can set the line width and color.
Like graticules, you can also adjust display settings for a measured grid. The grid interval, again, is initially estimated by ArcView GIS, but you can choose to display your grid as tics or as a set of intersecting lines. Line width, color of grid tics and lines, as well as font, font size, and style for labels can be adjusted as desired. Border options, including line color and style, are also available.
whatsnewin32.p65 |
25 |
8/5/99, 9:26 AM |
26 What’snewinArcViewGIS
To access the Graticules and Measured Grids extension, load the extension using the Extensions dialog. You must have at least one view frame in your layout before the Graticules and Measured Grids extension is enabled. Click the Graticule and Measured Grids button  on the ArcView GIS tool bar to display the first wizard panel.
ERDAS IMAGINE Image extension
This extension provides support for ERDAS IMAGINE® images. ArcView GIS currently supports ERDAS IMAGINE 8.3.1 libraries on the PC and the 8.3 libraries on UNIX.
JPEG (JFIF) Image Support extension
This extension provides support for JFIF images, the public domain image file format for JPEG compressed images.
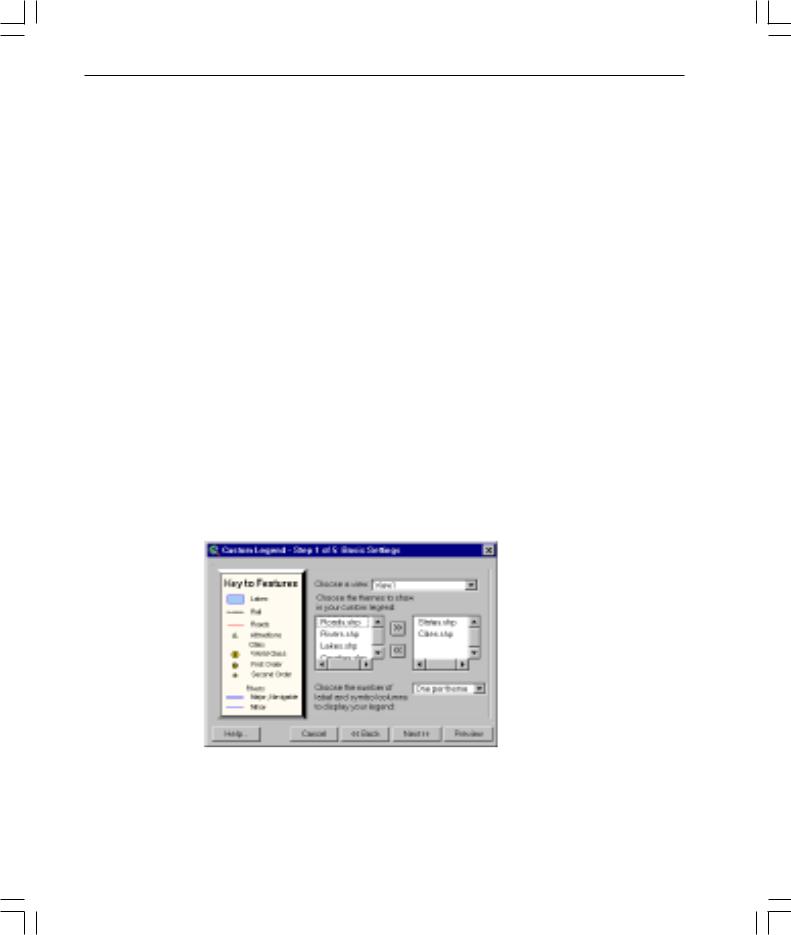
Legend Tool extension
This extension allows you to create a custom graphical legend in a layout using a set of user-friendly wizard panels. You can create a legend for any view in your project, choose which themes you want shown, and select how many columns to use to display symbols and labels. Other panels allow you to change legend titles, choose settings for legend borders, designate how legend symbols are represented, and set the spacing between legend elements. You can preview your legend at any time. This extension is derived from the previous sample extension, MapTools.
To use the Legend Tool, select the Legend Tool extension from the Extensions dialog. The Legend tool  will appear on the tool bar once you have a layout that contains one or more views. Click the Legend tool, then the layout.
whatsnewin32.p65 |
26 |
8/5/99, 9:26 AM |
What’snewinArcViewGIS 27
Military Data Reader extensions
The Military Data Reader extensions allow ArcView GIS to recognize a variety of image data formats, typically of interest to the defense/intelligence community, as direct read image data sources. No translation is required to use these image data sources. Once the proper extension for each image format is loaded, you can use these image data sources with ArcView GIS like any other supported image data source. The Military Data Reader consists of multiple extensions that you can use in any combination. These extensions include support for the following formats:
•ARC Digitized Raster Graphics (ADRG Image Support extension)
•Compressed ARC Digitized Raster Graphics (CADRG Image Support extension)
•Controlled Image Base (CIB Image Support extension)
•National Image Transfer Format (NITF Image Support extension)
MrSID Image Support extension
MrSID™ is a multiresolution wavelet-based image format that allows a high compression ratio and fast access of large amounts of image data at any scale. Support for the MrSID image format was added as an example of using the ImgDLL class that allows image formats to be added to ArcView GIS. When you load the MrSID Image Support extension, you can add .sid files to views as image themes.
3.2Report Writer extension
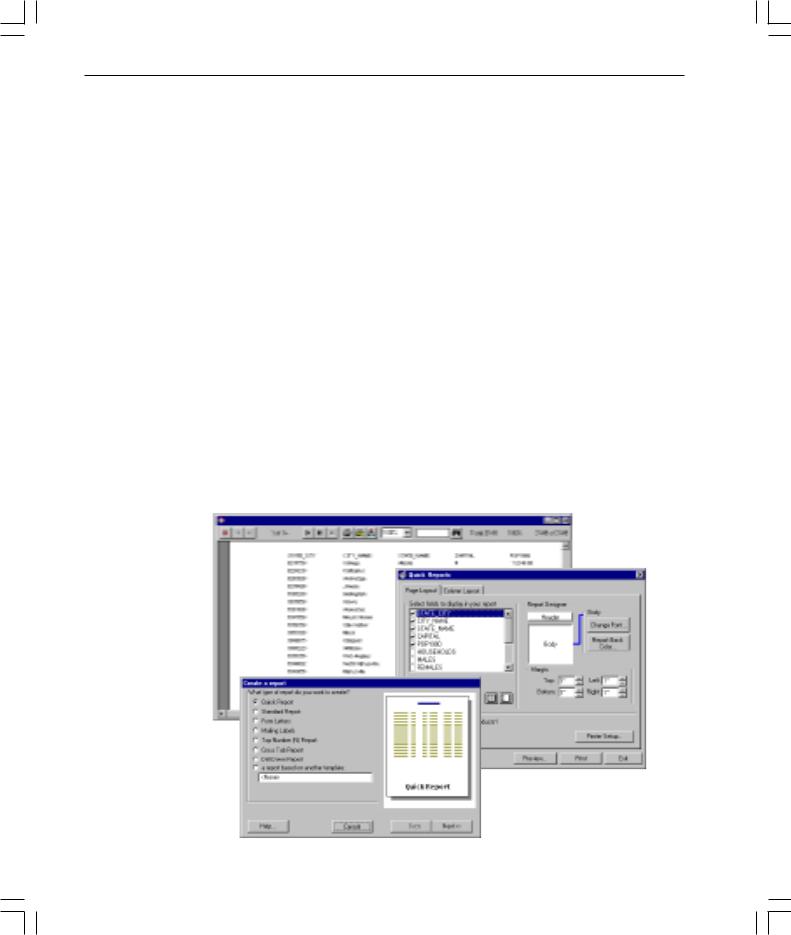
The Report Writer extension integrates the industry-leading Seagate Software’s Crystal Reports reportgenerating and editing application with the existing ArcView GIS Table, View, and Project user interface. The goal of the ArcView GIS Report Writer interface is to streamline the process of data selection and preparation for the reporting process. ArcView GIS provides a Report wizard that lets you choose the type of report you want, choose whether you want to use all the records in the table or only the selected records, and specify the output report name. Then the Report wizard will start the Seagate Software’s Crystal Reports application with your data already loaded so you can easily continue designing your report.
ArcView GIS 3.2 includes Seagate Software’s Crystal Reports 7.
whatsnewin32.p65 |
27 |
8/5/99, 9:26 AM |
28 What’snewinArcViewGIS
With the ArcView GIS Report wizard, you can choose one of the following report types:
•Quick Report
•Standard Report
•Form Letters
•Mailing Labels
•Top Number (N) Report
•Cross Tab Report
•Drill Down Report
•A report based on another template
Note: If you do not have Seagate Software’s Crystal Reports installed on your system, you can still create a simple report with ArcView GIS using Quick Reports. The Quick Reports option does not use Seagate Software’s Crystal Reports and is available after any installation of ArcView GIS. The Quick Reports interface provides basic tools for selection and organization of fields; setting fonts, column width, and row heights to be used in the report; and previewing and printing the report.
The Report Writer extension is not available on UNIX.
whatsnewin32.p65 |
28 |
8/5/99, 9:26 AM |

What’snewinArcViewGIS 29
TIFF 6.0 Image Support extension
TIFF 6.0 Image Support extension allows you to add version 6.0 TIFF files to views as image themes and place them on layouts in pictures frames. TIFF 6.0 image support includes the use of GeoTIFF 1.0 tags to properly place the image in the proper geographic space, if present.
VPF Viewer extension
VPF Viewer extension allows you to work with vector product format (VPF) data in ArcView GIS. Using this extension, you can integrate VPF databases into your work seamlessly without having to convert these files into ArcView GIS shapefile format.
The VPF Direct Read function has been given the ability to add valid 3D VPF themes as 3D type files. A Valid 3D VPF theme is one where there are no null Z values present in the coordinate geometry. If any null values are found in the geometry, the theme will be added to the view as a 2D type file. The VPF Direct Reader will automatically detect whether a VPF theme is 3D and add it accordingly. To view the shapefiles in full 3D, you must have the 3D Analyst extension loaded.
whatsnewin32.p65 |
29 |
8/5/99, 9:26 AM |

30 What’snewinArcViewGIS
whatsnewin32.p65 |
30 |
8/5/99, 9:26 AM |