

files / 421_гис-2 / arcview 3.2a / avdocs / newin32
.pdfWhat’snewinArcViewGIS 11
Data integration utilities
3.2SDTS Data Import
ArcView GIS 3.2 includes a new data import utility that will import Spatial Data Transfer Standard (SDTS) raster and point data and creates ESRI GRID files and ArcView GIS point shapefiles respectively.
3.2DXF Export
ArcView GIS 3.2 includes a data conversion utility providing shape to DXF output.
For more information regarding SDTS Data Import or DXF Export, please see the ‘What’s New’ book in the online help system.
whatsnewin32.p65 |
11 |
8/5/99, 9:26 AM |

12 What’snewinArcViewGIS
whatsnewin32.p65 |
12 |
8/5/99, 9:26 AM |
What’snewinArcViewGIS 13
Creating and editing spatial data
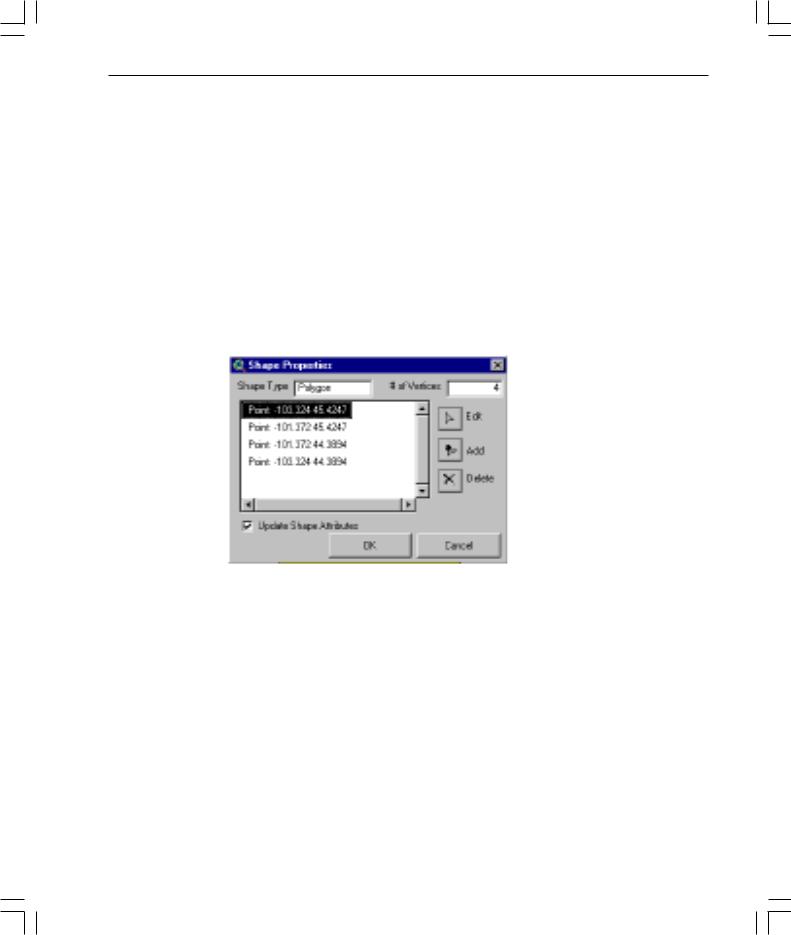
Shape Properties dialog
This dialog was added to ArcView GIS to support the interactive addition, deletion, and editing of shape vertices. The main dialog identifies the type of shape, number of vertices, and presents a list of vertices within a shape. You can choose to add a vertex to a shape or select multiple vertices and delete them. The dialog is available from a rightclick popup menu when a shape is selected and editable.
Snap tolerance cursor
When either general or interactive snapping is turned on, you now have the option of displaying a circle representing the snap tolerance with the cursor as you create polylines, polygons, or edit vertices. This is known as the snap tolerance cursor. If general snapping is turned on, the circle represents the general snap tolerance. If interactive snapping is also turned on, the circle will change to the interactive snap tolerance when you choose an interactive snap rule. By default, the snap tolerance cursor is turned on when snapping is turned on. You can turn the snap tolerance cursor off in the Editing panel of the Theme Properties dialog or by using the Show/Hide Snap Tolerance Cursor toggle on the View’s popup menu.
For more information about the snapping environment in ArcView GIS, refer to the ‘snapping’ topic in the ArcView GIS online help index.
whatsnewin32.p65 |
13 |
8/5/99, 9:26 AM |
14 What’snewinArcViewGIS
Introducing measured and 3D shapes
ArcView GIS 3.1 provides support for measured and 3D data by extending existing ArcView GIS shape classes and providing an Avenue API for accessing the measure and elevation values.
This means that data created by users of the ArcView 3D Analyst extension can be displayed and queried in 2D by all users of ArcView GIS 3.1.
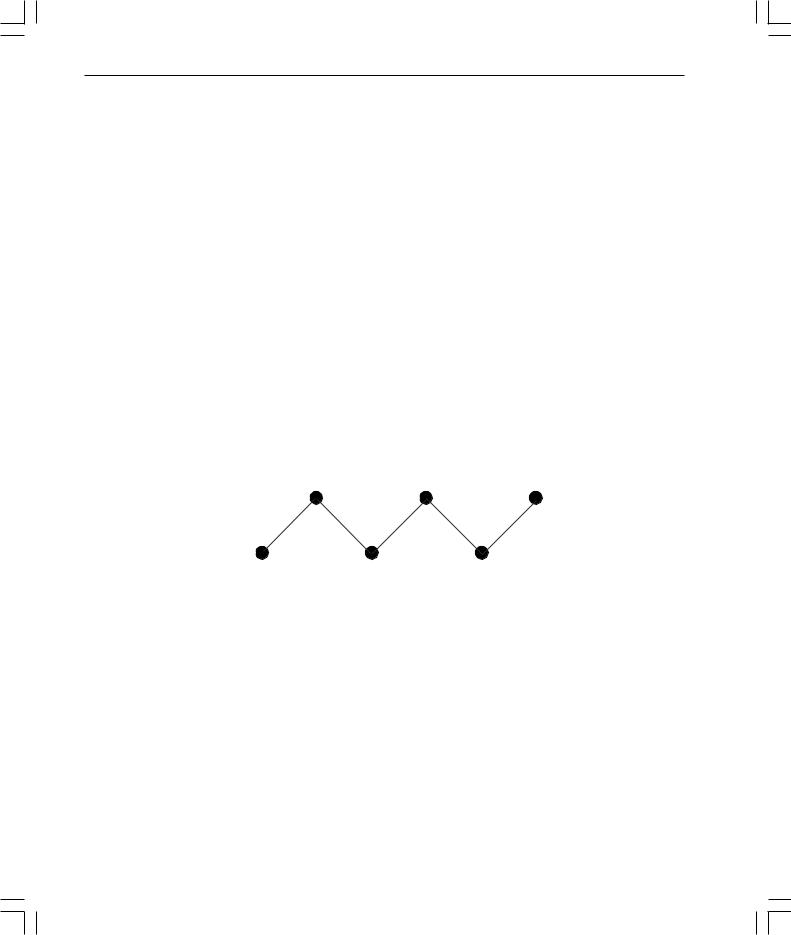
What are measured and 3D shapes?
ArcView GIS has always stored geometric shapes using x,y coordinates. Points are recorded as a single x,y coordinate pair, lines as a series of ordered x,y coordinates, and areas (polygons) as a series of x,y coordinates defining a set of line segments that have the same start and end points.
ArcView GIS has extended the way it stores shapes. Instead of simply storing x,y coordinates that define a shape, a shape can additionally store a measure value ‘m’ and/or an elevation value ‘z’ at each x,y. Therefore, one or more (x,y,m), (x,y,z), or (x,y,z,m) coordinates can represent each geometric feature.
5,5 |
15,5 |
25,5 |
z = 2 |
z = 3 |
z = 3 |
m = 2 |
m = 6 |
m = 9 |
0,0 |
10,0 |
20,0 |
z = 3 |
z = 3 |
z = 2 |
m = 0 |
m = 5 |
m = 7 |
To learn more about extended shapes and special considerations for Avenue programmers, refer to the ArcView GIS online help ‘What’s new’ topic, ‘Support for measured and 3D shapes’.
whatsnewin32.p65 |
14 |
8/5/99, 9:26 AM |
What’snewinArcViewGIS 15
Improved support for dynamic segmentation
All dynamic segmentation functionality available for coverage route systems in previous versions of ArcView GIS is now available on measured PolyLine shapefiles (that is, a PolyLineM or a PolyLineZ with the optional measure values attached).
The extended dynamic segmentation functionality includes the following:
•The DynName class now accepts a measured PolyLine shapefile FTab on the Make request.
•The Add Event Theme dialog now recognizes measured PolyLine shapefiles— that is, event themes can be defined on measured shapes.
•The FTab requests ReturnLocation and ReturnRouteMeasure now work on measured PolyLine shapefiles.
•The Export request on the FTab class can now convert an ARC/INFO coverage route system into a measured (PolyLineM) shapefile.
whatsnewin32.p65 |
15 |
8/5/99, 9:26 AM |

16 What’snewinArcViewGIS
whatsnewin32.p65 |
16 |
8/5/99, 9:26 AM |

What’snewinArcViewGIS 17
Tables
What's new for SQL Connect
With PC versions of ArcView GIS, error messages returned from an ODBC driver are now appended to a file called ODBC.errlog located in the ArcView GIS home directory. Error messages associated with incorrect login information, select statement syntax errors, or attempting to perform an invalid database operation are normally returned from a driver. If the ODBC.errlog file does not exist, you will get a message stating that the file has been created the first time a driver returns an error message. Below is an example of an error message that may appear in this file.
Call to SQLPrepare received error ODBC API function called
Received: SQL_ERROR Return code from the ODBC function
Return code: -1
State: S0022 ODBC error code— If you have ODBC API documentation, you can retrieve more information about the problem by looking up this SQL State.
Error: [INTERSOLV][ODBC Oracle driver][Oracle]ORA-00904: invalid column name Error code and error message from the database
File: ..\sql\ntcur.c ArcView source code reference
Line: 313
Please also see ‘Database Access’ in the Extension section of this booklet.
whatsnewin32.p65 |
17 |
8/5/99, 9:26 AM |
18 What’snewinArcViewGIS
whatsnewin32.p65 |
18 |
8/5/99, 9:26 AM |
What’snewinArcViewGIS 19
Printing and layouts
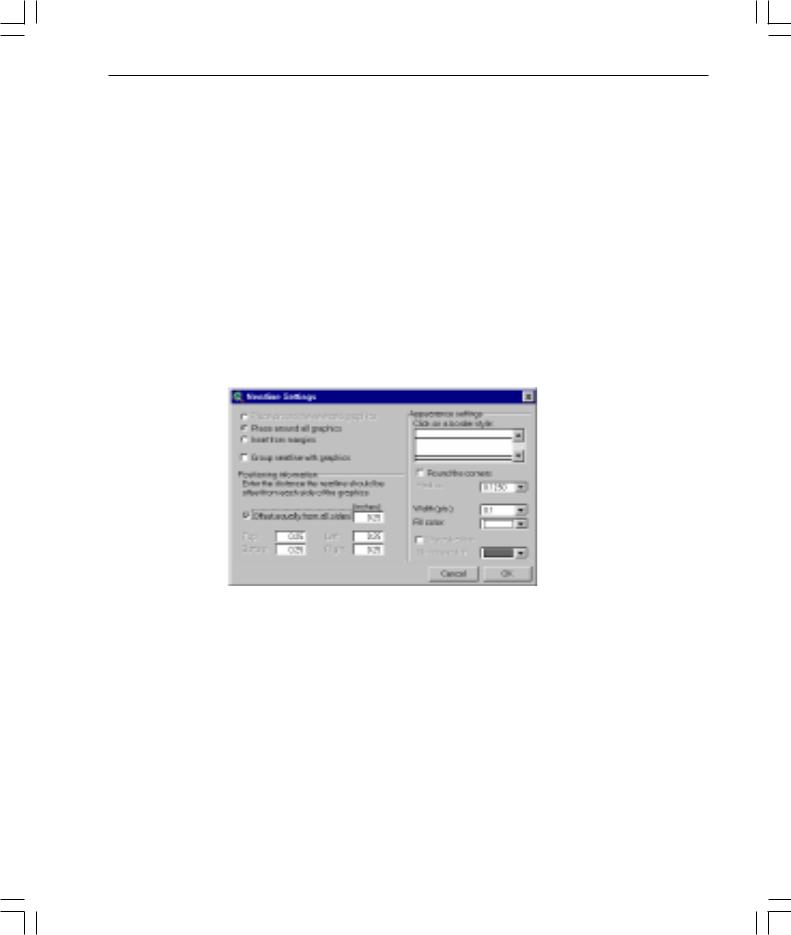
Neatline button
A neatline is a line that defines the map’s frame and a border is composed of an additional line or lines which are parallel to it. They are often used to provide the outer limit of the map or just to provide a decorative element.
This release adds a new Neatline button to its layout interface that provides several options for adding a neatline to your map. You can control the placement of a neatline by specifying whether it should be drawn around all graphics, selected graphics, or inset from the margins of a page. You can also vary the appearance of a neatline by changing its line style, width, and corner shape. Additionally, you can add background color and drop shadows.
To create neatlines and borders on your layout, use the Neatline button  available in the button bar. Once selected, the neatline dialog will appear.
Layouts can be exported into JPEG format
Layouts can now be exported into JPEG format.
whatsnewin32.p65 |
19 |
8/5/99, 9:26 AM |

20 What’snewinArcViewGIS
whatsnewin32.p65 |
20 |
8/5/99, 9:26 AM |