
H1 2013 Results Presentation
.pdf
H1 2013 Financial Results
29 August 2013

Disclaimer
This document does not constitute or form part of and should not be construed as, an offer to sell or issue or the solicitation of an offer to buy or acquire securities of
EVRAZ plc (“EVRAZ”) or any of its subsidiaries in any jurisdiction (including, without limitation, EVRAZ Group S.A.) (collectively, the “Group”) or an inducement to enter into investment activity. No part of this document, nor the fact of its distribution, should form the basis of, or be relied on in connection with, any contract or commitment or investment decision whatsoever. No representation, warranty or undertaking, express or implied, is made as to, and no reliance should be placed on, the fairness, accuracy, completeness or correctness of the information or the opinions contained herein. None of EVRAZ, the Group or any of its affiliates, advisors or representatives shall have any liability whatsoever (in negligence or otherwise) for any loss howsoever arising from any use of this document or its contents or otherwise arising in connection with the document.
This document contains “forward-looking statements”, which include all statements other than statements of historical facts, including, without limitation, any statements preceded by, followed by or that include the words “targets”, “believes”, “expects”, “aims”, “intends”, “will”, “may”, “anticipates”, “would”, “could” or similar expressions or the negative thereof. Such forward-looking statements involve known and unknown risks, uncertainties and other important factors beyond the
Group’s control that could cause the actual results, performance or achievements of the Group to be materially different from future results, performance or achievements expressed or implied by such forward-looking, including, among others, the achievement of anticipated levels of profitability, growth, cost and synergy of recent acquisitions, the impact of competitive pricing, the ability to obtain necessary regulatory approvals and licenses, the impact of developments in the Russian economic, political and legal environment, volatility in stock markets or in the price of the Group’s shares or GDRs, financial risk management and the impact of general business and global economic conditions.
Such forward-looking statements are based on numerous assumptions regarding the Group’s present and future business strategies and the environment in which the Group will operate in the future. By their nature, forward-looking statements involve risks and uncertainties because they relate to events and depend on circumstances that may or may not occur in the future. These forward-looking statements speak only as at the date as of which they are made, and each of EVRAZ and the Group expressly disclaims any obligation or undertaking to disseminate any updates or revisions to any forward-looking statements contained herein to reflect any change in EVRAZ’s or the Group’s expectations with regard thereto or any change in events, conditions or circumstances on which any such statements are based.
Neither the Group, nor any of its agents, employees or advisors intends or has any duty or obligation to supplement, amend, update or revise any of the forwardlooking statements contained in this document.
The information contained in this document is provided as at the date of this document and is subject to change without notice.
H1 2013 Financial Results |
1 |

Highlights
Overview of H1 2013 Results
Liquidity and Financial Position
Segmental and Geographical Results
Capex and Investment Projects
Summary
H1 2013 Financial Results |
2 |

Overview of H1 2013 Results
HSE Performance
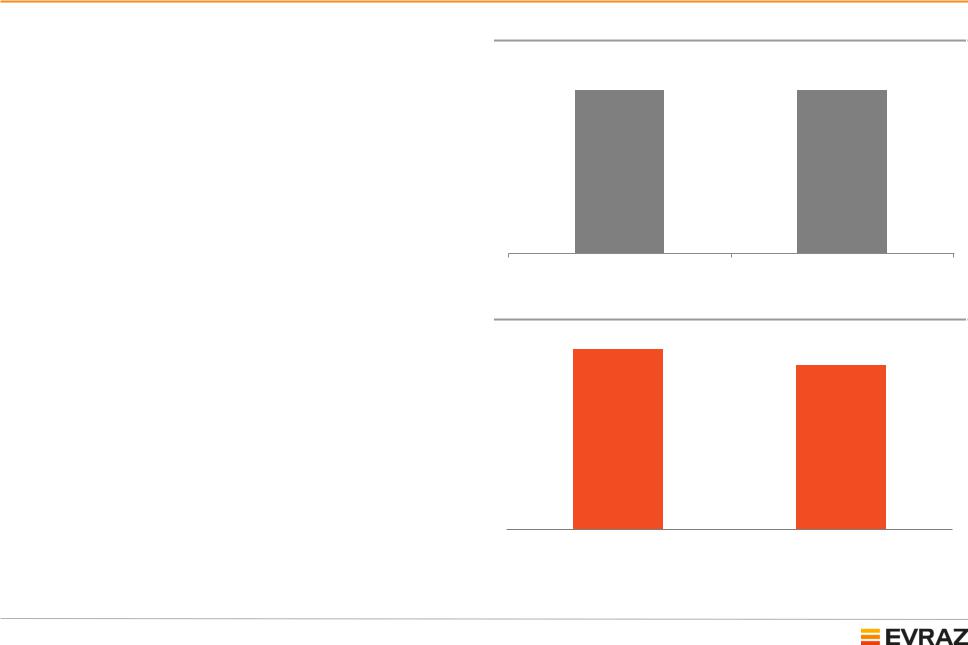
Safety remains a key priority
10 fatalities recorded in H1 2013
Slips, trips and falls are the principal causes of injuries recorded in H1 2013
Actions:
New safety standard for walkways has been developed that will be comprehensively implemented at the Company’s production sites in H2 2013
Workplace lighting is being upgraded
More effective internal communication channels will be utilised in order to further improve our commitment to a zero-tolerance policy in respect of breaches of basic safety rules
Lost Time Injury Frequency Rate (LTIFR)*
2.05 |
2.06 |
H1 2012 |
H1 2013 |
Fatalities |
|
11 |
|
|
10 |
H1 2012 |
H1 2013 |
*Calculated as number of lost working hours due to injuries per 1 million hours worked
H1 2013 Financial Results |
4 |

H1 2013 summary
US$ million unless otherwise stated |
H1 2013 |
H1 2012 |
Change |
|
|
|
|
Revenue |
7,362 |
7,619 |
(3)% |
|
|
|
|
EBITDA* |
939 |
1,184 |
(21)% |
|
|
|
|
EBITDA margin |
12.8% |
15.5% |
(2.6)% |
|
|
|
|
Net loss |
(122) |
(46) |
n.a. |
|
|
|
|
Operating cash flow |
628 |
1,089 |
(42)% |
|
|
|
|
Capex |
492 |
565 |
(13)% |
|
|
|
|
Cash and short-term deposits |
1,563 |
2,064 |
(24)% |
|
|
|
|
Free cash flow |
(87) |
366 |
(128)% |
|
|
|
|
Total debt** |
8,606 |
8,440 |
2% |
|
|
|
|
Net debt** |
7,043 |
6,376 |
10% |
|
|
|
|
Steel sales volumes*** (‘000 t) |
7,753 |
7,714 |
1% |
|
|
|
|
*EBITDA represents profit from operations plus depreciation, depletion and amortisation, impairment of assets, foreign exchange loss gain) and loss (gain) on disposal of property, plant and equipment and intangible assets
**Under new approach, as at 30 June 2013 and 31 December 2012 respectively. Please refer to slides 32-33 for Total and Net debt calculations. Total debt represents nominal value of loans and borrowings plus unpaid interest, finance lease liabilities, Nominal effect of cross-currency swaps on principal of roubledenominated notes. Net debt represents Total debt less cash and liquid short-term financial assets, including those relating to disposal groups classified as held for sale.
***Here and throughout this presentation segment sales data refer to external sales unless otherwise stated
H1 2013 Financial Results |
5 |
H1 2013 financial highlights
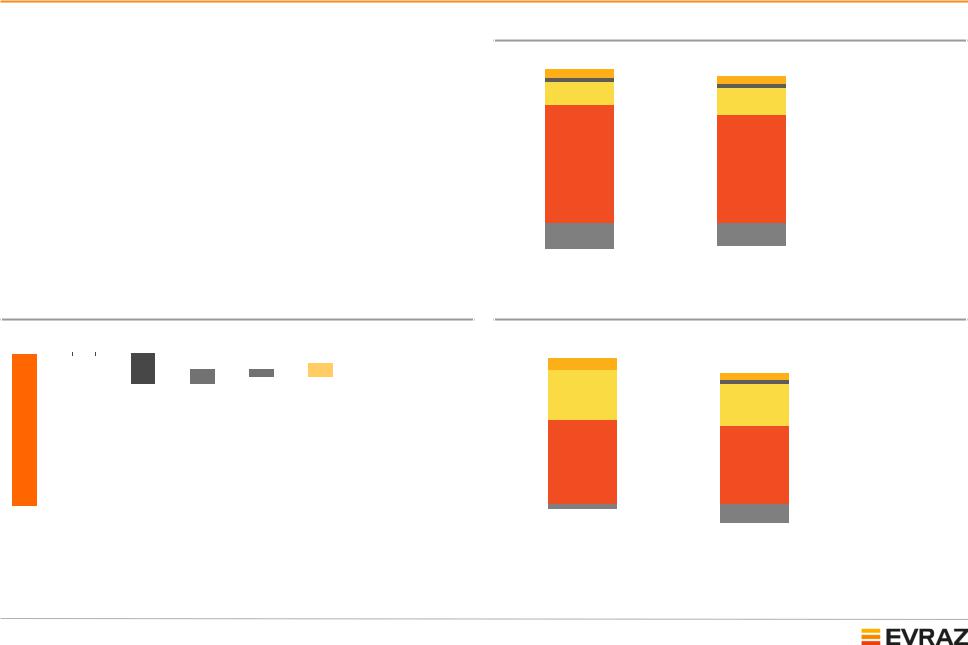
Consolidated revenue decreased primarily due to lower sales prices, in line with general trends in the global steel industry
H1 2013 EBITDA reflects lower prices of steel products, in particular in Europe and the US, and larger share of semi-finished products in the product mix due to rail mill modernisation at EVRAZ ZSMK
The negative impact on EBITDA from decreased revenue was partly offset by lower costs of raw materials
Consolidated revenue by segment, $m
7,619 |
7,362 |
|
|
|
|
||
541 |
|
|
|
|
|||
465 |
|
|
|
|
|||
263 |
|
|
|
|
|||
268 |
|
|
|
|
|||
1,383 |
|
|
|
|
|||
1,622 |
|
|
|
Other operations |
|||
|
|
|
|
|
|||
|
|
|
|
|
|||
|
|
|
|
|
|
|
Vanadium |
|
|
|
|
|
|
|
|
|
|
|
|
|
|
|
|
7,019 |
6,416 |
|
|
|
Mining |
||
|
|
|
|||||
|
|
|
|||||
|
|
|
|
||||
|
|
|
|
|
Steel |
||
|
|
|
|
|
|
|
|
|
|
|
|
|
|
|
|
|
|
|
|
|
|
|
|
|
|
|
|
|
|
|
Eliminations |
|
|
|
|
|
|
|
|
|
|
|
|
|
|
|
|
|
|
|
|
|
|
|
|
(1,587) |
(1,409) |
|
|
|
|
||
|
H1 2012 |
|
H1 2013 |
|
|
|
|
Revenue drivers, $m
7,619 |
32 |
|
225 |
|
|
|
246 |
7,362 |
|||
|
|
|
|||
|
|
|
|
|
|
|
|
|
|
|
|
|
|
|
(103) |
|
|
|
|||
(524) |
(133) |
|
|
|
|
|
|||
|
|
|
|
|
|
|
|||
|
|
|
|
|
|
|
|
|
|
|
|
|
|
|
|
|
|
|
|
Revenue Volumes, |
Prices, |
Volumes, |
Prices, |
AcquisiDisposals Revenue |
||
H1 2012 steel |
steel |
mining |
mining |
tions, |
& |
H1 2013 |
|
|
|
|
mining |
other |
|
Consolidated EBITDA by segment, $m
1,184 |
|
|
|
|
|
|
|
94 |
939 |
|
|
|
|
||
4 |
61 |
|
|
|
Other operations |
||
419 |
34 |
|
|
|
|||
|
|
|
|||||
|
|
|
|||||
354 |
|
|
|
|
|||
|
|
|
|
|
Vanadium |
||
|
|
|
|
|
|||
|
|
|
|
|
|
|
|
706 |
|
|
|
|
|
Mining |
|
|
|
|
|
|
|||
|
|
|
|
|
|||
651 |
|
|
|
Steel |
|||
|
|
|
|||||
|
|
|
|
|
|||
|
|
|
|
|
|
|
Eliminations and |
|
|
|
|
|
|
|
|
|
|
|
|
|
|
|
|
|
|
|
|
|
|
|
unallocated |
(39) |
(161) |
|
|
|
|||
|
|
|
|
||||
|
|
|
|
|
|
||
|
H1 2012 |
|
H1 2013 |
|
|
|
|
H1 2013 Financial Results |
6 |
Cost of revenue
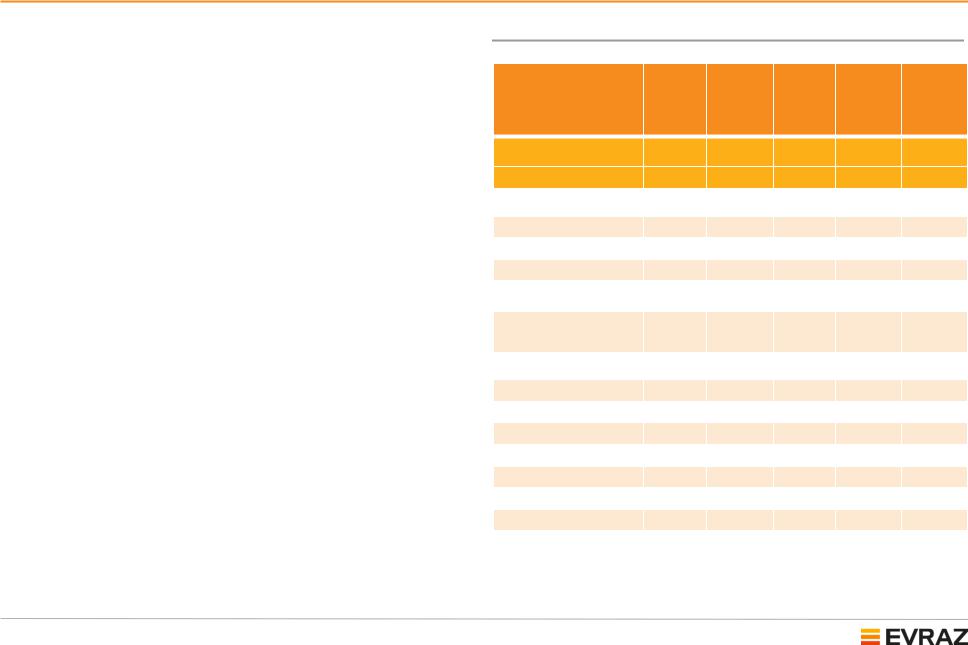
In H1 2013 cost of revenue decreased by 2% vs. H1 2012 despite consolidation of Raspadskaya
Raw material costs declined by 20% and depreciation by 19%, but were partially offset by higher staff, transportation and other costs
Lower coking coal and scrap costs resulted from lower volumes of purchases of coal and scrap from market, higher intragroup coal supplies by Yuzhkuzbassugol, lower coal and scrap prices
Staff costs are higher by 16% driven by
Raspadskaya’s consolidation and higher wages at certain operations
Transportation costs increased following
EvrazTrans’ disposal, the consolidation of
Raspadskaya and change in intragroup delivery terms of iron ore from FCA to CPT
Decrease in depreciation is mainly due to lower depletion expense at Yuzhkuzbassugol
Consolidated cost of revenues by cost elements, $m
Item |
H1 |
% of |
H1 |
% of |
Relative |
|
2013 |
revenue |
2012 |
revenue |
change |
||
|
||||||
Revenue |
7,362 |
|
7,619 |
|
(3)% |
|
Cost of revenue |
5,877 |
80% |
6,020 |
79% |
(2)% |
|
Raw materials, incl. |
1,811 |
25% |
2,222 |
29% |
(20)% |
|
Iron ore |
369 |
5% |
330 |
4% |
2% |
|
Coking coal |
362 |
5% |
620 |
8% |
(42)% |
|
Scrap |
710 |
10% |
925 |
12% |
(23)% |
|
Other |
370 |
5% |
347 |
5% |
7% |
|
Semi-finished |
216 |
3% |
225 |
3% |
(4)% |
|
products |
||||||
|
|
|
|
|
||
Auxiliary materials |
505 |
7% |
447 |
6% |
13% |
|
Services |
368 |
5% |
332 |
4% |
21% |
|
Goods for resale |
301 |
4% |
259 |
3% |
16% |
|
Transportation |
454 |
6% |
379 |
5% |
20% |
|
Staff costs |
985 |
13% |
847 |
11% |
16% |
|
Depreciation |
486 |
7% |
602 |
8% |
(19)% |
|
Electricity |
295 |
4% |
278 |
4% |
6% |
|
Natural gas |
225 |
3% |
216 |
3% |
4% |
|
Other costs* |
231 |
3% |
213 |
3% |
8% |
Source: Management accounts
*Includes auxiliary materials, services, goods for resale, taxes, change in WIP and FG
H1 2013 Financial Results |
7 |
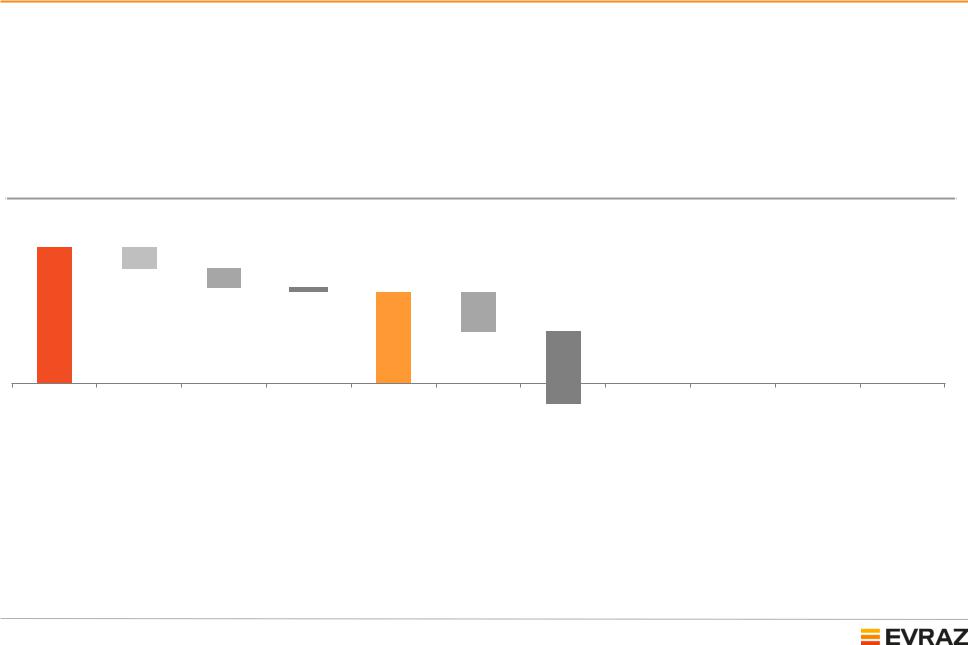
H1 2013 FCF generation
Cash flows from operating activities after changes in working capital fell by 42.3% in H1 2013 to U$628m reflecting lower product prices compared to H1 2012
Investment in working capital was due to seasonality of our business
As a result, there was a free cash outflow for the period of $87m
US$ million
939
628
(150)
(126) (35)
(273)
66
|
|
|
|
|
|
(492) |
EBITDA |
Changes in |
Income tax |
Other |
Cash flows |
Interest and |
Capex |
|
working |
paid |
|
from |
similar |
|
|
capital |
|
|
operating |
payments |
|
|
|
|
|
activities |
|
|
|
|
|
|
|
|
|
|
|
|
|
|
|
|
|
(1) |
|
(15) |
|
(87) |
|
|||
|
|
|
|
|
|
||||||
Purchases of |
Proceeds |
CF from other |
Free cash |
||||||||
subsidiaries, |
from sale of |
investing |
|
flow |
|||||||
net of cash |
disposal |
activities |
|
|
|
||||||
acquired |
groups |
|
|
|
|
|
|
||||
|
|
|
classified as |
|
|
|
|
|
|
||
|
|
|
held for sale, |
|
|
|
|
|
|
||
|
|
|
|
net of |
|
|
|
|
|
|
|
|
|
|
transaction |
|
|
|
|
|
|
||
|
|
|
|
costs |
|
|
|
|
|
|
|
H1 2013 Financial Results |
8 |

Liquidity and Financial Position
