H1 2014 Results Presentation_final
.pdf
H1 2014 Financial Results
27 August 2014

Disclaimer
This document does not constitute or form part of and should not be construed as, an offer to sell or issue or the solicitation of an offer to buy or acquire securities of
EVRAZ plc (“EVRAZ”) or any of its subsidiaries in any jurisdiction (including, without limitation, EVRAZ Group S.A.) (collectively, the “Group”) or an inducement to enter into investment activity. No part of this document, nor the fact of its distribution, should form the basis of, or be relied on in connection with, any contract or commitment or investment decision whatsoever. No representation, warranty or undertaking, express or implied, is made as to, and no reliance should be placed on, the fairness, accuracy, completeness or correctness of the information or the opinions contained herein. None of EVRAZ, the Group or any of its affiliates, advisors or representatives shall have any liability whatsoever (in negligence or otherwise) for any loss howsoever arising from any use of this document or its contents or otherwise arising in connection with the document.
This document contains “forward-looking statements”, which include all statements other than statements of historical facts, including, without limitation, any statements preceded by, followed by or that include the words “targets”, “believes”, “expects”, “aims”, “intends”, “will”, “may”, “anticipates”, “would”, “could” or similar expressions or the negative thereof. Such forward-looking statements involve known and unknown risks, uncertainties and other important factors beyond the
Group’s control that could cause the actual results, performance or achievements of the Group to be materially different from future results, performance or achievements expressed or implied by such forward-looking, including, among others, the achievement of anticipated levels of profitability, growth, cost and synergy of recent acquisitions, the impact of competitive pricing, the ability to obtain necessary regulatory approvals and licenses, the impact of developments in the Russian economic, political and legal environment, volatility in stock markets or in the price of the Group’s shares or GDRs, financial risk management and the impact of general business and global economic conditions.
Such forward-looking statements are based on numerous assumptions regarding the Group’s present and future business strategies and the environment in which the Group will operate in the future. By their nature, forward-looking statements involve risks and uncertainties because they relate to events and depend on circumstances that may or may not occur in the future. These forward-looking statements speak only as at the date as of which they are made, and each of EVRAZ and the Group expressly disclaims any obligation or undertaking to disseminate any updates or revisions to any forward-looking statements contained herein to reflect any change in EVRAZ’s or the Group’s expectations with regard thereto or any change in events, conditions or circumstances on which any such statements are based.
Neither the Group, nor any of its agents, employees or advisors intends or has any duty or obligation to supplement, amend, update or revise any of the forwardlooking statements contained in this document.
The information contained in this document is provided as at the date of this document and is subject to change without notice.
H1 2014 Financial Results |
1 |

Highlights
Overview of H1 2014 Results
Liquidity and Financial Position
Segmental and Geographical Results
Capex and Investment Projects
Summary
H1 2014 Financial Results |
2 |

Overview of H1 2014 Results

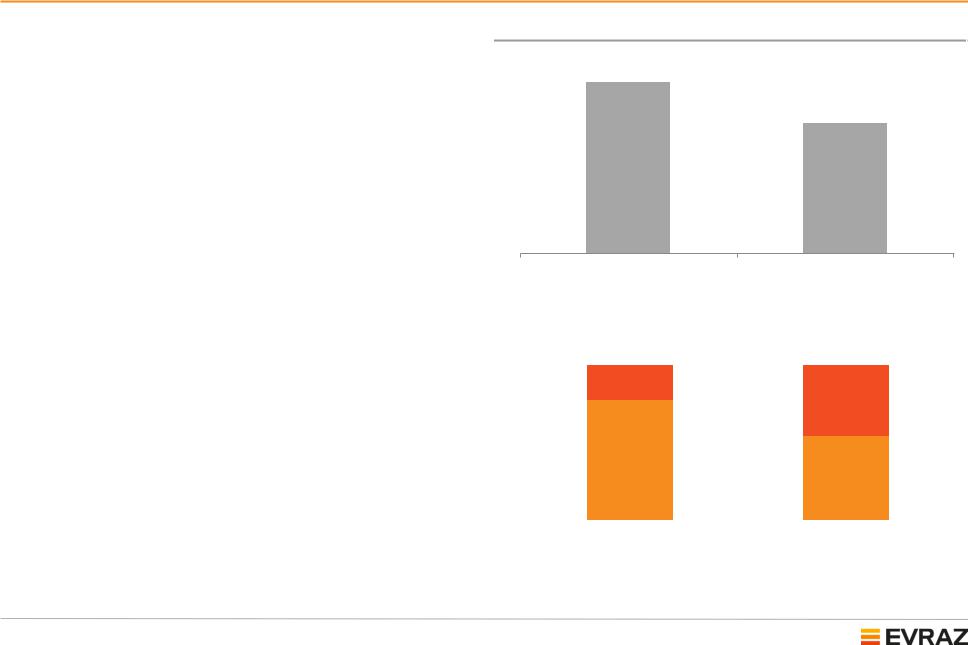
HSE Performance
7 employee and 6 contractor fatalities recorded in
H1 2014
Employees’ unsafe behavior accounts for up to 90% of incidents
Strategic goal of zero fatality incidents
Priority initiatives for 2014:
Training of all operations and maintenance and some administrative senior and middle managers to run behaviour safety conversations (audits) with employees’
Implementation of energy isolation programme LOTO (Lockout, Tryout) at all EVRAZ facilities
Safety focus on contractors’ operations that need to be in full compliance with EVRAZ safety standards
Earlier initiatives are enforced
Lost Time Injury Frequency Rate (LTIFR)*
2.16
1.64
|
H1 2013 |
|
|
H1 2014 |
|||
Fatalities |
|
|
|
|
|||
|
|
|
|
|
|
|
|
13 |
|
|
13 |
|
|||
3 |
|
|
|
|
|
|
|
|
|
|
|
6 |
|
||
10 |
|
|
|
|
|
|
|
|
|
|
|
7 |
|
||
|
|
|
|
|
|
|
|
|
|
|
|
|
|
|
|
|
H1 2013 |
|
|
H1 2014 |
|||
|
|
|
Employees |
|
|
Contractors |
|
|
|
|
|
||||
|
|
|
|
||||
*Calculated as number of lost working hours due to injuries, excluding fatalities, per 1 million hours worked
H1 2014 Financial Results |
4 |

H1 2014 summary
US$ million unless otherwise stated |
H1 2014 |
H1 2013 |
Change |
|
|
|
|
Steel sales volumes1(‘000 t) |
7,653 |
7,739 |
-1% |
Revenue |
6,805 |
7,319 |
-7% |
|
|
|
|
EBITDA2 |
1,080 |
925 |
+17% |
EBITDA margin |
15.9% |
12.6% |
+3.3pp |
|
|
|
|
Net profit/(loss) |
1 |
(146) |
n/m |
|
|
|
|
Capex3 |
365 |
492 |
-26% |
Free cash flow4 |
444 |
(87) |
n/m |
Total debt5 |
7,479 |
8,166 |
-8% |
Net debt5 |
6,095 |
6,534 |
-7% |
Net leverage6 |
3.1x |
3.6x |
-0.5x |
1.Here and throughout this presentation segment sales data refer to external sales unless otherwise stated
2.EBITDA represents profit from operations plus depreciation, depletion and amortisation, impairment of assets, foreign exchange loss (gain) and loss (gain) on disposal of property, plant and equipment and intangible assets. Please refer to slide 30 for EBITDA reconciliation
3.Includes payments recognised in financing activities
4.Please refer to slide 31 for FCF calculation
5.As at 30 June 2014 and 31 December 2013 respectively. Total debt represents nominal value of loans and borrowings plus unpaid interest, finance lease liabilities, nominal effect of cross-currency swaps on principal of rouble-denominated notes. Net debt represents Total debt less cash and liquid short-term financial assets, including those relating to disposal groups classified as held for sale. Please refer to slides 32-33 for Total and Net debt calculations
6.As at 30 June 2014 and 31 December 2013 respectively. Ratio of net debt to last 12 month EBITDA
H1 2014 Financial Results |
5 |

H1 2014 financial highlights
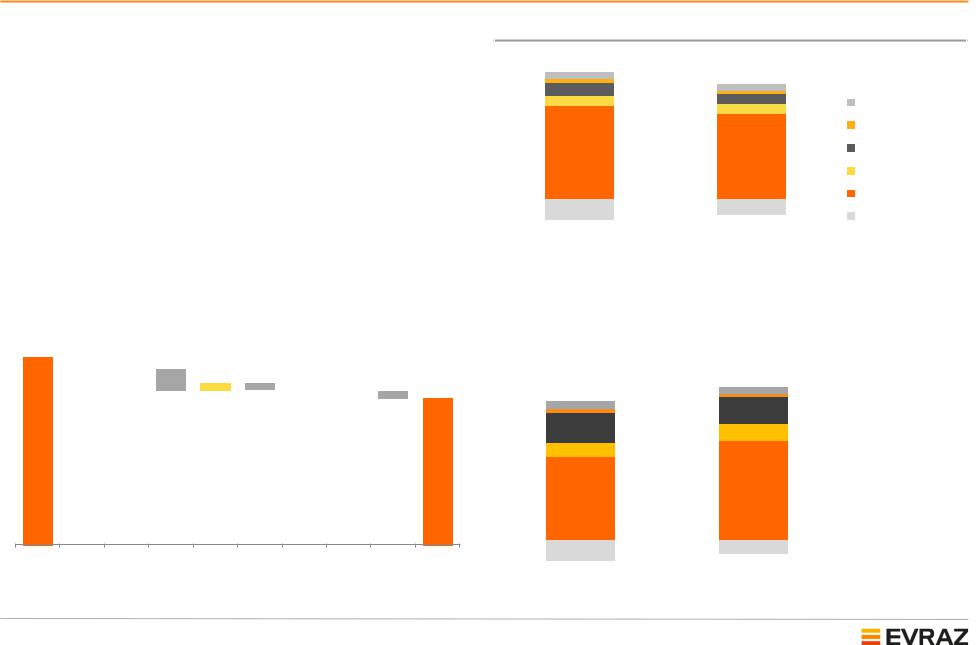
Consolidated revenue decreased primarily due to lower prices in line with negative global price trends and a lag in domestic steel prices in Russia and Ukraine in adjusting to the depreciation of local currencies
H1 2014 EBITDA margin was 15.9% vs. 12.6% in
H1 2013
Consolidated revenue by segment, $m
465 |
7,319 |
|
|
6,805 |
|
|
|
|
|
|
|
|
Total |
||||
|
|
|
|
|
||||
268 |
|
|
|
|
|
|||
900 |
434 |
|
|
|
||||
|
|
|
|
|||||
|
|
|
|
|
|
|||
|
|
722 |
255 |
659 |
|
|
Other operations |
|
|
|
|
|
|
665 |
|
|
|
|
|
|
|
|
|
|
|
Vanadium |
|
|
6,393 |
|
|
5,898 |
|
|
Iron ore |
|
|
|
|
|
|
|
||
|
|
|
|
|
|
|
|
|
|
|
|
|
|
|
|
|
Coal |
|
|
|
|
|
|
|
|
Steel |
|
|
(1,429) |
|
|
(1,106) |
|
|
Eliminations |
|
|
|
|
|
|
|
|
|
|
|
H1 2013 |
|
|
H1 2014 |
|
||
Revenue drivers, $m |
|
|
|
|
|
|
|
Consolidated EBITDA by segment, $m |
|
|
|||||
|
|
|
|
|
|
|
|
|
|
|
|
|
|
|
|
7,319 |
|
|
|
|
|
|
|
|
|
|
|
|
|
|
|
|
|
|
|
|
92 |
|
|
|
|
|
|
|
1,080 |
|
Total |
|
|
|
|
|
|
|
|
|
|
|
|
|
|||
(71) |
|
|
|
|
|
|
|
|
|
|
|
||||
|
|
|
|
|
|
|
|
|
|
|
|||||
|
|
|
|
|
|
|
|
|
|
|
|
||||
|
|
|
|
|
|
|
|
6,805 |
|
925 |
|
|
|||
(58) |
|
|
|
|
|
|
|
52 |
|
Other operations |
|||||
(267) |
(73) |
(18) |
(28) |
|
|
|
61 |
20 |
|
||||||
|
(92) |
|
|
34 |
216 |
|
|
||||||||
|
|
|
|
|
|
|
|
|
|
|
|
|
|||
|
|
|
|
|
|
|
|
|
|
|
|
231 |
132 |
|
Vanadium |
|
|
|
|
|
|
|
|
|
|
|
|
|
|||
|
|
|
|
|
|
|
|
|
|
|
|
|
|||
|
|
|
|
|
|
|
|
|
|
|
|
|
|
|
|
109 |
|
|
Iron ore |
|
|
|
|
651 |
771 |
|
Coal |
|
|||
|
|||
|
|
||
|
|
|
|
|
|
|
Steel |
|
|
|
|
|
|
|
Revenues |
Steel, |
Steel, mix Steel, |
Coal, |
Coal, |
Iron ore, |
Iron ore, |
Other Revenues |
H1 2013 |
quantity |
prices |
volumes |
prices |
volumes |
prices |
H1 2014 |
(161) |
|
(111) |
|
|
|
Eliminations and |
|
|
|
|
|
||||
|
|
|
|
||||
|
|
|
|
|
|
|
unallocated* |
|
H1 2013 |
|
H1 2014 |
|
|
|
|
* Includes unallocated expenses and intersegment unrealised gains/(losses)
H1 2014 Financial Results |
6 |

Analysis of cost of revenue
Item |
|
H1 2014, |
% of |
H1 2013, |
% of |
Relative |
Comments on changes |
|
$m |
revenue |
$m |
revenue |
change |
||
|
|
|
|||||
|
|
|
|
|
|
|
|
Revenue |
|
6,805 |
|
7,319 |
|
(7)% |
|
Cost of revenue |
|
5,192 |
76% |
5,886 |
80% |
(12)% |
|
|
|
|
|
|
|
|
|
Raw materials, incl. |
|
1,731 |
25% |
1,819 |
25% |
(5)% |
|
|
|
|
|
|
|
|
|
Iron ore |
|
432 |
6% |
371 |
5% |
16% |
Higher external purchases following disposals of iron ore |
|
assets |
||||||
|
|
|
|
|
|
|
|
Coking coal |
and |
272 |
4% |
368 |
5% |
(26)% |
Lower prices |
coke |
|
||||||
|
|
|
|
|
|
|
|
|
|
|
|
|
|
|
|
Scrap |
|
636 |
9% |
710 |
10% |
(10)% |
Lower prices and decreased consumption due to |
|
suspension of EVRAZ Claymont |
||||||
|
|
|
|
|
|
|
|
Other |
|
391 |
6% |
370 |
5% |
6% |
|
|
|
|
|
|
|
|
|
Semi-finished |
|
95 |
1% |
217 |
3% |
(56)% |
Increase of slab internal consumption at EVRAZ North |
products |
|
America and EVRAZ Vitkovice Steel |
|||||
|
|
|
|
|
|
||
Auxiliary materials |
|
393 |
6% |
516 |
7% |
(24)% |
Effect of cost optimisation, primarily in Coal segment and |
|
rouble depreciation |
||||||
|
|
|
|
|
|
|
|
Services |
|
360 |
5% |
351 |
5% |
3% |
|
|
|
|
|
|
|
|
|
Goods for resale |
|
276 |
4% |
298 |
4% |
(8)% |
|
|
|
|
|
|
|
|
|
Transportation |
|
340 |
5% |
437 |
6% |
(22)% |
Lower production volumes and rouble weakening partially |
|
offset by tariff increase |
||||||
|
|
|
|
|
|
|
|
Staff costs |
|
851 |
13% |
988 |
13% |
(14)% |
Headcount reduction, asset disposal and optimisation, |
|
rouble depreciation |
||||||
|
|
|
|
|
|
|
|
|
|
|
|
|
|
|
|
|
|
|
|
|
|
|
Changes in accounting for the depletion of coal mining |
Depreciation |
|
379 |
6% |
487 |
7% |
(22)% |
assets; revision of asset life of Russian and Ukrainian |
|
|
|
|
|
|
|
steel plants; rouble and hryvnia depreciation |
Electricity |
|
238 |
3% |
258 |
4% |
(8)% |
Lower consumption due to asset optimisation and |
|
operational improvements |
||||||
|
|
|
|
|
|
|
|
|
|
|
|
|
|
|
Reduced consumption due to operational improvements |
Natural gas |
|
175 |
3% |
225 |
3% |
(22)% |
at EVRAZ DMZ as well as asset disposals and |
|
|
|
|
|
|
|
suspensions |
Other costs* |
|
354 |
5% |
290 |
4% |
22% |
Decrease in stock of WIP and finished goods |
* Includes taxes, change in WIP and finished goods, certain items of energy costs Note: See details on cost optimisation on slides 8 and 29
Source: Management accounts
H1 2014 Financial Results |
7 |

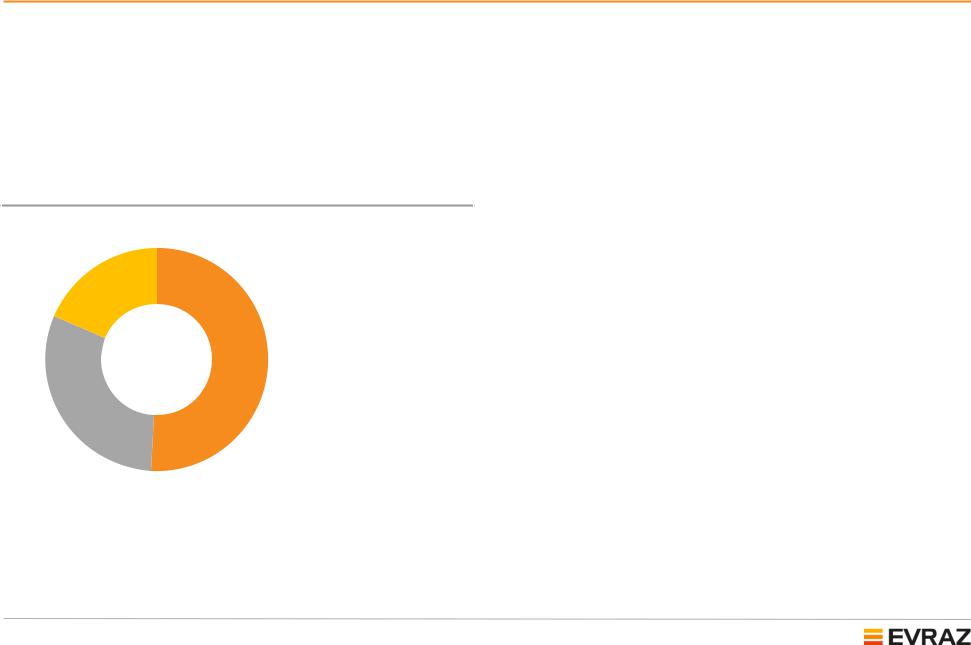
Efficiency improvement plan: H1 2014 progress update
Implementation of efficiency savings plan resulted in savings of $193m*
Total 2014 target is $400m
Efficiency improvement, $m
36
|
|
|
Cost cutting initiatives at |
|
|
|
|
|
|
|
|
|
|
|
ongoing operations |
193 |
98 |
|
Optimisation of asset |
|
|||
|
|||
|
portfolio |
||
|
|
|
|
59 |
|
|
Increase in production |
|
|
||
|
|
Cost cutting initiatives at ongoing operations: |
$98m |
|
|
Reduction of headcount and related G&A costs |
$33m |
Optimisation of coal mining costs |
$20m |
Improving yields, raw material and conversion costs in steel mills |
$40m |
Cost optimisation at iron ore mines |
$5m |
Optimisation of assets portfolio: |
$59m |
Mines shutdown and disposal at Evrazruda and Yuzhkuzbassugol |
$38m |
Suspension of EVRAZ Claymont, disposal of Central Heat and Power |
$21m |
|
Plant and shutdown of plate rolling mill at EVRAZ ZSMK |
||
|
Increase in production: |
$36m |
Growth in volumes at EVRAZ North America at ongoing assets |
$30m |
Recovery of production at Raspadskaya mine |
$6m |
* Actual results excluding effect of forex rates |
|
H1 2014 Financial Results |
8 |

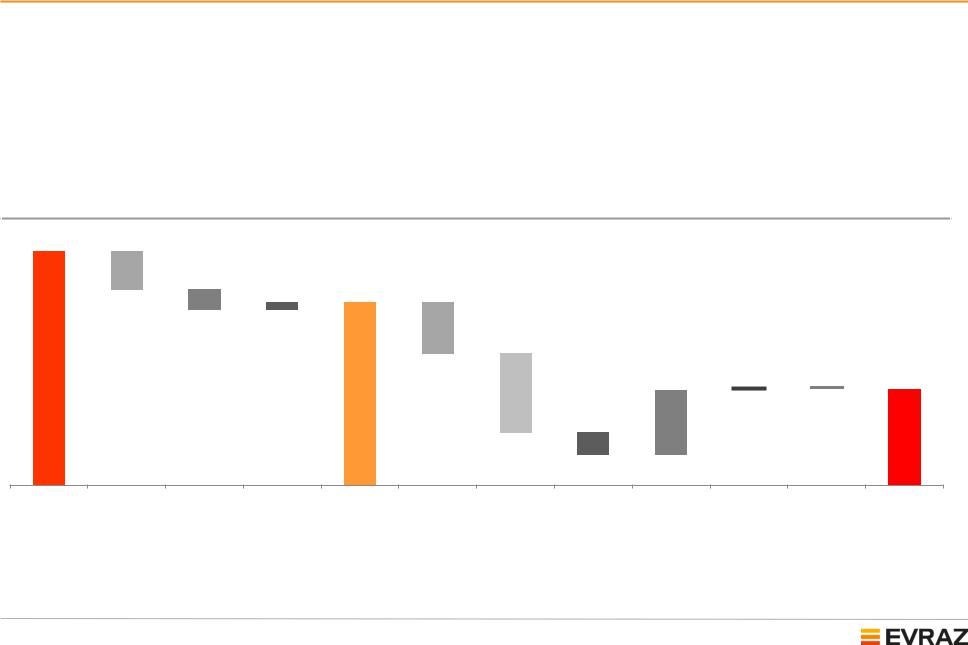
H1 2014 FCF generation
Working capital increased by $175m due to the repayment of a $312m payable to Yuzhny GOK (supplier of sinter to EVRAZ DMZP) which was offset by other improvements
Interest payments were $235m compared to $273m last year due to lower debt and refinancing at lower rates
Capex reduced to $365m from $492m as a result of the ongoing capex optimisation programme
Proceeds from disposals (mainly EVRAZ Vitkovice Steel) amounted to $296m
Strong cash flow of $444m
US$ million
1,080 |
|
|
|
33 |
844 |
|
|
(175) |
|
|
|
(94) |
|
|
|
|
(235) |
19 |
|
|
296 |
444 |
|
|
|
|
(13) |
|
(365) |
|
|
|
(102) |
|
|
EBITDA |
Changes in Income tax paid |
Other |
Cash flows from |
Interest and |
|
working capital, |
|
operating |
similar |
|
excl. income tax |
|
activities |
payments |
Capex, incl |
Purchases of |
Proceeds from |
CF from other |
Equity |
Free cash flow |
recorded in |
subsidiaries, net sale of disposal |
investing |
transactions |
|
|
financing |
of cash |
groups |
activities |
|
|
activities |
acquired, and |
classified as |
|
|
|
|
purchase of |
held for sale, |
|
|
|
|
interests in |
net of |
|
|
|
|
associates/joint |
transaction |
|
|
|
|
ventures |
costs |
|
|
|
H1 2014 Financial Results |
9 |
