

H1 2014 Results Presentation_final
.pdfCapex
No major capital spending in 2014 as key investment projects were completed in 2013
Significantly increased capex flexibility going forward
Capex is mostly channelled to maintenance
Priority is given to cash cost reduction projects with projected IRR of >40%
As a result, in H1 2014 total capital expenditures, including recorded in financing activities, amounted to $365m, a $127m reduction compared to H1 2013
Projected capex for 2014 and 2015 not to exceed $900m
Capex historic performance and outlook, $m excl. VAT
1,400 1,261
1,200
1,000 |
|
902 |
825 |
<900 |
|
||||
|
|
|
|
|
800 |
|
|
|
|
|
|
|
|
600
400
200
0
2012 |
2013 |
|
2014E |
2015E |
|
|
Maintenance, Steel & other |
|
Maintenance, Coal |
|
|
|
|
|
|||
|
|
|
|||
|
Maintenance, Iron ore |
|
|
Development, Steel & other |
|
|
|
|
|||
|
|
|
|||
|
Development, Mining |
|
|
|
|
|
|
|
|
|
|
|
|
|
|
|
|
H1 2014 Financial Results
H1 2014 capital expenditure breakdown by projects, $m
|
30 |
Yerunakovskaya VIII mine |
|
|
|
|
22 |
Mezhegey (Phase I) coal project |
|
|
|
237 |
15 |
|
|
PCI at EVRAZ ZSMK |
|
|
7 |
|
|
|
|
|
6 |
EVRAZ ZSMK rail mill |
|
365 |
modernisation |
 EVRAZ Caspian Steel
48
 Other development projects
 Maintenance
20

Summary

Current trading and market outlook
Seasonal improvement in long steel consumption in Russia with domestic prices of rebar and sections increasing
Improved market balance due to falling imports of construction products mostly from Ukraine
EVRAZ is well placed to benefit from this trend as
Russia’s #1 leading producer of construction steel products
EVRAZ’s long product sales in Russia started to grow in March 2014, benefiting from a positive price trend
Slab shortage in European markets because of Ukrainian plants shutdown provides more flexibility to redirect volumes to the export markets
Long products consumption, kt
6000
5000
4000
3000
2000
1000
0
|
Q1-13 Q2-13 |
Q3-13 |
Q4-13 Q1-14 Q2-14 Q3-14F Q4-14F |
|||||
|
Rebar |
|
Wire rod |
|
|
Other bars |
|
Channel |
|
|
|
|
|||||
|
|
|
|
|||||
|
Angle |
|
Beam |
|
|
Other sections |
|
Rails |
|
|
|
|
|
||||
|
|
|
|
|
||||
Rebar and sections import volumes, kt |
|
|
|
|
|
|
|
|
|
|
|
|
|
|
|
||||||||||||||||
|
|
|
|
|
|
|
|
|
|
|
|
|
|
|
|
|
|
|
|
|
|
|
|
|
|
|
|
|
|
|
|
200 |
|
|
|
|
|
|
|
|
|
|
|
|
|
|
|
|
|
|
|
|
|
|
|
|
|
|
|
|
|
|
|
|
|
|
|
|
|
|
|
|
|
|
|
|
|
|
|
|
|
|
|
|
|
|
|
|
|
|
|
|
|
|
|
175 |
|
|
|
|
|
|
|
|
|
|
|
|
|
|
|
|
|
|
|
Rebar |
|
|
Sections |
||||||||
|
|
|
|
|
|
|
|
|
|
|
|
|
|
|
|
|
|
|
|
|
|||||||||||
150 |
|
|
|
|
|
|
|
|
|
|
|
|
|
|
|
|
|
|
|
|
|
||||||||||
|
|
|
|
|
|
|
|
|
|
|
|
|
|
|
|
|
|
|
|
|
|
|
|
|
|
|
|
|
|
|
|
|
|
|
|
|
|
|
|
|
|
|
|
|
|
|
|
|
|
|
|
|
|
|
|
|
|
|
|
|
|
|
|
125 |
|
|
|
|
|
|
|
|
|
|
|
|
|
|
|
|
|
|
|
|
|
|
|
|
|
|
|
|
|
|
|
|
|
|
|
|
|
|
|
|
|
|
|
|
|
|
|
|
|
|
|
|
|
|
|
|
|
|
|
|
|
|
|
100 |
|
|
|
|
|
|
|
|
|
|
|
|
|
|
|
|
|
|
|
|
|
|
|
|
|
|
|
|
|
|
|
|
|
|
|
|
|
|
|
|
|
|
|
|
|
|
|
|
|
|
|
|
|
|
|
|
|
|
|
|
|
|
|
75 |
|
|
|
|
|
|
|
|
|
|
|
|
|
|
|
|
|
|
|
|
|
|
|
|
|
|
|
|
|
|
|
|
|
|
|
|
|
|
|
|
|
|
|
|
|
|
|
|
|
|
|
|
|
|
|
|
|
|
|
|
|
|
|
50 |
|
|
|
|
|
|
|
|
|
|
|
|
|
|
|
|
|
|
|
|
|
|
|
|
|
|
|
|
|
|
|
|
|
|
|
|
|
|
|
|
|
|
|
|
|
|
|
|
|
|
|
|
|
|
|
|
|
|
|
|
|
|
|
25 |
|
|
|
|
|
|
|
|
|
|
|
|
|
|
|
|
|
|
|
|
|
|
|
|
|
|
|
|
|
|
|
|
|
|
|
|
|
|
|
|
|
|
|
|
|
|
|
|
|
|
|
|
|
|
|
|
|
|
|
|
|
|
|
0 |
|
|
|
|
|
|
|
|
|
|
|
|
|
|
|
|
|
|
|
|
|
|
|
|
|
|
|
|
|
|
|
|
Jun-13 |
|
Jul-13 |
|
Aug-13 |
|
Sep-13 |
|
Oct-13 |
|
Nov-13 |
|
Dec-13 |
|
Jan-14 |
|
Feb-14 |
Mar-14 |
Apr-14 |
|
|
May-14 |
|
Jun-14 |
|||||||
|
|
|
|
|
|
|
|
|
|
|
|
|
|||||||||||||||||||
Source: Metal Expert
Slab and rebar prices, $/t
850 |
|
|
|
|
|
|
|
|
|
|
|
|
|
|
|
|
|
|
|
800 |
|
|
|
|
|
|
|
|
|
|
|
|
|
|
|
|
|
|
|
750 |
|
|
|
|
|
|
|
|
|
|
|
|
|
|
|
|
|
|
|
700 |
|
|
|
|
|
|
|
|
|
|
|
|
|
|
|
|
|
|
|
650 |
|
|
|
|
|
|
|
|
|
|
|
|
|
|
|
|
|
|
|
600 |
|
|
|
|
|
|
|
|
|
|
|
|
|
|
|
|
|
|
|
550 |
|
|
|
|
|
|
|
|
|
|
|
|
|
|
|
|
|
|
|
500 |
|
|
|
|
|
|
|
|
|
|
|
|
|
|
|
|
|
|
|
450 |
|
|
|
|
|
|
|
|
|
|
|
|
|
|
|
|
|
|
|
400 |
Feb-13 |
Mar-13 |
Apr-13 |
May-13 |
|
Jul-13 |
Aug-13 |
Sep-13 |
Oct-13 |
Nov-13 |
Dec-13 |
|
Feb-14 |
Mar-14 |
Apr-14 |
May-14 |
|
Jul-14 |
Aug-14 |
Jan-13 |
Jun-13 |
Jan-14 |
Jun-14 |
Slab, FOB FarEast (export) |
|
Rebar, CPT Moscow (domestic) |
|
H1 2014 Financial Results |
22 |

Summary
H1 2014 sales volumes were broadly flat, while H1 2014 financial results reflected weaker steel and steel raw materials price environment
EBITDA of $1,080m and EBITDA margin of 15.9%
Asset optmisation and cost efficiency actions brought $193m of gains
H1 2014 capex of $365m, in line with cap on annual capex of $900m and development capex spent on projects with projected IRR >40%
Deleveraging on track to reach Net debt/EBITDA of <3x
H1 2014 Financial Results |
23 |

Appendix

EVRAZ’s Global Business
Global Vertically Integrated Steel, Mining and Vanadium Business with Strong Positions in Highly Attractive Markets
141
16 |
Russia/CIS |
|
1,301
124 Europe
479
1,716
North America
Asia
|
Africa |
237 |
South America |
|
|
|
|
Steel mills |
Steel Sales Volume Breakdown (H1 2014) |
|
|
|
|
|
|
|
|
|
|
Iron ore mining |
by Geography |
|
by Product |
|
|
|
|
|
|
||
Coal mining |
Europe, |
Africa |
Other |
|
|
|
|
||||
Vanadium |
6% |
& ROW, |
Tubular 3% |
|
|
Asia, |
4% |
7% |
|
Semi- |
|
|
22% |
Flat- |
|
finished |
|
Sea ports |
|
|
|||
|
rolled |
|
|||
|
|
|
|
30% |
|
Mezhegey coal mine in development |
|
|
10% |
|
|
|
|
|
|
||
#Third party steel products sales (Kt)*
#
Internal supply of slabs and billets from Russian steel mills (Kt)
7.7 Mt
Americas,
19%
Russia |
7.7 Mt |
|
Railway |
||
& CIS, |
||
14% |
||
49% |
||
|
Construc
tion 36%
*Excluding routes with sales volumes below 35kt each, together totalling 67kt
H1 2014 Financial Results |
25 |

Steel: South Africa
Weak economic fundamentals and social unrest continue to impact results of EVRAZ Highveld Steel and
Vanadium (“Highveld”)
In August 2014, EVRAZ sold 34% of the issued share capital of Highveld to local strategic investor Macrovest 147 Proprietary Limited for approx. $27m. Macrovest is to also refinance 50% of the outstanding working capital facility provided by EVRAZ plc
EVRAZ retains 51% of Highveld’s shares
Steel product sales, kt
267 |
276 |
|
|
|
|
||
10 |
|
|
|
|
|||
11 |
|
|
|
|
|||
|
|
|
|
|
|
||
170 |
172 |
|
|
|
Other |
||
|
|
|
|||||
|
|
|
|||||
|
|
|
|
|
|
|
Flat-rolled |
|
|
|
|
|
|
|
|
|
|
|
|
|
|
|
|
86 |
94 |
|
|
|
Construction |
||
|
|
|
|||||
|
|
|
|||||
|
|
|
|
||||
|
|
|
|
|
|
|
|
|
H1 2013 |
|
H1 2014 |
|
|
|
|
Steel products revenues
|
Revenue, |
Revenue per tonne, |
||
|
|
$m |
|
$ |
Products |
H1 2013 |
H1 2014 |
H1 2013 |
H1 2014 |
Construction |
67 |
65 |
779 |
692 |
|
|
|
|
|
Flat-rolled |
126 |
112 |
741 |
652 |
Other |
9 |
7 |
818 |
700 |
|
|
|
|
|
TOTAL |
202 |
184 |
757 |
667 |
|
|
|
|
|
H1 2014 Financial Results |
26 |

Vanadium
Vanadium segment revenues decreased by 5% to $255m in H1 2014 compared to $268m in H1 2013 affected by lower prices, partly offset by increased sale volumes
External sales volumes increased by 4%, mostly as a result of growth in sales of finished vanadium products
Average prices were volatile in H1 2014 and on the decline in July-August
Vanadium external product sales, t of V
|
8,612 |
8,992 |
|
204 |
|
192 |
|
|
|
|
 Vanadium in slag
8,420 |
8,788 |
|
 Vanadium in alloys and chemicals
H1 2013 |
H1 2014 |
Ferrovanadium prices (FeV), $/kg contained V
31.15 31.0 31.6
29.14 |
27.80 |
|
|
|
|
|
|
27.19 |
|
|
26.72 |
|
|
|
26.53 |
||
|
|
|
|
|
|
|||
|
27.54 |
25.57 |
|
|
|
25.39 |
|
26.39 |
|
|
25.50 |
|
|
||||
|
|
|
|
|
|
|
||
|
|
25.11 |
25.33 |
|
25.69 |
25.29 |
25.10 |
|
|
|
24.93 |
|
|||||
Jan-13 Mar-13 May-13 Jul-13 Sep-13 Nov-13 Jan-14 Mar-14 May-14 Jul-14
Source: LMB
Vanadium product external sales by region, $m
|
|
5 |
31 |
|
13 |
|
|
|
|
|
|
|
|
|
Russia & CIS |
|
|
|
Europe |
78 |
|
242 |
Americas |
|
|
|
Asia |
115 |
Africa & RoW |
|
H1 2014 Financial Results |
27 |
Cost structure by segment
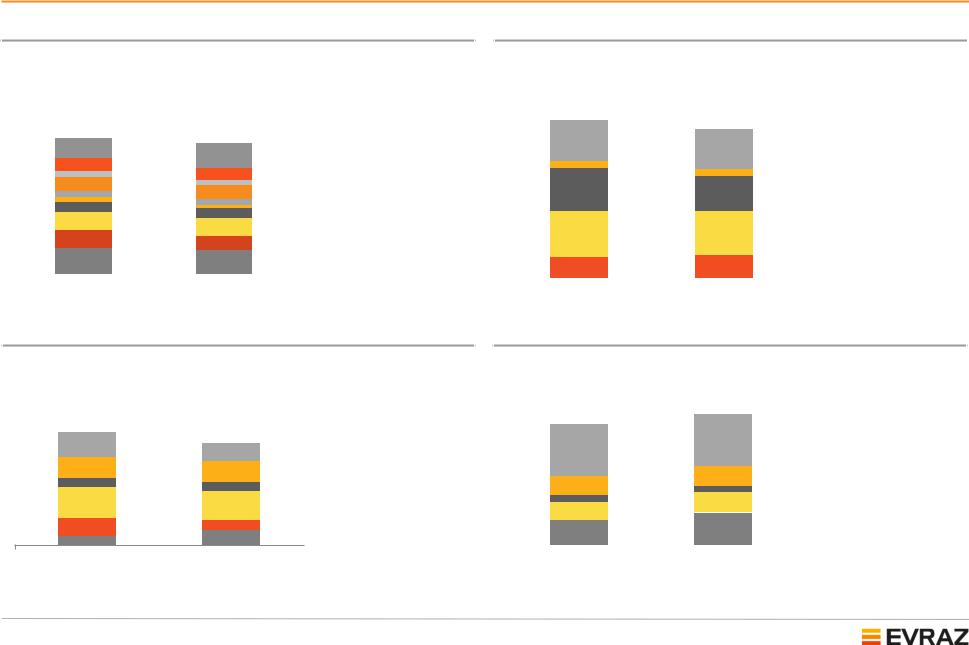
Cost structure of Steel segment, % of segment revenue
Revenue: |
6,393 |
|
5,898 |
|
|
|
|
|
|||
CoR: |
5,260 |
|
4,649 |
|
|
|
|
Other |
|||
|
|
|
|
|
|||||||
|
|
|
|
|
|||||||
|
|
|
|
|
|
|
|
|
|
|
Energy |
|
|
|
|
|
|
|
|
|
|
|
|
|
|
|
|
|
|
|
|
|
|
|
|
|
|
|
82% |
|
79% |
|
|
|
|
Depreciation |
|
|
|
|
|
|
|
|
|
||||
|
|
|
|
|
|
|
|
||||
|
|
|
|
|
|
|
|
|
|||
|
|
|
|
|
|
|
|
|
Staff costs |
||
|
|
|
13% |
|
15% |
|
|
|
|
||
|
|
|
|
|
|
|
|
||||
|
|
|
|
|
|
|
|
|
|||
|
|
|
7% |
|
|
|
|
|
Transportation |
||
|
|
|
|
|
|
|
|
||||
|
|
|
|
|
|
|
|
|
|
||
|
|
|
4% |
|
7% |
3% |
|
|
|
Semi-finished products |
|
|
|
|
9% |
|
8% |
|
|
|
|||
|
|
|
|
|
|
|
|||||
|
|
|
4% |
3% |
|
|
|
|
|
||
|
|
|
6% |
4% |
2% |
|
|
|
Other raw materials |
||
|
|
|
11% |
|
6% |
|
|
|
|
Scrap |
|
|
|
|
|
11% |
|
|
|
|
|||
|
|
|
11% |
|
|
|
|
|
|||
|
|
|
|
9% |
|
|
|
|
Coking coal |
||
|
|
|
|
|
|
|
|
||||
|
|
|
16% |
|
|
|
|
|
|||
|
|
|
|
14% |
|
|
|
|
Iron ore |
||
|
|
|
|
|
|
|
|
||||
|
|
|
|
|
|
|
|
|
|
|
|
|
|
H1 2013 |
|
|
H1 2014 |
|
|
|
|
|
|
Cost structure of Coal segment, % of segment revenue
|
Revenue: |
722 |
665 |
|
|
|
|
|
|
|
|
CoR: |
640 |
557 |
|
|
|
|
|
|
|
89% |
84% |
|
|
|
|
|
|
|||
|
|
|
|
|
|
|
|
|
||
23% |
22% |
|
|
|
|
|
Other |
|||
|
|
|
|
|
||||||
|
|
|
|
|
||||||
|
|
|
|
|
|
|
|
|
||
|
|
4% |
|
|
4% |
|
|
|
|
Energy |
|
|
|
|
|
|
|
|
|||
|
|
|
|
|
|
|
|
|||
|
|
|
|
|
|
|
|
|
|
|
24% |
20% |
|
|
|
|
|
Depreciation |
|||
|
|
|
|
|
||||||
|
|
|
|
|
||||||
|
|
|
|
|
|
|||||
|
|
|
|
|
|
|
|
|
||
|
|
|
|
|
|
|
|
|
|
Staff costs |
|
|
|
|
|
|
|
|
|
|
|
|
|
|
|
|
|
|
|
|
|
|
26% |
25% |
|
|
|
|
|
Transportation |
|||
|
|
|
|
|
||||||
|
|
|
|
|
||||||
|
|
|
|
|
|
|||||
|
|
|
|
|
|
|
|
|
|
|
12% |
13% |
|
|
|
|
|
Raw materials |
|||
|
|
|
|
|
|
|||||
|
|
|
|
|
|
|||||
|
|
|
|
|
|
|
|
|
|
|
|
H1 2013 |
|
H1 2014 |
|
|
|
|
|
|
|
Cost structure of Iron ore segment, % of segment revenue
Revenue: |
900 |
659 |
|
|
|
CoR: |
669 |
441 |
|
|
|
74% |
67% |
|
|
Other |
|
|
|
||||
|
|
||||
|
|
|
|
|
|
15% |
11% |
|
|
Energy |
|
|
|
||||
|
|
||||
|
|
|
|
|
|
14% |
14% |
|
|
Depreciation |
|
|
|
||||
|
|
||||
|
6% |
|
|
|
|
|
6% |
|
|
Staff costs |
|
|
|
|
|||
21% |
|
|
|||
19% |
|
|
Transportation |
||
|
|
||||
12% |
7% |
|
|
||
|
|
Raw materials |
|||
|
6% |
10% |
|
|
|
|
|
|
|||
|
|
|
|
||
|
|
|
|
|
|
H1 2013 |
H1 2014 |
|
|
|
|
Cost structure of Vanadium segment, % of segment revenue
Revenue: |
268 |
|
|
255 |
|
|
|
|
|
||
CoR: |
210 |
|
|
215 |
|
|
|
|
|
||
|
|
|
78% |
|
|
84% |
|
|
|
|
Other |
|
|
|
|
|
|
|
|
|
|||
|
|
|
|
|
|
|
|
|
|||
|
|
|
|
|
|
|
|
|
|
|
|
|
|
|
|
|
|
32% |
|
|
|
|
Energy |
|
|
|
|
|
|
|
|
|
|
||
|
|
|
|
|
|
|
|
|
|
||
|
|
|
34% |
|
|
|
|
|
|
Depreciation |
|
|
|
|
|
|
|
|
|
|
|
||
|
|
|
|
|
|
|
|
|
|
||
|
|
|
12% |
|
|
13% |
4% |
|
|
|
Staff costs |
|
|
|
|
|
|
|
|
||||
|
|
|
|
|
|
|
|
||||
|
|
|
|
|
|
|
|
|
|||
|
|
|
|
|
|
|
|
|
|
||
|
|
|
4% |
|
|
13% |
|
|
|
|
Transportation |
|
|
|
|
|
|
|
|
|
|||
|
|
|
|
|
|
|
|
|
|||
|
|
|
12% |
|
|
1% |
|
|
|
|
|
|
|
|
|
|
|
|
|
|
Raw materials |
||
|
|
|
21% |
|
|
||||||
|
|
|
16% |
|
|
|
|
|
|
||
|
|
|
|
|
|
|
|
|
|||
|
|
|
|
|
|
|
|
|
|
||
|
|
|
|
|
|
|
|
|
|
|
|
|
|
|
|
|
|
|
|
|
|
|
|
|
|
H1 2013 |
H1 2014 |
|
|
|
|
|
|||
Note. Numbers may not add to totals due to rounding. Percent changes based on numbers prior to rounding
H1 2014 Financial Results |
28 |

Efficiency improvement plan: update on progress
|
Initiative |
H1 2014 achievements |
|
H1 2014* vs. H1 2013 |
|
|
|
|
|
|
actual results, $m |
|
|
|
|
|
|
|
Restructuring of |
|
Shutdown and disposal of inefficient Russian iron ore, coal mines, |
(59) |
|
|
production assets |
|
workshop at ZSMK, Central Heat and Power Plant and mill at EVRAZ |
||
|
|
North America |
|
|
|
|
|
|
|
|
|
|
|
|
|
|
|
|
|
|
Decrease in EVRAZ North America’s costs, including volume |
|
|
|
Optimisation in |
|
increase effect and improved yields TPG |
|
(36) |
|
steelmaking |
|
Decrease in overtime, fixed costs and quality claims at EVRAZ North |
||
|
|
||||
|
|
|
America |
|
|
|
|
|
|
|
|
|
Staff cost |
|
Reduction of headcount and related G&A costs at Russian, Ukraine |
(33) |
|
|
optimisation |
|
and North America assets |
|
|
|
|
|
|
||
|
|
|
|
|
|
|
Optimisation of |
|
Changes in iron and ferroalloys mix and improved coke yields at |
|
|
|
raw materials in |
|
EVRAZ ZSMK. Decrease of coke consumption per tonne of pig iron |
(28) |
|
|
steelmaking |
|
at EVRAZ DMZ at the same production volumes |
|
|
|
|
|
|
|
|
|
Decrease in coal |
|
Optimisation of tunneling works, maintenance, degassing and |
|
|
|
production |
|
ventilation costs at Yuzhkuzbassugol |
|
(24) |
|
|
And increasing volumes at Raspadskaya |
|
||
|
expenses |
|
|
||
|
|
|
|
|
|
|
|
|
|
|
|
|
Decrease in iron |
|
Lower mineral extraction and land tax rates at Evrazruda and |
(5) |
|
|
ore production |
|
decrease in prices for auxiliary materials at EVRAZ KGOK |
||
|
expenses |
|
|
||
|
|
|
|
|
|
|
Decrease in |
|
Optimisation of repairs at EVRAZ ZSMK and EVRAZ NTMK steel |
(5) |
|
|
repairs |
|
mills |
|
|
|
|
|
|
||
|
|
|
|
|
|
|
Decrease in |
|
Lower electricity consumption at EVRAZ DMZ and Yuzhkuzbassugol |
(3) |
|
|
energy costs |
||||
|
|
|
|
|
|
|
|
|
|
|
|
|
Total: |
|
|
|
(193) |
|
|
|
|
||
* Actual results excluding effect of forex rates |
|
|
|||
|
H1 2014 Financial Results |
29 |
|
||
Operating cost savings plan is $350m in 2014
Actual result in 1H 2014 is $193m
G&A expenses to be reduced by $100m on an annualised basis from 2015, with $50m already to be achieved in 2014