

H1 2013 Results Presentation
.pdfCapex
Delivering on major investment programme:
Rail mill modernisation at EVRAZ ZSMK completed in January 2013 and currently being ramped-up
Commissioned new coking coal mine Yerunakovskaya VIII with the capacity of 2.5 Mtpa
Introduced a PCI technology at EVRAZ NTMK
Significantly increased capex flexibility going forward
Further expansion plans revised and adjusted in response to the current market environment
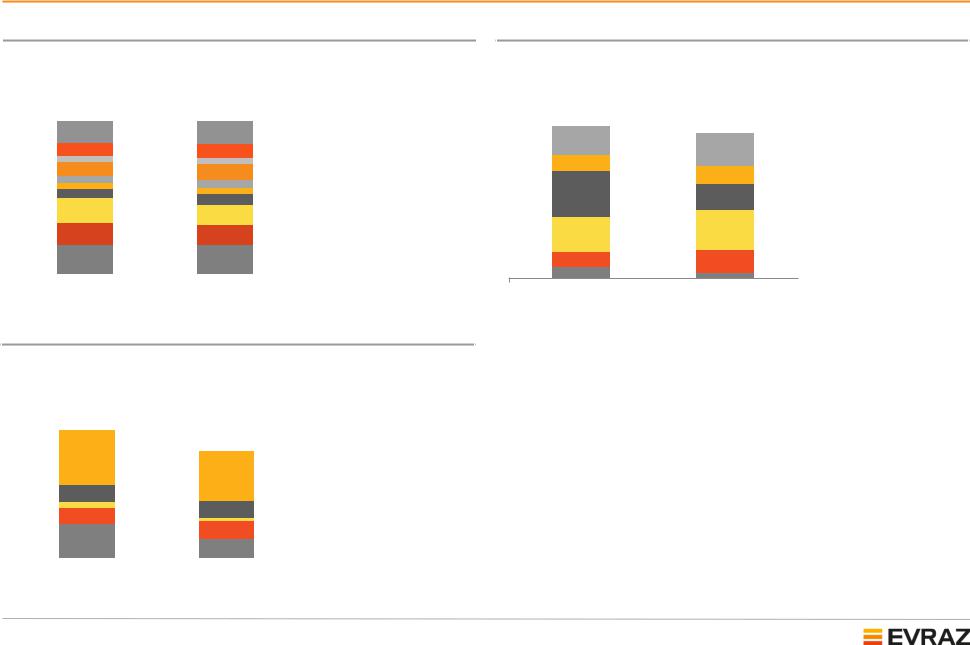
In H1 2013 our total capital expenditure amounted to $492m compared to $565m in H1 2012, while updated FY2013 capex estimate is $0.9-1.0bn (including Raspadskaya) compared with budgeted capex of ca. $1.3bn
Capex historic performance and outlook, $m |
|
H1 2013 capital expenditure breakdown by projects, $m |
|||||
|
1,281 |
1,261 |
|
|
|
43 |
Yerunakovskaya VIII mine |
|
|
|
|
|
|
||
|
|
|
|
|
|
|
|
|
|
208 |
~900-1,000 |
Investment |
253 |
35 |
EVRAZ ZSMK rail mill |
|
|
|
|
||||
|
|
|
projects, Mining |
|
|
modernisation |
|
|
|
|
|
|
|
||
832 |
|
396 |
220 |
|
|
21 |
Mezhegey (Phase I) coal |
|
|
|
|
|
project |
||
|
|
|
|
|
|
|
|
|
|
|
|
Investment |
|
18 |
Vostochniy mill |
|
|
|
294 |
projects, Steel, |
|
17 |
PCI at EVRAZ ZSMK |
|
|
|
|
Vanadium and |
|
||
|
|
|
|
Other operations |
|
|
Other investment projects |
|
|
657 |
|
Maintenance |
|
|
|
|
|
|
469 |
including some |
|
|
Maintenance |
|
|
|
|
support of mining |
|
105 |
|
|
|
|
|
|
|
||
|
|
|
|
capacity |
|
|
|
2010 |
2011 |
2012 |
2013 estimate* |
|
|
|
|
H1 2013 Financial Results |
20 |

Key investment projects
|
|
Cumulative |
|
Estimated |
|
|
|
Total |
capex by |
Capex in |
capex in |
|
|
|
capex*, |
30/06/2013*, |
H1 2013, |
H2 2013, |
|
|
Project |
$m |
$m |
$m |
$m |
Project targets |
|
Completed |
975 |
832 |
84 |
70 |
|
|
Yerunakovskaya VIII mine |
310 |
221 |
43 |
36 |
Production of up to 2.5 Mtpa of coking coal |
|
construction |
Ramp-up to be completed by Q1 2014 |
|||||
|
|
|
|
|||
Pulverised coal injection |
175 |
166 |
6 |
5 |
Coke consumption to be reduced by ca. 20% and natural gas by |
|
(PCI) at EVRAZ NTMK |
ca. 50%, with additional 140kg PCI coal per tonne of pig iron |
|||||
|
|
|
|
|||
|
|
|
|
|
Increase of production capacity to 950 ktpa, including 450 ktpa of |
|
Rail mill modernisation at |
490 |
445 |
35 |
29 |
100 metre rails |
|
EVRAZ ZSMK |
Launched in January 2013. Ramp-up to be completed by Q2 |
|||||
|
|
|
|
|||
|
|
|
|
|
2014 |
|
|
|
|
|
|
|
|
Steel |
347 |
224 |
42 |
72 |
|
|
Pulverised coal injection |
|
|
|
|
Coke consumption to be reduced by ca. 20% and natural gas by |
|
199 |
124 |
17 |
33 |
ca. 50%, with additional 140kg PCI coal per tonne of pig iron |
||
(PCI) at EVRAZ ZSMK |
||||||
|
|
|
|
Launch in Q4 2014 |
||
|
|
|
|
|
||
Construction of |
|
|
|
|
New capacity: 450 ktpa of construction products |
|
Vostochniy rolling mill |
114 |
79 |
18 |
28 |
||
Hot tests to start in Q4 2013 |
||||||
(Kazakhstan) |
|
|
|
|
||
|
|
|
|
|
||
|
|
|
|
|
|
|
Rail mill expansion |
|
|
|
|
Increase of rail mill capacity from 472 ktpa to 526 ktpa and |
|
34 |
21 |
7 |
11 |
improvement in product quality |
||
at EVRAZ North America |
||||||
|
|
|
|
To be completed in Q4 2013 |
||
|
|
|
|
|
||
Coal & iron ore |
295 |
116 |
28 |
47 |
|
|
Development of Mezhegey |
222 |
67 |
21 |
37 |
Production of up to 1.5 Mtpa of hard coking coal |
|
coal deposit |
First coal to be mined by 2013 year-end |
|||||
|
|
|
|
|||
Expansion of |
|
|
|
|
Increase iron ore production to 4.8 Mtpa, replace depleting mines |
|
73 |
49 |
7 |
10 |
Decrease of cash cost per tonne |
||
Sheregesh mine |
||||||
|
|
|
|
Ramp-up to be completed in H2 2014 |
||
|
|
|
|
|
||
TOTAL |
1,617 |
1,172 |
154 |
189 |
|
|
|
|
|
|
|
|
* 2013 Financial Results
H1 2013 Financial Results |
21 |

Summary

Summary
H1 2013 sales volumes were broadly flat, while H1 2013 financial results reflected weaker steel price environment
Lower prices were partially offset by decrease in costs especially in raw materials
Delivered on several major investment projects – rail mill modernisation, commissioning of new coking coal mine Yerunakovskaya VIII, PCI at EVRAZ NTMK
Capex reduced to reflect the weaker steel pricing environment
Ongoing optimisation of asset portfolio with certain assets’ sale expected to close in H2
2013
Stable debt and solid liquidity position following continued focus on debt management actions
H1 2013 Financial Results |
23 |

Appendix

EVRAZ’s Global Business
Global Vertically Integrated Steel, Mining and Vanadium Business with Strong Positions in Highly Attractive Markets
158 |
Russia/CIS |
|
|
3,706 |
|
1,334 |
|
|
|
|
|
500 |
|
|
Europe |
|
|
115 |
1,551 |
393 |
|
|
North America
Asia
|
Africa |
266 |
South America |
|
|
|
|
|
Steel mills |
Steel Sales Volume Breakdown (H1 2013) |
|
|
||
|
|
|
|
|
|
|
|
Iron ore mining |
|
by Geography |
|
by Product |
|
|
Coal mining |
|
Africa/Other |
|
Other |
|
|
Vanadium |
Europe 4% |
|
Tubular 4% |
Semi- |
|
|
Russia & |
6% |
||||
|
|
11% |
finished |
|||
|
Sea ports |
|
||||
|
|
|
CIS |
Flat-rolled |
25% |
|
|
|
|
|
|||
|
Mezhegey coal mine in development |
|
|
48% |
||
|
|
|
18% |
|
||
|
|
|
|
|
|
|
# |
Third party steel products sales H1 2013 (Kt)* |
Asia |
7.8 Mt |
|
7.8 Mt |
|
20% |
|
|
||||
|
|
|
|
|
||
|
|
|
|
|
|
|
# |
Internal supply of slabs and billets |
|
|
|
Railway |
|
from Russian steel mills H1 2013 (Kt) |
|
|
|
|
||
|
|
|
|
11% |
|
|
|
|
Americas |
|
|
Constructi |
|
|
|
|
|
|
||
|
|
17% |
|
|
|
on |
* Excluding routes with sales volumes below 100 kt each, together totalling 58 kt |
|
|
36% |
|||
H1 2013 Financial Results |
|
25 |
|
|
|
|

Steel products: sales by market
kt |
|
$m |
|
|
|
 H1 2012
3,324
3,240
 H1 2013
2,604
2,421
|
|
|
|
1,732 |
|
|
|
|
|
|
|
|
|
|
|
|
|
|
|
|
|
|
|
|
|
|
|
||
|
|
|
|
1,555 |
|
|
|
|
|
|
|
|
|
|
|
1,582 |
|
|
|
|
|
|
|
|
|
|
|||
|
|
|
|
|
|
|
|
|
|
|
|
|
|
|
|
|
|
|
|
|
|
|
|
|
|
|
|||
|
|
1,3451,349 |
|
|
|
|
|
|
|
|
|
|
|
|
|
|
1,367 |
|
|
|
|
|
|
|
|
|
|
||
|
|
|
|
|
|
|
|
|
|
|
|
|
|
|
|
|
|
|
|
1,068 |
|
|
|
|
|
|
|
|
|
|
|
|
|
|
|
|
838 |
|
|
|
|
|
|
|
|
|
|
|
840 |
|
|
|
|
|
|
|
|
||
|
|
|
|
|
|
|
632 |
|
|
|
|
|
|
|
|
|
|
|
|
|
|
|
529 |
|
|
|
|
|
|
|
|
|
|
|
|
|
|
|
406 |
466 |
|
|
|
|
|
|
|
|
|
|
492 |
|
|
|
|
|
|||
|
|
|
|
|
|
|
|
|
275 305 |
|
|
|
|
|
|
|
|
|
|
|
336 351 |
|
|
|
|||||
|
|
|
|
|
|
|
|
|
|
|
|
|
|
|
|
|
|
|
|
|
|
|
214 224 |
|
|||||
|
|
|
|
|
|
|
|
|
|
|
|
|
|
|
|
|
|
|
|
|
|
|
|
|
|
|
|
||
|
|
|
|
|
|
|
|
|
|
|
|
|
|
|
|
|
|
|
|
|
|
|
|
|
|
|
|
||
|
Russia |
|
Americas |
|
|
Asia |
|
Europe |
|
CIS |
|
Africa & |
|
|
Russia |
|
Americas |
|
Asia |
|
Europe |
|
CIS |
|
Africa & |
||||
|
|
|
|
|
|
|
|
|
|
|
|
|
RoW |
|
|
|
|
|
|
|
|
|
|
|
|
|
RoW |
||
H1 2013 Financial Results |
|
|
|
|
|
|
|
|
26 |
|
|
|
|
|
|
|
|
|
|
|
|
|
|
||||||

Steel: Europe, South Africa
Steel products revenues, $m
|
Revenue, |
Revenue per tonne, |
||
|
|
$m |
|
$ |
Products |
H1 2012 |
H1 2013 |
H1 2012 |
H1 2013 |
European Operations |
|
|
|
|
Flat-rolled |
398 |
329 |
788 |
686 |
Other |
37 |
36 |
974 |
923 |
TOTAL |
435 |
365 |
801 |
703 |
Steel products sales volumes: European operations, kt
543 |
519 |
|
38 |
|
|
39 |
|
|
|
|
|
|
|
Other |
505 |
480 |
Flat-rolled |
H1 2012 |
H1 2013 |
Steel products sales volumes: South African operations, kt
|
Revenue, |
Revenue per tonne, |
|
|
|
|
|
|||
|
|
$m |
|
$ |
270 |
267 |
|
|
||
|
|
|
|
|
|
|
35 |
11 |
|
|
Products |
H1 2012 |
H1 2013 |
H1 2012 |
|
H1 2013 |
|
|
Other |
||
|
|
|
|
|||||||
|
|
|
|
|
|
|
|
|
|
|
South African Operations |
|
|
|
|
|
|
170 |
|
|
|
Flat-rolled |
||
|
|
|
|
|
|
|
|
|
|||||
|
|
|
|
|
|
|
|
|
|
|
|||
Construction |
71 |
67 |
789 |
779 |
|
145 |
|
|
|
||||
|
|
|
|
|
|||||||||
|
|
|
|
|
|
Construction |
|||||||
|
|
|
|
|
|
|
|
|
|
|
|
|
|
Flat-rolled |
121 |
126 |
835 |
741 |
|
|
|
|
|
|
|
|
|
|
|
|
|
|
|
|
|
|
|||||
Other |
23 |
9 |
657 |
818 |
|
90 |
|
|
|
|
|
|
|
|
|
|
|
|
|
86 |
|
|
|
|
|||
TOTAL |
215 |
202 |
796 |
757 |
|
|
|
|
|
||||
|
|
|
|
|
|
|
|
|
|||||
|
|
|
|
|
|
|
|
|
|
|
|
|
|
|
|
|
|
|
|
|
H1 2012 |
|
H1 2013 |
||||
H1 2013 Financial Results |
27 |

Vanadium
Vanadium segment revenues increased by 1.9% to $268m in H1 2013 compared to $263m in H1 2012 reflecting increase in sales prices of vanadium products, which offset the decrease in sales volumes
Sales volumes decreased by 10% as a result of lower sales of vanadium slag by EVRAZ NTMK to China, while waiting for an export license, and proportionally lower purchases of vanadium pentoxide for further processing into FeV at third party facilities in China and USA
Vanadium product sales volumes, t of V
|
9,665 |
66 |
8,612 |
|
|
|
192 |
9,599
 Vanadium in slag
8,420
 Vanadium in alloys and chemicals
H1 2012 |
H1 2013 |
Ferrovanadium prices (FeV), $/kg contained V
|
|
|
|
31.15 |
|
31.0 |
|
|
|
|
|
31.6 |
27.80 |
|
|
|
|
26.8 |
|
|
|
25.6 |
|
|
|
29.14 |
|
|
25.6 |
|
|
|
||
|
|
|
|
|
||
25.3 |
|
|
|
|
25.57 |
|
|
|
23.7 |
24.3 |
|
||
|
|
|
|
|||
|
|
26.1 |
|
27.54 |
||
|
26.0 |
|
|
|
||
|
|
|
|
|
|
|
|
|
24.5 |
24.6 24.2 |
|
24.00 |
|
23.0 |
|
|
|
|
|
|
Jan-12 Apr-12 |
Jul-12 |
Oct-12 Jan-13 Apr-13 |
Jul-13 |
|
Source: LMB |
|
|
|
|
Vanadium product external sales by region, $m |
|
|||
|
|
|
|
|
|
9 |
35 |
|
|
21 |
|
|
|
|
|
|
|
|
|
|
|
|
Russia & CIS |
|
|
|
|
Europe |
|
|
|
|
Americas |
|
80 |
|
109 |
Asia |
|
|
|
|
||
 Africa & RoW
H1 2013 Financial Results |
28 |
Cost structure by segment
Cost structure of Steel segment, % of segment revenue
Revenue: |
7,019 |
6,416 |
|
|
|
|
|||
CoR: |
5,742 |
5,245 |
|
|
|
Other |
|||
|
|
|
|||||||
|
|
|
|||||||
|
|
|
82% |
82% |
|
|
|
Energy |
|
|
|
|
|
|
|
||||
|
|
|
|
|
|
||||
|
|
|
|
|
|
|
|||
|
|
|
12% |
12% |
|
|
|
Depreciation |
|
|
|
|
|
|
|
||||
|
|
|
|
|
|
||||
|
|
|
|
|
|
Staff costs |
|||
|
|
|
7% |
7% |
|
|
|
||
|
|
|
|
|
|
||||
|
|
|
|
|
|
|
|||
|
|
|
3% |
3% |
|
|
|
Transportation |
|
|
|
|
|
|
|
||||
|
|
|
7% |
9% |
|
|
|
|
|
|
|
|
4% |
|
|
|
Semi-finished products |
||
|
|
|
4% |
|
|
|
|||
|
|
|
3% |
|
|
|
|||
|
|
|
5% |
3% |
|
|
|
|
|
|
|
|
13% |
6% |
|
|
|
Other raw materials |
|
|
|
|
|
|
|
||||
|
|
|
11% |
|
|
|
|||
|
|
|
|
|
|
|
|||
|
|
|
|
|
|
|
Scrap |
||
|
|
|
12% |
11% |
|
|
|
||
|
|
|
|
|
|
||||
|
|
|
|
|
|
Coking coal |
|||
|
|
|
15% |
15% |
|
|
|
||
|
|
|
|
|
|
||||
|
|
|
|
|
|
Iron ore |
|||
|
|
|
|
|
|
||||
|
|
|
|
|
|
|
|
|
|
|
|
H1 2012 |
|
H1 2013 |
|
|
|
||
Cost structure of Vanadium segment, % of segment revenue
Cost structure of Mining segment, % of segment revenue
Revenue: |
1,383 |
1,622 |
|
|
|
CoR: |
1,175 |
1,321 |
|
|
|
85% |
81% |
|
|
|
|
|
|
|
|
|
|
16% |
19% |
|
|
Other |
|
|
|
||||
|
|
||||
|
|
|
|
Energy |
|
|
9% |
10% |
|
|
|
|
|
|
|||
|
|
|
|||
|
|
|
|
Depreciation |
|
26% |
15% |
|
|
||
|
|
||||
|
|
Staff costs |
|||
|
|
|
|
|
|
|
|
|
|
|
|
19% |
23% |
|
|
Transportation |
|
|
|
||||
|
|
||||
|
|
|
|
||
|
9% |
12% |
|
|
Raw materials |
|
|
|
|||
|
|
|
|||
|
|
|
|
||
|
6% |
3% |
|
|
|
|
|
|
|
|
|
H1 2012 |
H1 2013 |
|
|
|
|
|
Revenue: |
263 |
268 |
|
|
|
|
|
|
CoR: |
242 |
205 |
|
|
|
|
|
92% |
|
|
|
|
|
|
||
40% |
76% |
|
|
|
Other |
|||
|
|
|
||||||
|
|
|
||||||
35% |
|
|
|
Energy |
||||
|
|
|
||||||
|
|
|
|
|
|
|||
|
|
|
|
|
|
Depreciation |
||
12% |
|
|
|
|
|
|||
|
|
|
|
|
||||
|
|
|
|
|
|
|||
|
|
4% |
12% |
|
|
|
Staff costs |
|
|
|
|
|
|
||||
12% |
|
|
|
|||||
3% |
|
|
|
|
||||
24% |
12% |
|
|
|
Raw materials |
|||
|
|
|
||||||
|
|
|
||||||
14% |
|
|
|
|
||||
|
|
|
|
|
|
|
||
|
|
|
|
|
|
|
|
|
|
H1 2012 |
|
H1 2013 |
|
|
|
||
*Numbers may not add to totals due to rounding. Percent changes based on numbers prior to rounding
H1 2013 Financial Results |
29 |