

CHAPTER
Properties of Convolution
7
A linear system's characteristics are completely specified by the system's impulse response, as governed by the mathematics of convolution. This is the basis of many signal processing techniques. For example: Digital filters are created by designing an appropriate impulse response. Enemy aircraft are detected with radar by analyzing a measured impulse response. Echo suppression in long distance telephone calls is accomplished by creating an impulse response that counteracts the impulse response of the reverberation. The list goes on and on. This chapter expands on the properties and usage of convolution in several areas. First, several common impulse responses are discussed. Second, methods are presented for dealing with cascade and parallel combinations of linear systems. Third, the technique of correlation is introduced. Fourth, a nasty problem with convolution is examined, the computation time can be unacceptably long using conventional algorithms and computers.
Common Impulse Responses
Delta Function
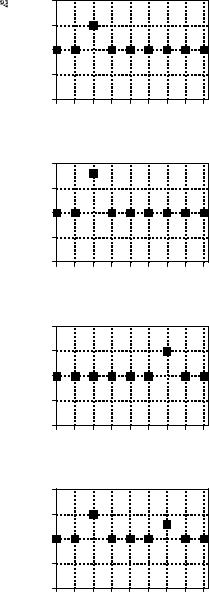
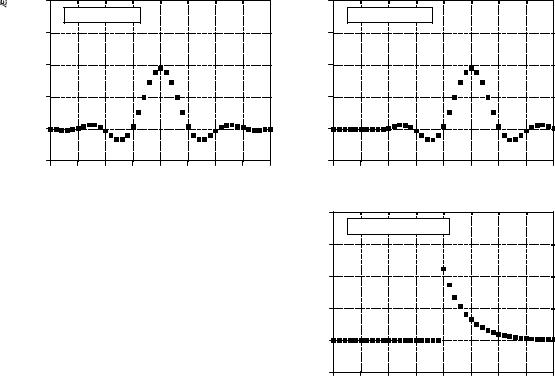
The simplest impulse response is nothing more that a delta function, as shown in Fig. 7-1a. That is, an impulse on the input produces an identical impulse on the output. This means that all signals are passed through the system without change. Convolving any signal with a delta function results in exactly the same signal. Mathematically, this is written:
EQUATION 7-1
The delta function is the identity for convolution. Any signal convolved with a delta function is left unchanged.
x [n ] ( *[n ] ' x [n ]
This property makes the delta function the identity for convolution. This is analogous to zero being the identity for addition ( a % 0 ' a ), and one being the identity for multiplication ( a × 1 ' a ). At first glance, this type of system
123
124 |
The Scientist and Engineer's Guide to Digital Signal Processing |
may seem trivial and uninteresting. Not so! Such systems are the ideal for data storage, communication and measurement. Much of DSP is concerned with passing information through systems without change or degradation.
Figure 7-1b shows a slight modification to the delta function impulse response. If the delta function is made larger or smaller in amplitude, the resulting system is an amplifier or attenuator, respectively. In equation form, amplification results if k is greater than one, and attenuation results if k is less than one:
EQUATION 7-2
A system that amplifies or attenuates has a scaled delta function for an impulse response. In this equation, k determines the amplification or attenuation.
x [n ] ( k *[n ] ' k x [n ]
The impulse response in Fig. 7-1c is a delta function with a shift. This results in a system that introduces an identical shift between the input and output signals. This could be described as a signal delay, or a signal advance, depending on the direction of the shift. Letting the shift be represented by the parameter, s, this can be written as the equation:
EQUATION 7-3
A relative shift between the input and output signals corresponds to an impulse response that is a shifted delta function. The variable, s, determines the amount of shift in this equation.
x [n ] ( *[n % s ] ' x [n % s ]
Science and engineering are filled with cases where one signal is a shifted version of another. For example, consider a radio signal transmitted from a remote space probe, and the corresponding signal received on the earth. The time it takes the radio wave to propagate over the distance causes a delay between the transmitted and received signals. In biology, the electrical signals in adjacent nerve cells are shifted versions of each other, as determined by the time it takes an action potential to cross the synaptic junction that connects the two.
Figure 7-1d shows an impulse response composed of a delta function plus a shifted and scaled delta function. By superposition, the output of this system is the input signal plus a delayed version of the input signal, i.e., an echo. Echoes are important in many DSP applications. The addition of echoes is a key part in making audio recordings sound natural and pleasant. Radar and sonar analyze echoes to detect aircraft and submarines. Geophysicists use echoes to find oil. Echoes are also very important in telephone networks, because you want to avoid them.
Chapter 7- Properties of Convolution |
125 |
a. Identity
The delta function is the identity for convolution. Convolving a signal with the delta function leaves the signal unchanged. This is the goal of systems that transmit or store signals.
Amplitude
2 |
|
|
|
|
|
|
|
1 |
|
|
|
|
|
|
|
0 |
|
|
|
|
|
|
|
-1 |
|
|
|
|
|
|
|
-2 |
|
|
|
|
|
|
|
-2 -1 |
0 |
1 |
2 |
3 |
4 |
5 |
6 |
b. Amplification & Attenuation Increasing or decreasing the amplitude of the delta function forms an impulse response that amplifies or attenuates, respectively. This impulse response will amplify the signal by 1.6.
c. Shift
Shifting the delta function produces a corresponding shift between the input and output signals. Depending on the direction, this can be called a delay or an advance. This impulse response delays the signal by four samples.
Sample number
|
2 |
|
|
|
|
|
|
|
Amplitude |
1 |
|
|
|
|
|
|
|
0 |
|
|
|
|
|
|
|
|
-1 |
|
|
|
|
|
|
|
|
|
|
|
|
|
|
|
|
|
|
-2 |
|
|
|
|
|
|
|
|
-2 -1 |
0 |
1 |
2 |
3 |
4 |
5 |
6 |
Sample number
|
2 |
|
|
|
|
|
|
|
Amplitude |
1 |
|
|
|
|
|
|
|
0 |
|
|
|
|
|
|
|
|
-1 |
|
|
|
|
|
|
|
|
|
|
|
|
|
|
|
|
|
|
-2 |
|
|
|
|
|
|
|
|
-2 -1 |
0 |
1 |
2 |
3 |
4 |
5 |
6 |
d. Echo
A delta function plus a shifted and scaled delta function results in an echo being added to the original signal. In this example, the echo is delayed by four samples and has an amplitude of 60% of the original signal.
Sample number
|
2 |
|
|
|
|
|
|
|
Amplitude |
1 |
|
|
|
|
|
|
|
0 |
|
|
|
|
|
|
|
|
-1 |
|
|
|
|
|
|
|
|
|
|
|
|
|
|
|
|
|
|
-2 |
|
|
|
|
|
|
|
|
-2 -1 |
0 |
1 |
2 |
3 |
4 |
5 |
6 |
Sample number
FIGURE 7-1
Simple impulse responses using shifted and scaled delta functions.
Calculus-like Operations
Convolution can change discrete signals in ways that resemble integration and differentiation. Since the terms "derivative" and "integral" specifically refer to operations on continuous signals, other names are given to their discrete counterparts. The discrete operation that mimics the first derivative is called the first difference. Likewise, the discrete form of the integral is called the

126 |
The Scientist and Engineer's Guide to Digital Signal Processing |
running sum. It is also common to hear these operations called the discrete derivative and the discrete integral, although mathematicians frown when they hear these informal terms used.
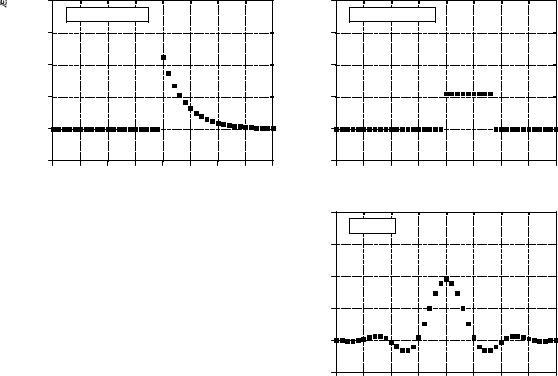
Figure 7-2 shows the impulse responses that implement the first difference and the running sum. Figure 7-3 shows an example using these operations. In 7- 3a, the original signal is composed of several sections with varying slopes. Convolving this signal with the first difference impulse response produces the signal in Fig. 7-3b. Just as with the first derivative, the amplitude of each point in the first difference signal is equal to the slope at the corresponding location in the original signal. The running sum is the inverse operation of the first difference. That is, convolving the signal in (b), with the running sum's impulse response, produces the signal in (a).
These impulse responses are simple enough that a full convolution program is usually not needed to implement them. Rather, think of them in the alternative mode: each sample in the output signal is a sum of weighted samples from the input. For instance, the first difference can be calculated:
EQUATION 7-4
Calculation of the first difference. In this relation, x [n] is the original signal, and y [n] is the first difference.
y [n ] ' x [n ] & x [n & 1]
That is, each sample in the output signal is equal to the difference between two adjacent samples in the input signal. For instance, y[40] ' x[40] & x[39] . It should be mentioned that this is not the only way to define a discrete derivative. Another common method is to define the slope symmetrically around the point being examined, such as: y[n] ' ( x[n% 1] & x[n& 1] )/ 2 .
2
a. First Difference
This is the discrete version of the first derivative. Each sample in the output signal is equal to the difference between adjacent samples in the input signal. In other words, the output signal is the slope of the input signal.
Amplitude
1 |
|
|
|
|
|
|
|
0 |
|
|
|
|
|
|
|
-1 |
|
|
|
|
|
|
|
-2 |
|
|
|
|
|
|
|
-2 -1 |
0 |
1 |
2 |
3 |
4 |
5 |
6 |
b. Running Sum
The running sum is the discrete version of the integral. Each sample in the output signal is equal to the sum of all samples in the input signal to the left. Note that the impulse response extends to infinity, a rather nasty feature.
Sample number
|
2 |
|
|
|
|
|
|
|
Amplitude |
1 |
|
|
|
|
|
|
|
0 |
|
|
|
|
|
|
|
|
|
|
|
|
|
|
|
|
|
|
-1 |
|
|
|
|
|
|
|
|
-2 |
|
|
|
|
|
|
|
|
-2 -1 |
0 |
1 |
2 |
3 |
4 |
5 |
6 |
Sample number
FIGURE 7-2
Impulse responses that mimic calculus operations.

Chapter 7- Properties of Convolution |
127 |
FIGURE 7-3
Example of calculus-like operations. The signal in (b) is the first difference of the signal in (a). Correspondingly, the signal is
(a) is the running sum of the signal in (b). These processing methods are used with discrete signals the same as differentiation and integration are used with continuous signals.
2.0
|
a. Original signal |
|
Amplitude |
1.0 |
|
0.0 |
||
|
||
|
-1.0 |
|
|
-2.0 |
0 |
10 |
20 |
30 |
40 |
50 |
60 |
70 |
80 |
|
|
|
Sample number |
|
|
|
||
|
|
|
First |
|
|
Running |
|
|
|
|
|
Difference |
|
|
|
Sum |
|
|
|
|
0.2 |
|
|
|
|
|
|
|
|
|
|
b. First difference |
|
|
|
|
|||
Amplitude |
0.1 |
|
|
|
|
|
|
|
|
0.0 |
|
|
|
|
|
|
|
|
|
|
|
|
|
|
|
|
|
|
|
|
-0.1 |
|
|
|
|
|
|
|
|
|
-0.2 |
|
|
|
|
|
|
|
|
|
0 |
10 |
20 |
30 |
40 |
50 |
60 |
70 |
80 |
Sample number
Using this same approach, each sample in the running sum can be calculated by summing all points in the original signal to the left of the sample's location. For instance, if y[n] is the running sum of x[n] , then sample y[40] is found by adding samples x[0] through x[40] . Likewise, sample y[41] is found by adding samples x[0] through x[41] . Of course, it would be very inefficient to calculate the running sum in this manner. For example, if y[40] has already been c a l c u l a t e d , y[41] c a n b e c a l c u l a t e d w i t h o n l y a s i n g l e a d d i t i o n : y[41] ' x[41] % y[40] . In equation form:
EQUATION 7-5
Calculation of the running sum. In this relation, x [n] is the original signal, and y [n] is the running sum.
y [n ] ' x [n ] % y [n & 1]
Relations of this type are called recursion equations or difference equations. We will revisit them in Chapter 19. For now, the important idea to understand is that these relations are identical to convolution using the impulse responses of Fig. 7-2. Table 7-1 provides computer programs that implement these calculus-like operations.
128 |
The Scientist and Engineer's Guide to Digital Signal Processing |
||
100 |
'Calculation of the First Difference |
100 |
'Calculation of the running sum |
110 |
Y[0] = 0 |
110 |
Y[0] = X[0] |
120 |
FOR I% = 1 TO N%-1 |
120 |
FOR I% = 1 TO N%-1 |
130 |
Y[I%] = X[I%] - X[I%-1] |
130 |
Y[I%] = Y[I%-1] + X[I%] |
140 |
NEXT I% |
140 |
NEXT I% |
Table 7-1
Programs for calculating the first difference and running sum. The original signal is held in X[ ], and the processed signal (the first difference or running sum) is held in Y[ ]. Both arrays run from 0 to N%-1.
Low-pass and High-pass Filters
The design of digital filters is covered in detail in later chapters. For now, be satisfied to understand the general shape of low-pass and high-pass filter kernels (another name for a filter's impulse response). Figure 7-4 shows several common low-pass filter kernels. In general, low-pass filter kernels are composed of a group of adjacent positive points. This results in each sample in the output signal being a weighted average of many adjacent points from the input signal. This averaging smoothes the signal, thereby removing highfrequency components. As shown by the sinc function in (c), some low-pass filter kernels include a few negative valued samples in the tails. Just as in analog electronics, digital low-pass filters are used for noise reduction, signal separation, wave shaping, etc.
|
0.4 |
|
|
|
|
|
|
|
|
|
|
a. Exponential |
|
|
|
|
|
||
Amplitude |
0.3 |
|
|
|
|
|
|
|
|
0.1 |
|
|
|
|
|
|
|
|
|
|
0.2 |
|
|
|
|
|
|
|
|
|
0.0 |
|
|
|
|
|
|
|
|
|
-0.1 |
|
|
|
|
|
|
|
|
|
-20 |
-15 |
-10 |
-5 |
0 |
5 |
10 |
15 |
20 |
Sample number
FIGURE 7-4
Typical low-pass filter kernels. Low-pass filter kernels are formed from a group of adjacent positive points that provide an averaging (smoothing) of the signal. As discussed in later chapters, each of these filter kernels is best for a particular purpose. The exponential, (a), is the simplest recursive filter. The rectangular pulse, (b), is best at reducing noise while maintaining edge sharpness. The sinc function in (c), a curve of the form: sin(x)/(x) , is used to separate one band of frequencies from another.
|
0.4 |
|
|
|
|
|
|
|
|
|
|
b. Square pulse |
|
|
|
|
|
||
Amplitude |
0.3 |
|
|
|
|
|
|
|
|
0.1 |
|
|
|
|
|
|
|
|
|
|
0.2 |
|
|
|
|
|
|
|
|
|
0.0 |
|
|
|
|
|
|
|
|
|
-0.1 |
|
|
|
|
|
|
|
|
|
-20 |
-15 |
-10 |
-5 |
0 |
5 |
10 |
15 |
20 |
|
|
|
|
Sample number |
|
|
|
||
|
0.4 |
|
|
|
|
|
|
|
|
|
|
c. Sinc |
|
|
|
|
|
|
|
Amplitude |
0.3 |
|
|
|
|
|
|
|
|
0.1 |
|
|
|
|
|
|
|
|
|
|
0.2 |
|
|
|
|
|
|
|
|
|
0.0 |
|
|
|
|
|
|
|
|
|
-0.1 |
|
|
|
|
|
|
|
|
|
-20 |
-15 |
-10 |
-5 |
0 |
5 |
10 |
15 |
20 |
Sample number
Chapter 7- Properties of Convolution |
129 |
Amplitude
1.5 |
|
1.50 |
|
a. Exponential |
|
b. Square pulse |
|
1.0 |
Amplitude |
1.00 |
|
0.5 |
0.50 |
||
|
0.0 |
|
|
|
|
|
|
|
|
0.00 |
|
|
|
|
|
|
|
|
-0.5 |
|
|
|
|
|
|
|
|
-0.50 |
|
|
|
|
|
|
|
|
-20 |
-15 |
-10 |
-5 |
0 |
5 |
10 |
15 |
20 |
-20 |
-15 |
-10 |
-5 |
0 |
5 |
10 |
15 |
20 |
|
|
|
Sample number |
|
|
|
|
|
|
Sample number |
|
|
|
||||
FIGURE 7-5
Typical high-pass filter kernels. These are formed by subtracting the corresponding lowpass filter kernels in Fig. 7-4 from a delta function. The distinguishing characteristic of high-pass filter kernels is a spike surrounded by many adjacent negative samples.
|
1.50 |
|
|
|
|
|
|
|
|
|
|
c. Sinc |
|
|
|
|
|
|
|
|
1.00 |
|
|
|
|
|
|
|
|
Amplitude |
0.50 |
|
|
|
|
|
|
|
|
|
|
|
|
|
|
|
|
|
|
|
0.00 |
|
|
|
|
|
|
|
|
|
-0.50 |
|
|
|
|
|
|
|
|
|
-20 |
-15 |
-10 |
-5 |
0 |
5 |
10 |
15 |
20 |
Sample number
The cutoff frequency of the filter is changed by making filter kernel wider or narrower. If a low-pass filter has a gain of one at DC (zero frequency), then the sum of all of the points in the impulse response must be equal to one. As illustrated in (a) and (c), some filter kernels theoretically extend to infinity without dropping to a value of zero. In actual practice, the tails are truncated after a certain number of samples, allowing it to be represented by a finite number of points. How else could it be stored in a computer?
Figure 7-5 shows three common high-pass filter kernels, derived from the corresponding low-pass filter kernels in Fig. 7-4. This is a common strategy in filter design: first devise a low-pass filter and then transform it to what you need, high-pass, band-pass, band-reject, etc. To understand the low-pass to high-pass transform, remember that a delta function impulse response passes the entire signal, while a low-pass impulse response passes only the lowfrequency components. By superposition, a filter kernel consisting of a delta function minus the low-pass filter kernel will pass the entire signal minus the low-frequency components. A high-pass filter is born! As shown in Fig. 7-5, the delta function is usually added at the center of symmetry, or sample zero if the filter kernel is not symmetrical. High-pass filters have zero gain at DC (zero frequency), achieved by making the sum of all the points in the filter kernel equal to zero.
130 |
The Scientist and Engineer's Guide to Digital Signal Processing |
|
0.4 |
|
|
|
|
|
|
|
a. Causal |
|
|
|
|
|
|
Amplitude |
0.3 |
|
|
|
|
|
|
0.1 |
|
|
|
|
|
|
|
|
0.2 |
|
|
|
|
|
|
|
0.0 |
|
|
|
|
|
|
|
-0.1 |
|
|
|
|
|
|
|
-20 -15 -10 |
-5 |
0 |
5 |
10 |
15 |
20 |
Sample number
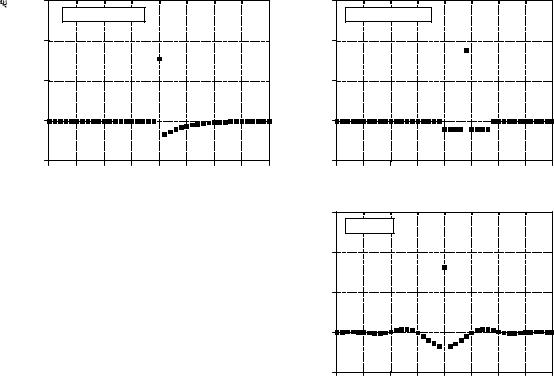
FIGURE 7-6
Examples of causal signals. An impulse response, or any signal, is said to be causal if all negative numbered samples have a value of zero. Three examples are shown here. Any noncausal signal with a finite number of points can be turned into a causal signal simply by shifting.
|
0.4 |
|
|
|
|
|
|
|
|
|
|
b. Causal |
|
|
|
|
|
|
|
Amplitude |
0.3 |
|
|
|
|
|
|
|
|
0.1 |
|
|
|
|
|
|
|
|
|
|
0.2 |
|
|
|
|
|
|
|
|
|
0.0 |
|
|
|
|
|
|
|
|
|
-0.1 |
|
|
|
|
|
|
|
|
|
-20 |
-15 |
-10 |
-5 |
0 |
5 |
10 |
15 |
20 |
|
|
|
|
Sample number |
|
|
|
||
|
0.4 |
|
|
|
|
|
|
|
|
|
|
c. Noncausal |
|
|
|
|
|
||
Amplitude |
0.3 |
|
|
|
|
|
|
|
|
0.1 |
|
|
|
|
|
|
|
|
|
|
0.2 |
|
|
|
|
|
|
|
|
|
0.0 |
|
|
|
|
|
|
|
|
|
-0.1 |
|
|
|
|
|
|
|
|
|
-20 |
-15 |
-10 |
-5 |
0 |
5 |
10 |
15 |
20 |
Sample number
Causal and Noncausal Signals
Imagine a simple analog electronic circuit. If you apply a short pulse to the input, you will see a response on the output. This is the kind of cause and effect that our universe is based on. One thing we definitely know: any effect must happen after the cause. This is a basic characteristic of what we call time. Now compare this to a DSP system that changes an input signal into an output signal, both stored in arrays in a computer. If this mimics a real world system, it must follow the same principle of causality as the real world does. For example, the value at sample number eight in the input signal can only affect sample number eight or greater in the output signal. Systems that operate in this manner are said to be causal. Of course, digital processing doesn't necessarily have to function this way. Since both the input and output signals are arrays of numbers stored in a computer, any of the input signal values can affect any of the output signal values.
As shown by the examples in Fig. 7-6, the impulse response of a causal system must have a value of zero for all negative numbered samples. Think of this from the input side view of convolution. To be causal, an impulse in the input signal at sample number n must only affect those points in the output signal with a sample number of n or greater. In common usage, the term causal is applied to any signal where all the negative numbered samples have a value of zero, whether it is an impulse response or not.
Chapter 7- Properties of Convolution |
131 |
|
0.4 |
|
|
|
|
|
|
|
a. Zero phase |
|
|
|
|
|
|
Amplitude |
0.3 |
|
|
|
|
|
|
0.1 |
|
|
|
|
|
|
|
|
0.2 |
|
|
|
|
|
|
|
0.0 |
|
|
|
|
|
|
|
-0.1 |
|
|
|
|
|
|
|
-20 -15 -10 |
-5 |
0 |
5 |
10 |
15 |
20 |
Sample number
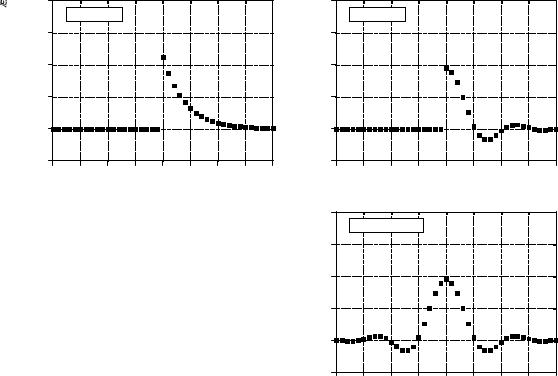
FIGURE 7-7
Examples of phase linearity. Signals that have a left-right symmetry are said to be linear phase. If the axis of symmetry occurs at sample number zero, they are additionally said to be zero phase. Any linear phase signal can be transformed into a zero phase signal simply by shifting. Signals that do not have a leftright symmetry are said to be nonlinear phase. Do not confuse these terms with the linear in linear systems. They are completely different concepts.
|
0.4 |
|
|
|
|
|
|
|
|
|
|
b. Linear phase |
|
|
|
|
|
||
Amplitude |
0.3 |
|
|
|
|
|
|
|
|
0.1 |
|
|
|
|
|
|
|
|
|
|
0.2 |
|
|
|
|
|
|
|
|
|
0.0 |
|
|
|
|
|
|
|
|
|
-0.1 |
|
|
|
|
|
|
|
|
|
-20 |
-15 |
-10 |
-5 |
0 |
5 |
10 |
15 |
20 |
|
|
|
|
Sample number |
|
|
|
||
|
0.4 |
|
|
|
|
|
|
|
|
|
|
c. Nonlinear phase |
|
|
|
|
|
||
Amplitude |
0.3 |
|
|
|
|
|
|
|
|
0.1 |
|
|
|
|
|
|
|
|
|
|
0.2 |
|
|
|
|
|
|
|
|
|
0.0 |
|
|
|
|
|
|
|
|
|
-0.1 |
|
|
|
|
|
|
|
|
|
-20 |
-15 |
-10 |
-5 |
0 |
5 |
10 |
15 |
20 |
Sample number
Zero Phase, Linear Phase, and Nonlinear Phase
As shown in Fig. 7-7, a signal is said to be zero phase if it has left-right symmetry around sample number zero. A signal is said to be linear phase if it has left-right symmetry, but around some point other than zero. This means that any linear phase signal can be changed into a zero phase signal simply by shifting left or right. Lastly, a signal is said to be nonlinear phase if it does not have left-right symmetry.
You are probably thinking that these names don't seem to follow from their definitions. What does phase have to do with symmetry? The answer lies in the frequency spectrum, and will be discussed in more detail in later chapters. Briefly, the frequency spectrum of any signal is composed of two parts, the magnitude and the phase. The frequency spectrum of a signal that is symmetrical around zero has a phase that is zero. Likewise, the frequency spectrum of a signal that is symmetrical around some nonzero point has a phase that is a straight line, i.e., a linear phase. Lastly, the frequency spectrum of a signal that is not symmetrical has a phase that is not a straight line, i.e., it has a nonlinear phase.
A special note about the potentially confusing terms: linear and nonlinear phase. What does this have to do the concept of system linearity discussed in previous chapters? Absolutely nothing! System linearity is the broad concept

132 |
The Scientist and Engineer's Guide to Digital Signal Processing |
that nearly all of DSP is based on (superposition, homogeneity, additivity, etc). Linear and nonlinear phase mean that the phase is, or is not, a straight line. In fact, a system must be linear even to say that the phase is zero, linear, or nonlinear.
Mathematical Properties
Commutative Property
The commutative property for convolution is expressed in mathematical form:
EQUATION 7-6
The commutative property of convolution. This states that the order in which signals are convolved can be exchanged.
a [n ] ( b [n ] ' b [n ] ( a [n ]
In words, the order in which two signals are convolved makes no difference; the results are identical. As shown in Fig. 7-8, this has a strange meaning for system theory. In any linear system, the input signal and the system's impulse response can be exchanged without changing the output signal. This is interesting, but usually doesn't have any physical meaning. The input signal and the impulse response are very different things. Just because the mathematics allows you to do something, doesn't mean that it makes sense to do it. For example, suppose you make: $10/hour × 2,000 hours/year = $20,000/year. The commutative property for multiplication provides that you can make the same annual salary by only working 10 hours/year at $2000/hour. Let's see you convince your boss that this is meaningful! In spite of this, the commutative property sees great use in DSP for manipulating equations, just as in ordinary algebra.
IF
a[n] 
 b[n]
b[n]  y[n]
y[n]
THEN
b[n] 
 a[n]
a[n]  y[n]
y[n]
FIGURE 7-8
The commutative property in system theory. The commutative property of convolution allows the input signal and the impulse response of a system to be exchanged without changing the output. While interesting, this usually has no physical significance. (A signal appearing inside of a box, such as b[n] and a[n] in this figure, represent the impulse response of the system).