

СТАТИСТИКА 1 / Министерство транспорта США / Alaska Transportation Statistics 2008
.pdfPassenger Travel
Table 4-1: Commuting to Work: 2000
|
Alaska |
|
United States |
||
Mode |
Number |
Percent |
|
Number |
Percent |
Total |
286,788 |
100.0 |
|
127,448,586 |
100.0 |
Car, truck, or van -- drove alone |
196,611 |
68.6 |
97,243,457 |
76.3 |
|
Car, truck, or van -- carpooled |
38,362 |
13.4 |
14,299,090 |
11.2 |
|
Public transportation (including taxi) |
7,894 |
2.8 |
6,592,685 |
5.2 |
|
Walked |
21,432 |
7.5 |
3,417,546 |
2.7 |
|
Other means |
12,247 |
4.3 |
1,820,578 |
1.4 |
|
Worked at home |
9,242 |
3.2 |
4,075,230 |
3.2 |
|
Mean travel time to work (minutes) |
18.2 |
|
24.3 |
|
|
NOTE: Data are for workers 16 years and over.
SOURCE: U.S. Department of Commerce, U.S. Census Bureau, Census 2000 Supplementary Survey, Profile of Selected Economic Characteristics, United States, California , available at http://www.census.gov/c2ss/www/ as of Oct. 16, 2001.
Table 4-2: Licensed Drivers: 2000
|
Alaska |
|
United States |
||
Licensed drivers |
Number |
Percent |
|
Number |
Percent |
Total |
465,256 |
100.0 |
190,625,023 |
100.0 |
|
Male |
215,821 |
46.4 |
95,796,069 |
50.3 |
|
Female |
249,435 |
53.6 |
94,828,953 |
49.7 |
|
Figure 4-1: Licensed Drivers in Alaska by Age and Sex: 2000
35,000 |
|
|
|
|
|
|
|
|
|
|
|
|
|
|
30,000 |
|
|
|
|
|
|
|
|
|
|
|
|
|
|
|
|
|
|
|
|
|
|
|
|
Male |
|
|
|
|
25,000 |
|
|
|
|
|
|
|
|
|
Female |
|
|
|
|
20,000 |
|
|
|
|
|
|
|
|
|
|
|
|
|
|
15,000 |
|
|
|
|
|
|
|
|
|
|
|
|
|
|
10,000 |
|
|
|
|
|
|
|
|
|
|
|
|
|
|
5,000 |
|
|
|
|
|
|
|
|
|
|
|
|
|
|
0 |
|
|
|
|
|
|
|
|
|
|
|
|
|
|
19 and |
20-24 |
25-29 |
30-34 |
35-39 |
40-44 |
45-49 |
50-54 |
55-59 |
60-64 |
65-69 |
70-74 |
75-79 |
80-84 |
85 and |
under |
|
|
|
|
|
|
Age |
|
|
|
|
|
|
over |
|
|
|
|
|
|
|
|
|
|
|
|
|
|
|
SOURCE FOR TABLE 4-2 and FIGURE 4-1: U.S. Department of Transportation, Federal Highway
Administration, Highway Statistics 2000 , Washington, DC: 2001.
BTS State Transportation Profile |
D-1 |
Alaska |

Table 4-3: Urban Transit Agencies in Alaska: 2000
|
|
|
|
|
|
|
Vehicles |
|
|
|
Annual |
Average |
Operating |
Capital |
available |
|
|
|
unlinked |
weekday |
funds |
funds |
for |
|
|
Urbanized passenger trips unlinked trips |
expended |
expended |
maximum |
||
Transit agencies |
Modes provided |
area |
(thousands) |
(thousands) |
($ millions) |
($ millions) |
service |
Municipality of Anchorage-Public Transportation |
Bus, demand responsive, |
Anchorage |
3,591 |
12.3 |
12.6 |
1.6 |
107 |
Department (People Mover) |
vanpool |
|
|
|
|
|
|
SOURCE: U.S. Department of Transportation, Federal Transit Administration, National Transit Database, available at
http://www.ntdprogram.com/NTD/Profiles.nsf/ProfileInformation?OpenForm&2000&All as of Dec. 6, 2001.

Passenger Travel
Table 4-4: Incoming Personal Vehicle Crossings, U.S. - Canadian Border (Thousands)
State/port |
1995 |
1996 |
1997 |
1998 |
1999 |
2000 |
Alaska |
125 |
117 |
115 |
124 |
120 |
118 |
Alcan |
62 |
57 |
55 |
63 |
65 |
59 |
Dalton Cache |
22 |
21 |
20 |
21 |
17 |
20 |
Skagway |
41 |
38 |
39 |
40 |
37 |
39 |
Idaho |
247 |
239 |
234 |
219 |
219 |
209 |
Maine |
4,436 |
4,273 |
4,263 |
4,026 |
3,903 |
3,909 |
Michigan |
11,427 |
11,859 |
11,776 |
12,019 |
12,396 |
11,970 |
Minnesota |
1,104 |
1,100 |
1,024 |
1,049 |
1,137 |
1,104 |
Montana |
560 |
530 |
540 |
526 |
577 |
490 |
New York |
10,694 |
10,773 |
11,101 |
10,555 |
10,658 |
10,833 |
North Dakota |
754 |
705 |
666 |
620 |
636 |
632 |
Vermont |
1,640 |
1,630 |
1,539 |
1,422 |
1,573 |
1,599 |
Washington |
8,158 |
8,305 |
7,694 |
6,036 |
6,002 |
6,052 |
United States |
39,146 |
39,531 |
38,950 |
36,597 |
37,220 |
36,915 |
Table 4-5: Incoming Passengers in Personal Vehicles, U.S. - Canadian Border (Thousands)
State/port |
1995 |
1996 |
1997 |
1998 |
1999 |
2000 |
Alaska |
271 |
259 |
257 |
303 |
260 |
264 |
Alcan |
128 |
122 |
118 |
161 |
138 |
127 |
Dalton Cache |
50 |
46 |
44 |
45 |
87 |
43 |
Skagway |
93 |
91 |
94 |
98 |
36 |
94 |
Idaho |
595 |
533 |
540 |
497 |
526 |
510 |
Maine |
9,883 |
9,535 |
9,216 |
8,549 |
8,176 |
7,968 |
Michigan |
32,425 |
34,869 |
27,690 |
29,634 |
29,456 |
32,471 |
Minnesota |
3,049 |
3,028 |
2,782 |
2,882 |
2,932 |
3,040 |
Montana |
1,717 |
1,639 |
1,661 |
1,616 |
1,806 |
1,453 |
New York |
24,583 |
26,097 |
27,579 |
26,083 |
25,478 |
25,302 |
North Dakota |
1,975 |
1,861 |
1,700 |
1,577 |
1,629 |
1,675 |
Vermont |
3,408 |
3,541 |
3,275 |
3,042 |
3,302 |
3,123 |
Washington |
18,901 |
19,708 |
17,948 |
14,100 |
15,803 |
14,239 |
United States |
96,807 |
101,071 |
92,647 |
88,283 |
89,369 |
90,047 |
Table 4-6: Incoming Train Passengers, U.S. - Canadian Border |
|
|||||
(Thousands) |
|
|
|
|
|
|
State/port |
1995 |
1996 |
1997 |
1998 |
1999 |
2000 |
Alaska |
19 |
23 |
22 |
31 |
28 |
35 |
Alcan |
NA |
NA |
NA |
NA |
NA |
NA |
Dalton Cache |
NA |
NA |
NA |
NA |
NA |
NA |
Skagway |
19 |
23 |
22 |
31 |
28 |
35 |
Idaho |
2 |
1 |
1 |
2 |
2 |
2 |
Maine |
3 |
3 |
3 |
3 |
3 |
3 |
Michigan |
36 |
44 |
47 |
53 |
52 |
54 |
Minnesota |
30 |
26 |
26 |
20 |
20 |
20 |
Montana |
1 |
1 |
1 |
1 |
1 |
1 |
New York |
82 |
62 |
73 |
76 |
85 |
93 |
North Dakota |
4 |
4 |
4 |
4 |
5 |
5 |
Vermont |
13 |
3 |
4 |
3 |
3 |
3 |
Washington |
39 |
47 |
67 |
52 |
50 |
52 |
United States |
227 |
214 |
249 |
246 |
249 |
270 |
KEY FOR DATA ON THIS PAGE: NA = not applicable.
SOURCE FOR DATA ON THIS PAGE: U.S. Department of Transportation, Bureau of Transportation Statistics, special tabulation, August 2001. Based on the following primary data source: U.S. Department of Treasury, U.S. Customs Service, Office of Field Operations, Operations Management Database, special tabulation, Washington, DC: 2001.
BTS State Transportation Profile |
D-3 |
Alaska |
Passenger Travel
Table 4-7: Incoming Bus Crossings, U.S. - Canadian Border (Thousands)
State/port |
1995 |
1996 |
1997 |
1998 |
1999 |
2000 |
Alaska |
7 |
8 |
9 |
10 |
10 |
10 |
Alcan |
<1 |
<1 |
<1 |
1 |
<1 |
<1 |
Dalton Cache |
<1 |
<1 |
<1 |
<1 |
<1 |
<1 |
Skagway |
5 |
6 |
8 |
8 |
9 |
9 |
Idaho |
<1 |
<1 |
<1 |
<1 |
<1 |
<1 |
Maine |
2 |
2 |
2 |
2 |
2 |
2 |
Michigan |
51 |
53 |
31 |
48 |
51 |
54 |
Minnesota |
5 |
5 |
4 |
4 |
4 |
4 |
Montana |
2 |
2 |
2 |
2 |
3 |
2 |
New York |
68 |
71 |
81 |
74 |
77 |
85 |
North Dakota |
4 |
3 |
3 |
3 |
3 |
3 |
Vermont |
6 |
6 |
6 |
6 |
6 |
7 |
Washington |
21 |
23 |
25 |
23 |
24 |
22 |
United States |
166 |
173 |
164 |
173 |
182 |
189 |
Table 4-8: Incoming Passengers on Buses, U.S. - Canadian Border |
|
|||||
(Thousands) |
|
|
|
|
|
|
State/port |
1995 |
1996 |
1997 |
1998 |
1999 |
2000 |
Alaska |
86 |
107 |
133 |
150 |
156 |
149 |
Alcan |
21 |
22 |
20 |
23 |
16 |
16 |
Dalton Cache |
3 |
3 |
3 |
4 |
2 |
2 |
Skagway |
63 |
82 |
109 |
123 |
138 |
131 |
Idaho |
9 |
11 |
12 |
14 |
18 |
18 |
Maine |
74 |
66 |
61 |
110 |
60 |
64 |
Michigan |
754 |
792 |
671 |
767 |
864 |
1,157 |
Minnesota |
104 |
96 |
100 |
93 |
100 |
98 |
Montana |
53 |
45 |
46 |
44 |
54 |
40 |
New York |
1,624 |
1,880 |
2,195 |
1,948 |
2,245 |
2,475 |
North Dakota |
134 |
117 |
117 |
119 |
117 |
112 |
Vermont |
165 |
180 |
177 |
174 |
180 |
192 |
Washington |
526 |
577 |
613 |
550 |
573 |
567 |
United States |
3,530 |
3,870 |
4,124 |
3,970 |
4,367 |
4,873 |
Table 4-9: Incoming Pedestrians, U.S. - Canadian Border |
|
|
||||
(Thousands) |
|
|
|
|
|
|
State/port |
1995 |
1996 |
1997 |
1998 |
1999 |
2000 |
Alaska |
<1 |
<1 |
<1 |
<1 |
<1 |
<1 |
Alcan |
<1 |
<1 |
<1 |
<1 |
<1 |
<1 |
Dalton Cache |
<1 |
<1 |
<1 |
<1 |
<1 |
<1 |
Skagway |
<1 |
0 |
<1 |
0 |
<1 |
0 |
Idaho |
3 |
2 |
4 |
3 |
3 |
3 |
Maine |
120 |
113 |
112 |
122 |
121 |
122 |
Michigan |
35 |
33 |
15 |
U |
U |
U |
Minnesota |
39 |
36 |
38 |
45 |
26 |
28 |
Montana |
13 |
18 |
16 |
16 |
21 |
14 |
New York |
361 |
267 |
225 |
306 |
313 |
287 |
North Dakota |
10 |
11 |
10 |
10 |
8 |
7 |
Vermont |
23 |
22 |
23 |
22 |
29 |
22 |
Washington |
93 |
105 |
105 |
74 |
67 |
102 |
United States |
698 |
608 |
550 |
598 |
588 |
585 |
KEY: U = data are unavailable.
SOURCE FOR DATA ON THIS PAGE: U.S. Department of Transportation, Bureau of Transportation Statistics, special tabulation, August 2001. Based on the following primary data source: U.S. Department of Treasury, U.S. Customs Service, Office of Field Operations, Operations Management Database, special tabulation, Washington, DC: 2001.
Alaska |
D-4 |
BTS State Transportation Profile |
Passenger Travel
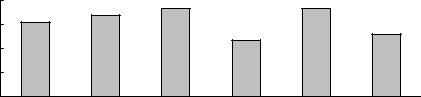
Figure 4-2: Overseas Visitors to Alaska1
(thousands) |
80 |
68.0 |
73.0 |
|
73.0 |
|
|
|
|
|
|||
62.0 |
|
|
|
|
52.0 |
|
60 |
|
|
47.0 |
|
||
|
|
|
|
|
||
40 |
|
|
|
|
|
|
|
|
|
|
|
|
|
Visitors |
20 |
|
|
|
|
|
0 |
|
|
|
|
|
|
|
|
|
|
|
|
|
|
1995 |
1996 |
1997 |
1998 |
1999 |
2000 |
1International travelers to the United States from Canada and Mexico are not included.
SOURCES: U.S. Department of Commerce, International Trade Administration, Office of Tourism Industries, Overseas Visitors ot Select U.S. States and Territories 2000-1999 (Ranked by 2000 Market Share), Washington, DC: 2001, available at http://tinet.ita.doc.gov/ as of Oct. 19, 2001; U.S. Department of Commerce, International Trade Administration, Office of Tourism Industries, Overseas Visitors ot Select U.S. States and Territories 1996-1995 , Washington, DC: 2001, available at http://tinet.ita.doc.gov/ as of Nov. 13, 2001.
BTS State Transportation Profile |
D-5 |
Alaska |
D-6
E Registered Vehicles and
Vehicle-Miles Traveled

Vehicles
Table 5-1: Alaska and U.S. Motor-Vehicle Registrations: 2000
|
Private and |
Publicly |
Alaska |
United States |
Motor vehicle type |
commercial |
owned |
total |
total |
All motor vehicles |
597,746 |
25,476 |
623,222 |
225,821,241 |
Automobiles |
241,775 |
2,530 |
244,305 |
133,621,420 |
Buses |
2,120 |
390 |
2,510 |
746,125 |
Trucks1 |
337,788 |
9,796 |
347,584 |
87,107,628 |
Light trucks |
330,018 |
U |
330,018 |
77,796,827 |
Farm trucks |
530 |
U |
530 |
1,885,170 |
Truck tractors |
3,019 |
U |
3,019 |
1,587,611 |
Motorcycles |
16,063 |
44 |
16,107 |
4,346,068 |
1Includes light trucks (pickups, vans, sport utility vehicles, and other light trucks) as well as medium and large trucks.
KEY: U = data are unavailable.
SOURCE: U.S. Department of Transportation, Federal Highway Administration, Highway Statistics 2000 , Washington, DC: 2001, tables MV-1 and MV-9.
Table 5-2: Alaska and U.S. Trailer and Semi-Trailer
Registrations: 20001
Type |
Alaska |
United States |
|
Total |
100,989 |
21,541,490 |
|
Private and commercial |
99,222 |
21,283,681 |
|
Commercial trailers2 |
12,390 |
4,685,606 |
|
Light farm trailers, car trailers, etc.3 |
86,832 |
14,113,392 |
|
House trailers |
U |
2,484,683 |
|
Publicly owned |
1,767 |
257,809 |
|
Federal government |
133 |
4,277 |
|
State, county, municipal government |
1,634 |
253,532 |
|
1The completeness of data on trailer registrations varies greatly among states. Data are reported to the extent available and, in some cases, are supplemented by estimates of the Federal Highway Administration.
2This row includes all commercial type vehicles and semi-trailers that are in private or for-hire use.
3Several states do not require the registration of light farm or automobile trailers.
KEY: U = data are unavailable.
NOTE: Mobile homes and house trailers are shown for states that require registration and are able to segregate them from other trailers. In states where this classification is not available, house trailers are included with light car trailers.
SOURCE: U.S. Department of Transportation, Federal Highway Administration, Highway Statistics 2000 , Washington, DC: 2001, table MV-11.
BTS State Transportation Profile |
E-1 |
Alaska |

Vehicles
Table 5-3: Alaska Truck Characteristics and Use: 1997 (Percent unless otherwise specified)
|
|
Trucks, |
|
|
excluding |
|
|
pickups, |
|
|
panels, vans, |
|
|
sport utilities, |
Vehicular and operational |
|
and station |
characteristics |
All trucks |
wagons |
Total, number (thousands) |
248.4 |
12.6 |
Major use |
100 |
100 |
Agriculture |
4.2 |
5.0 |
Forestry and lumbering |
0.4 |
3.0 |
Mining and quarrying |
0.5 |
3.5 |
Construction |
7.4 |
38.6 |
Manufacturing |
0.8 |
1.8 |
Wholesale and retail trade |
4.3 |
15.8 |
For-hire transportation |
1.2 |
12.6 |
Utilities and service |
6.1 |
8.6 |
Personal transportation |
70.7 |
5.6 |
Other and not reported |
4.3 |
5.5 |
Body type |
100. |
100 |
Pickup, panel, minivan, and |
94.9 |
|
sport utility |
1.7 |
NA |
Platform and cattlerack |
0.8 |
33.1 |
Van |
0.1 |
16.7 |
Public utility |
0.6 |
2.4 |
Multistop or stepvans |
0.8 |
11.9 |
Dump |
0.4 |
15.0 |
Tank for liquids or dry bulk |
0.7 |
7.7 |
Other or not reported |
|
13.2 |
Vehicle size |
100 |
100 |
Light |
96.3 |
29.7 |
Medium |
1.1 |
18.1 |
Light-heavy |
0.7 |
13.1 |
Heavy-heavy |
2.0 |
39.1 |
Annual miles driven |
100 |
100 |
Less than 5,000 |
28.2 |
49.1 |
5,000 to 9,999 |
24.3 |
18.2 |
10,000 to 19,999 |
37.3 |
15.9 |
20,000 to 29,999 |
7.3 |
6.9 |
30,000 or more |
2.9 |
9.9 |
|
|
Trucks, |
|
|
excluding |
|
|
pickups, |
|
|
panels, vans, |
|
|
sport utilities, |
Vehicular and operational |
|
and station |
characteristics |
All trucks |
wagons |
Year model |
100 |
100 |
1 to 2 years old |
8.5 |
6.2 |
3 to 4 years old |
14.8 |
6.5 |
Over 4 years old |
76.7 |
87.3 |
Vehicle acquisition |
100 |
100 |
Purchased new |
33.4 |
28.8 |
Purchased used |
63.4 |
64.7 |
Leased from someone or |
|
|
not reported |
3.2 |
6.5 |
Truck type |
100 |
100 |
Single-unit trucks |
98.5 |
78.5 |
2 axles |
97.5 |
60.3 |
3 axles or more |
0.9 |
18.2 |
Combination |
1.5 |
21.5 |
3 axles |
0.2 |
0.3 |
4 axles |
0.54 |
4.0 |
5 axles or more |
0.9 |
17.2 |
Trailer not specified |
V |
V |
Range of operation |
100 |
100 |
Local |
78.1 |
67.8 |
Short-range |
9.9 |
10.7 |
Long-range |
7.7 |
8.3 |
Off-the-road or not |
|
|
reported |
4.3 |
13.2 |
Fuel type |
100 |
100 |
Gasoline |
90.7 |
40.3 |
Diesel, liquefied gas, |
9.3 |
59 |
and other |
V |
0.7 |
Not reported |
|
|
KEY: NA = not applicable; V = represents less than .05 percent.
SOURCE: U.S. Department of Commerce, U.S. Census Bureau, Vehicle Inventory and Use Survey, California, state-specific reports, Washington, DC: 1999, available at http://www.census.gov/econ/www/viusmain.html as of Dec. 27, 2001.
Alaska |
E-2 |
BTS State Transportation Profile |