

СТАТИСТИКА 1 / Министерство транспорта США / Alaska Transportation Statistics 2008
.pdfSafety
Table 2-5: Pedestrian Fatalities Involving Motor Vehicles: 2000
|
|
|
Pedestrian |
|
Pedestrian |
|
|
|
fatalities as |
State |
fatality rate per |
|
Total traffic |
Pedestrian |
percent of |
population |
100,000 |
State |
fatalities |
s killed |
total |
(thousands) |
population |
Alabama |
995 |
61 |
6.1 |
4,451 |
1.4 |
Alaska |
103 |
8 |
7.8 |
653 |
1.2 |
Arizona |
1,036 |
130 |
12.5 |
4,798 |
2.7 |
Arkansas |
652 |
38 |
5.8 |
2,631 |
1.4 |
California |
3,753 |
670 |
17.9 |
32,521 |
2.1 |
Colorado |
681 |
80 |
11.7 |
4,168 |
1.9 |
Connecticut |
342 |
49 |
14.3 |
3,284 |
1.5 |
Delaware |
123 |
22 |
17.9 |
768 |
2.9 |
District of Columbia |
49 |
18 |
36.7 |
523 |
3.4 |
Florida |
2,999 |
492 |
16.4 |
15,233 |
3.2 |
Georgia |
1,541 |
137 |
8.9 |
7,875 |
1.7 |
Hawaii |
131 |
29 |
22.1 |
1,257 |
2.3 |
Idaho |
276 |
6 |
2.2 |
1,347 |
0.4 |
Illinois |
1,418 |
187 |
13.2 |
12,051 |
1.6 |
Indiana |
875 |
51 |
5.8 |
6,045 |
0.8 |
Iowa |
445 |
25 |
5.6 |
2,900 |
0.9 |
Kansas |
461 |
19 |
4.1 |
2,668 |
0.7 |
Kentucky |
820 |
53 |
6.5 |
3,995 |
1.3 |
Louisiana |
937 |
100 |
10.7 |
4,425 |
2.3 |
Maine |
169 |
15 |
8.9 |
1,259 |
1.2 |
Maryland |
588 |
91 |
15.5 |
5,275 |
1.7 |
Massachusetts |
433 |
82 |
18.9 |
6,199 |
1.3 |
Michigan |
1,382 |
170 |
12.3 |
9,679 |
1.8 |
Minnesota |
625 |
38 |
6.1 |
4,830 |
0.8 |
Mississippi |
949 |
64 |
6.7 |
2,816 |
2.3 |
Missouri |
1,157 |
88 |
7.6 |
5,540 |
1.6 |
Montana |
237 |
11 |
4.6 |
950 |
1.2 |
Nebraska |
276 |
20 |
7.2 |
1,705 |
1.2 |
Nevada |
323 |
43 |
13.3 |
1,871 |
2.3 |
New Hampshire |
126 |
7 |
5.6 |
1,224 |
0.6 |
New Jersey |
731 |
145 |
19.8 |
8,178 |
1.8 |
New Mexico |
430 |
47 |
10.9 |
1,860 |
2.5 |
New York |
1,458 |
335 |
23.0 |
18,146 |
1.8 |
North Carolina |
1,472 |
144 |
9.8 |
7,777 |
1.9 |
North Dakota |
86 |
5 |
5.8 |
662 |
0.8 |
Ohio |
1,351 |
96 |
7.1 |
11,319 |
0.8 |
Oklahoma |
652 |
43 |
6.6 |
3,373 |
1.3 |
Oregon |
451 |
50 |
11.1 |
3,397 |
1.5 |
Pennsylvania |
1,520 |
170 |
11.2 |
12,202 |
1.4 |
Rhode Island |
80 |
6 |
7.5 |
998 |
0.6 |
South Carolina |
1,065 |
84 |
7.9 |
3,858 |
2.2 |
South Dakota |
173 |
13 |
7.5 |
777 |
1.7 |
Tennessee |
1,306 |
99 |
7.6 |
5,657 |
1.7 |
Texas |
3,769 |
412 |
10.9 |
20,119 |
2.0 |
Utah |
373 |
33 |
8.8 |
2,207 |
1.5 |
Vermont |
79 |
7 |
8.9 |
617 |
1.1 |
Virginia |
930 |
92 |
9.9 |
6,997 |
1.3 |
Washington |
632 |
66 |
10.4 |
5,858 |
1.1 |
West Virginia |
410 |
25 |
6.1 |
1,841 |
1.4 |
Wisconsin |
799 |
51 |
6.4 |
5,326 |
1.0 |
Wyoming |
152 |
12 |
7.9 |
525 |
2.3 |
United States |
41,821 |
4,739 |
11.3 |
274,634 |
1.7 |
SOURCE: U.S. Department of Transportation, National Highway Traffic Safety Administration, National Center for Statistics and Analysis, Traffic Safety Facts 2000: Pedestrians, Washington, DC: 2001, available at www.nhtsa.dot.gov/people/ncsa/factshet.html as of Dec. 5, 2001.
BTS State Transportation Profile |
B-5 |
Alaska |

Safety
Table 2-6: Motor Vehicle Fatalities Involving High Blood Alcohol Concentration (BAC ³ 0.10 grams per deciliter)
|
|
|
1995 |
|
|
|
2000 |
|
|
|
|
Fatalities |
|
|
|
|
|
|
|
|
|
|
|
|
|
|
|
|
|
involving |
|
|
|
Fatalities |
|
|
|
Total |
high blood |
|
|
Total |
involving high |
|
State |
fatalities |
alcohol |
Percent |
|
fatalities |
blood alcohol |
Percent |
|
Alabama |
|
1,113 |
381 |
34 |
|
995 |
326 |
33 |
Alaska |
87 |
37 |
42 |
103 |
44 |
43 |
||
Arizona |
1,031 |
347 |
34 |
1,036 |
354 |
34 |
||
Arkansas |
631 |
148 |
23 |
652 |
139 |
21 |
||
California |
4,192 |
1,308 |
31 |
3,753 |
1,061 |
28 |
||
Colorado |
645 |
226 |
35 |
681 |
198 |
29 |
||
Connecticut |
317 |
130 |
41 |
342 |
119 |
35 |
||
Delaware |
121 |
38 |
31 |
123 |
49 |
40 |
||
District of Columbia |
58 |
25 |
44 |
49 |
14 |
29 |
||
Florida |
2,805 |
873 |
31 |
2,999 |
930 |
31 |
||
Georgia |
1,488 |
400 |
27 |
1,541 |
438 |
28 |
||
Hawaii |
130 |
41 |
32 |
131 |
37 |
28 |
||
Idaho |
262 |
69 |
27 |
276 |
81 |
29 |
||
Illinois |
1,586 |
551 |
35 |
1,418 |
489 |
34 |
||
Indiana |
960 |
263 |
27 |
875 |
214 |
24 |
||
Iowa |
527 |
159 |
30 |
445 |
100 |
22 |
||
Kansas |
442 |
152 |
34 |
461 |
118 |
26 |
||
Kentucky |
849 |
227 |
27 |
820 |
203 |
25 |
||
Louisiana |
883 |
353 |
40 |
937 |
352 |
38 |
||
Maine |
187 |
44 |
24 |
169 |
38 |
22 |
||
Maryland |
671 |
176 |
26 |
588 |
161 |
27 |
||
Massachusetts |
444 |
148 |
33 |
433 |
153 |
35 |
||
Michigan |
1,530 |
483 |
32 |
1,382 |
397 |
29 |
||
Minnesota |
597 |
215 |
36 |
625 |
207 |
33 |
||
Mississippi |
868 |
306 |
35 |
949 |
289 |
30 |
||
Missouri |
1,109 |
450 |
41 |
1,157 |
387 |
33 |
||
Montana |
215 |
79 |
37 |
237 |
92 |
39 |
||
Nebraska |
254 |
64 |
25 |
276 |
70 |
25 |
||
Nevada |
313 |
127 |
41 |
323 |
112 |
35 |
||
New Hampshire |
118 |
30 |
25 |
126 |
40 |
31 |
||
New Jersey |
773 |
243 |
32 |
731 |
231 |
32 |
||
New Mexico |
485 |
202 |
42 |
430 |
159 |
37 |
||
New York |
1,674 |
405 |
24 |
1,458 |
293 |
20 |
||
North Carolina |
1,448 |
399 |
28 |
1,472 |
419 |
28 |
||
North Dakota |
74 |
32 |
44 |
86 |
36 |
42 |
||
Ohio |
1,366 |
344 |
25 |
1,351 |
411 |
30 |
||
Oklahoma |
669 |
205 |
31 |
652 |
169 |
26 |
||
Oregon |
572 |
176 |
31 |
451 |
132 |
29 |
||
Pennsylvania |
1,480 |
485 |
33 |
1,520 |
511 |
34 |
||
Rhode Island |
69 |
22 |
32 |
80 |
31 |
38 |
||
South Carolina |
881 |
229 |
26 |
1,065 |
329 |
31 |
||
South Dakota |
158 |
63 |
40 |
173 |
66 |
38 |
||
Tennessee |
1,259 |
420 |
33 |
1,306 |
399 |
31 |
||
Texas |
3,181 |
1,407 |
44 |
3,769 |
1,450 |
38 |
||
Utah |
326 |
69 |
21 |
373 |
68 |
18 |
||
Vermont |
106 |
33 |
31 |
79 |
27 |
34 |
||
Virginia |
900 |
272 |
30 |
930 |
257 |
28 |
||
Washington |
653 |
248 |
38 |
632 |
217 |
34 |
||
West Virginia |
376 |
132 |
35 |
410 |
149 |
36 |
||
Wisconsin |
745 |
263 |
35 |
799 |
288 |
36 |
||
Wyoming |
170 |
63 |
37 |
152 |
40 |
26 |
||
United States |
41,798 |
13,564 |
32 |
41,821 |
12,892 |
31 |
||
SOURCE: U.S. Department of Transportation, National Highway Traffic Safety Administration, National Center for Statistics and Analysis, Traffic Safety Facts 2000: State Alcohol Estimates, Washington, DC: 2001, available at www.nhtsa.dot.gov/people/ncsa/factshet.html as of Dec. 5, 2001.
Alaska |
B-6 |
BTS State Transportation Profile |

Safety
Table 2-7: Impaired Driving Laws: 2000
|
|
|
Lower BAC for youthful |
|
License sanction |
|
|
Administrative per |
Illegal per se |
DWI offenders |
(Mandatory minimum for a DWI |
||
State |
se (BAC level) |
(BAC level) |
(BAC level and age) |
offense |
Second offense |
Third offense |
Alabama |
Y-0.08 |
0.08 |
Y-0.02 (<21) |
S-90 days |
R-1 yr |
R-3 yrs |
Alaska |
Y-0.10 |
0.10 |
Y-0.00 (<21) |
R-30 days R-1 yr |
R-10 yrs |
|
Arizona |
Y-0.10 |
0.10 |
Y-0.00 (<21) |
S-90 days |
R-1 yr |
R-3 yrs |
Arkansas |
Y-0.10 |
0.10 |
Y-0.02 (<21) |
Nms |
Nms |
Nms |
California |
Y-0.08 |
0.08 |
Y-0.01 (<21) |
Nms |
Nms |
R-18 mos |
Colorado |
Y-0.10 |
0.10 |
Y-0.02 (<21) |
Nms |
R-1 yr |
R-1 yr |
Connecticut |
Y-0.10 |
0.10 |
Y-0.02 (<21) |
Nms |
Nms |
Nms |
Delaware |
Y-0.10 |
0.10 |
Y-0.02 (<21) |
Nms |
R-6 mos |
R-6 mos |
District of Columbia |
Y-0.05 |
0.08 |
Y-0.00 (<21) |
R-6 mos |
R-1 yr |
R-2 yrs |
Florida |
Y-0.08 |
0.08 |
Y-0.02 (<21) |
Nms |
R-12 mos |
R-24 mos |
Georgia |
Y-0.10 |
0.10 |
Y-0.02 (<21) |
Nms |
S-120 days |
R-5 yrs |
Hawaii |
Y-0.08 |
0.08 |
Y-0.02 (<21) |
S-30 days |
S-1 yr |
R-1 yr |
Idaho |
Y-0.08 |
0.08 |
Y-0.02 (<21) |
S-30 days |
S-1 yr |
S-1 yr |
Illinois |
Y-0.08 |
0.08 |
Y-0.02 (<21) |
Nms |
Nms |
Nms |
Indiana |
Y-0.10 |
0.10 |
Y-0.02 (<21) |
S-30 days |
S-1 yr |
S-1 yr |
Iowa |
Y-0.10 |
0.10 |
Y-0.02 (<21) |
R-30 days |
R-1 yr |
R-1 yr |
Kansas |
Y-0.08 |
0.08 |
Y-0.02 (<21) |
S-30 days |
S-1 yr |
S-1 yr |
Kentucky |
A |
0.08 |
Y-0.02 (<21) |
S-30 days |
R-12 mos |
R-24 mos |
Louisiana |
Y-0.10 |
0.10 |
Y-0.02 (<21) |
Nms |
Nms |
Nms |
Maine |
Y-0.08 |
0.08 |
Y-0.00 (<21) |
S-60 days |
S-18 mos |
S-4 yrs |
Maryland |
Y-0.10 |
0.10 |
Y-0.02 (<21) |
Nms |
Nms |
Nms |
Massachusetts |
Y-0.08 |
N |
Y-0.02 (<21) |
S-45 days |
R-6 mos |
R-2 yrs |
Michigan |
N |
0.10 |
Y-0.02 (<21) |
Nms |
R-1 yr |
S-5 yrs |
Minnesota |
Y-0.10 |
0.10 |
Y-0.00 (<21) |
R-15 days |
R-90 days |
R-90 days |
Mississippi |
Y-0.10 |
0.10 |
Y-0.02 (<21) |
S-30 days |
S-1 yr |
S-3 yrs |
Missouri |
Y-0.10 |
0.10 |
Y-0.02 (<21) |
S-30 days |
R-2 yrs |
R-3 yrs |
Montana |
N |
0.10 |
Y-0.02 (<21) |
Nms |
R-3 mos |
R-3 mos |
Nebraska |
Y-0.10 |
0.10 |
Y-0.02 (<21) |
R-60 days |
R-1 yr |
R-1 yr |
Nevada |
Y-0.10 |
0.10 |
Y-0.02 (<21) |
R-45 days |
R-1 yr |
R-1.5 yrs |
New Hampshire |
Y-0.08 |
0.08 |
Y-0.02 (<21) |
R-90 days |
R-3 yrs |
R-3 yrs |
New Jersey |
N |
0.10 |
Y-0.01 (<21) |
R-6 mos |
R-2 yrs |
R-10 yrs |
New Mexico |
Y-0.08 |
0.08 |
Y-0.02 (<21) |
Nms |
R-30 days |
R-30 days |
New York |
A |
0.10 |
Y-0.02 (<21) |
Nms |
R-I yr |
R-1 yr |
North Carolina |
Y-0.08 |
0.08 |
Y-0.00 (<21) |
Nms |
R-2 yrs |
R-3 yrs |
North Dakota |
Y-0.10 |
0.10 |
Y-0.02 (<21) |
S-30 days |
S-365 days |
S-2 yrs |
Ohio |
Y-0.10 |
0.10 |
Y-0.02 (<21) |
S-15 days |
S-30 days |
S-180 days |
Oklahoma |
Y-0.10 |
0.10 |
Y-0.00 (<21) |
Nms |
R-1 yr |
R-1 yr |
Oregon |
Y-0.08 |
0.08 |
Y-0.00 (<21) |
Nms |
S-90 days |
S-1 yr |
Pennsylvania |
N |
0.10 |
Y-0.02 (<21) |
S-1 mo |
S-12 mos |
S-12 mos |
Rhode Island |
N |
0.08 |
Y-0.02 (<21) |
S-3 mos |
S-1 yr |
S-2 yrs |
South Carolina |
Y-0.15 |
0.10 |
Y-0.02 (<21) |
Nms |
S-1 yr |
S-4 yrs |
South Dakota |
N |
0.10 |
Y-0.02 (<21) |
Nms |
R-1 yr |
R-1 yr |
Tennessee |
N |
0.10 |
Y-0.02 (<21) |
Nms |
R-2 yrs |
R-3 yrs |
Texas |
Y-0.08 |
0.08 |
Y-0.00 (<21) |
Nms |
Nms |
Nms |
Utah |
Y-0.08 |
0.08 |
Y-0.00 (<21) |
S-90 days |
R-1 yrs |
R-1 yrs |
Vermont |
Y-0.08 |
0.08 |
Y-0.02 (<21) |
S-90 days |
S-18 mos |
R-2 yrs |
Virginia |
Y-0.08 |
0.08 |
Y-0.02 (<21) |
Nms |
R-1 yr |
R-3 yrs |
Washington |
Y-0.08 |
0.08 |
Y-0.02 (<21) |
S-30 days |
R-1 yr |
R-2 yrs |
West Virginia |
Y-0.10 |
0.10 |
Y-0.02 (<21) |
R-30 days |
R-1 yr |
R-1 yr |
Wisconsin |
Y-0.10 |
0.10 |
Y-0.02 (<21) |
Nms |
R-60 days |
R-90 days |
Wyoming |
Y-0.10 |
0.10 |
Y-0.02 (<21) |
Nms |
S-1 yr |
R-3 yrs |
KEY: BAC = blood alcohol content; DWI = driving while intoxicated; Y = yes; N = no; A = alternative; S = suspension; R = revocation; Nms = no mandatory sanction.
NOTES: An "administrative per se law" allows a state's driver licensing agency to either suspend or revoke a driver's license based on a specific alcohol (or drug) concentration or on some other criterion related to alcohol or drug use and driving. Such action is independent of any licensing action related to a DWI criminal offense. The term "illegal per se" refers to state laws that make it a criminal offense to operate a motor vehicle at or above a specified alcohol (or drug) concentration in the blood, breath, or urine. In those columns showing mandatory sanctions, "nms" does not mean that a state does not have a sanction. It only means that the state does not have a mandatory sanction for that offense or violation.
SOURCE: U.S. Department of Transportation, National Highway Traffic Safety Administration, Traffic Safety Facts 2000 , Washington, DC: 2001, available at http://www-nrd.nhtsa.dot.gov/pdf/nrd-30/NCSA/TSFAnn/TSF2000.pdf as of Jan. 4, 2002.
BTS State Transportation Profile |
B-7 |
Alaska |

Safety
Table 2-8: Maximum Posted Speed Limits by System: 2001 (Speed limit in miles per hour)1
|
Interstate |
|
Other limited- |
|
State |
Rural |
Urban |
access roads2 |
Other roads |
Alabama |
70 |
70 |
65 |
65 |
Alaska |
65 |
55 |
65 |
55 |
Arizona |
75 |
55 |
55 |
55 |
Arkansas |
70, Trucks: 65 |
55 |
60 |
55 |
California |
70, Trucks: 55 |
65 |
70 |
55 |
Colorado |
75 |
65 |
65 |
55 |
Connecticut |
65 |
55 |
65 |
55 |
Delaware |
65 |
55 |
65 |
55 |
District of Columbia |
NA |
55 |
NA |
25 |
Florida |
70 |
65 |
70 |
65 |
Georgia |
70 |
65 |
65 |
65 |
Hawaii |
55 |
50 |
45 |
45 |
Idaho |
75, Trucks: 65 |
65 |
65 |
65 |
Illinois |
65, Trucks: 55 |
55 |
65 |
55 |
Indiana |
65, Trucks: 60 |
55 |
55 |
55 |
Iowa |
65 |
55 |
65 |
55 |
Kansas |
70 |
70 |
70 |
65 |
Kentucky |
65 |
55 |
55 |
55 |
Louisiana |
70 |
55 |
70 |
65 |
Maine |
65 |
55 |
55 |
55 |
Maryland |
65 |
65 |
65 |
55 |
Massachusetts |
65 |
65 |
65 |
55 |
Michigan |
70, Trucks: 55 |
65 |
70 |
55 |
Minnesota |
70 |
65 |
65 |
55 |
Mississippi |
70 |
70 |
70 |
65 |
Missouri |
70 |
60 |
70 |
65 |
Montana |
75, Trucks: 65 |
65 |
Day: 70, Night: 65 |
Day: 70, Night: 65 |
Nebraska |
75 |
65 |
65 |
60 |
Nevada |
75 |
65 |
70 |
70 |
New Hampshire |
65 |
65 |
55 |
55 |
New Jersey |
65 |
55 |
65 |
55 |
New Mexico |
75 |
55 |
65 |
55 |
New York |
65 |
65 |
65 |
55 |
North Carolina |
70 |
65 |
65 |
55 |
North Dakota |
70 |
55 |
65 |
Day: 65, Night: 55 |
Ohio |
65, Trucks: 55 |
65 |
55 |
55 |
Oklahoma |
75 |
70 |
70 |
70 |
Oregon |
65, Trucks: 55 |
55 |
55 |
55 |
Pennsylvania |
65 |
55 |
65 |
55 |
Rhode Island |
65 |
55 |
55 |
55 |
South Carolina |
70 |
70 |
60 |
55 |
South Dakota |
75 |
65 |
65 |
65 |
Tennessee |
70 |
70 |
70 |
55 |
Texas |
70 |
70 |
70 |
70 |
Utah |
75 |
65 |
55 |
55 |
Vermont |
65 |
55 |
50 |
50 |
Virginia |
65 |
55 |
65 |
55 |
Washington |
70, Trucks: 60 |
60 |
55 |
55 |
West Virginia |
70 |
55 |
65 |
55 |
Wisconsin |
65 |
65 |
65 |
55 |
Wyoming |
75 |
60 |
65 |
65 |
1Many roads, particularly urban interstates, often have a lower posted speed limit than the maximum allowable shown in this table.
2Limited-access roads are multi-laned roads with restricted access using exit and entrance ramps rather than intersections.
KEY: NA = Not applicable.
NOTE: Interstates are divided into urban and rural sections based primarily on population size and population density.
SOURCE: Insurance Institute for Highway Safety, Highway Loss Data Institute, available at http://www.hwysafety.org/ safety_facts/state_laws/speed_limit_laws.htm as of Oct. 1, 2001.
Alaska |
B-8 |
BTS State Transportation Profile |
Safety
Table 2-9: Total Rail Accidents/Incidents: 2000
|
Accidents/ |
|
|
|
|
|
Accidents/ |
|
|
State |
Incidents |
Fatalities |
Injuries |
|
State |
Incidents |
Fatalities |
Injuries |
|
Alabama |
257 |
20 |
143 |
|
|
Montana |
156 |
4 |
108 |
Alaska |
89 |
2 |
82 |
|
|
Nevada |
40 |
1 |
25 |
Arizona |
222 |
27 |
147 |
|
|
New Hampshire |
18 |
0 |
15 |
Arkansas |
371 |
30 |
225 |
|
|
New Jersey |
528 |
28 |
432 |
California |
1,133 |
101 |
808 |
|
|
Nebraska |
362 |
8 |
247 |
Colorado |
199 |
10 |
112 |
|
|
New Mexico |
138 |
4 |
106 |
Connecticut |
203 |
6 |
159 |
|
|
New York |
1,330 |
32 |
1,168 |
Delaware |
59 |
2 |
47 |
|
|
North Carolina |
243 |
24 |
121 |
District of Columbia |
107 |
0 |
90 |
|
|
North Dakota |
122 |
9 |
82 |
Florida |
405 |
45 |
303 |
|
|
Ohio |
575 |
28 |
339 |
Georgia |
395 |
23 |
231 |
|
|
Oklahoma |
231 |
22 |
124 |
Hawaii |
0 |
0 |
0 |
|
|
Oregon |
214 |
9 |
152 |
Idaho |
109 |
11 |
53 |
|
|
Pennsylvania |
752 |
23 |
583 |
Illinois |
1,484 |
69 |
1,109 |
|
|
Rhode Island |
21 |
1 |
19 |
Indiana |
540 |
36 |
317 |
|
|
South Carolina |
192 |
20 |
141 |
Iowa |
367 |
9 |
211 |
|
|
South Dakota |
64 |
3 |
43 |
Kansas |
337 |
21 |
226 |
|
|
Tennessee |
296 |
15 |
163 |
Kentucky |
272 |
14 |
170 |
|
|
Texas |
1,260 |
90 |
777 |
Louisiana |
465 |
16 |
310 |
|
|
Utah |
129 |
5 |
88 |
Maine |
79 |
2 |
58 |
|
|
Vermont |
29 |
1 |
22 |
Maryland |
173 |
9 |
103 |
|
|
Virginia |
252 |
13 |
169 |
Massachusetts |
228 |
17 |
183 |
|
|
Washington |
317 |
16 |
230 |
Michigan |
434 |
23 |
300 |
|
|
West Virginia |
128 |
9 |
93 |
Minnesota |
431 |
11 |
303 |
|
|
Wisconsin |
390 |
20 |
258 |
Mississippi |
250 |
17 |
120 |
|
|
Wyoming |
156 |
2 |
107 |
Missouri |
367 |
29 |
221 |
|
|
United States |
16,919 |
937 |
11,643 |
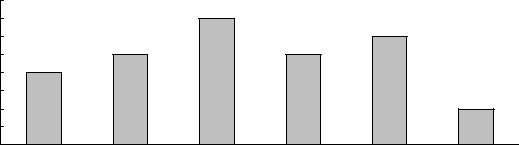
Figure 2-2: Alaska Train Accidents (Excludes highway-grade crossing incidents and other
incidents)
8 |
|
|
7 |
|
|
|
7 |
|
|
|
|
|
|
|
|
|
|
6 |
|
|
6 |
|
|
|
|
|
|
|
5 |
|
5 |
|
|
|
5 |
|
|
|
|
||
4 |
|
|
|
|
|
|
4 |
|
|
|
|
|
|
|
|
|
|
|
|
|
3 |
|
|
|
|
|
2 |
2 |
|
|
|
|
|
|
|
|
|
|
|
|
|
1 |
|
|
|
|
|
|
0 |
|
|
|
|
|
|
|
1995 |
1996 |
1997 |
1998 |
1999 |
2000 |
NOTE FOR DATA ON THIS PAGE: "Accidents/incidents" includes all events reportable to the U.S. Department of Transportation, Federal Railroad Administration under applicable regulations. These include: train accidents, reported on Form F 6180.54, comprised of collisions, derailments, and other events involving the operation of on-track equipment and causing reportable damage above an established threshold ($6,600 in 1998); highway-rail grade crossing incidents, reported on Form F 6180.57, involving impact between railroad on-track equipment and highway users at crossings; and other incidents, reported on Form F 6180.55a, involving all other reportable incidents or exposures that cause a fatality or injury to any person, or an occupational illness to a railroad employee.
SOURCE FOR DATA ON THIS PAGE: U.S. Department of Transportation, Federal Railroad Administration, Railroad Safety Statistics Annual Report 2000, Washington, DC: 2001, table 2-11, available at http://safetydata.fra.dot.gov/officeofsafety/ as of Oct. 22, 2001.
BTS State Transportation Profile |
B-9 |
Alaska |

Safety
Table 2-10: Highway-Rail Grade Crossing Incidents: 2000
|
Number of |
|
|
|
|
State |
grade |
Incidents |
Fatalities |
Injuries |
|
Alabama |
5,418 |
95 |
10 |
39 |
|
Alaska |
336 |
7 |
0 |
0 |
|
Arizona |
1,628 |
29 |
8 |
13 |
|
Arkansas |
4,655 |
115 |
27 |
36 |
|
California |
12,775 |
174 |
27 |
54 |
|
Colorado |
3,271 |
36 |
6 |
8 |
|
Connecticut |
624 |
8 |
2 |
0 |
|
Delaware |
456 |
10 |
0 |
7 |
|
District of Columbia |
42 |
2 |
0 |
0 |
|
Florida |
5,324 |
86 |
15 |
67 |
|
Georgia |
8,453 |
128 |
10 |
38 |
|
Hawaii |
8 |
0 |
0 |
0 |
|
Idaho |
2,645 |
33 |
11 |
1 |
|
Illinois |
13,916 |
217 |
31 |
68 |
|
Indiana |
9,129 |
194 |
23 |
55 |
|
Iowa |
9,317 |
109 |
6 |
31 |
|
Kansas |
10,756 |
67 |
11 |
18 |
|
Kentucky |
5,037 |
69 |
5 |
20 |
|
Louisiana |
6,726 |
181 |
14 |
88 |
|
Maine |
1,680 |
8 |
1 |
1 |
|
Maryland |
1,390 |
19 |
1 |
2 |
|
Massachusetts |
1,679 |
12 |
1 |
4 |
|
Michigan |
8,028 |
134 |
13 |
51 |
|
Minnesota |
8,219 |
91 |
6 |
40 |
|
Mississippi |
4,850 |
113 |
15 |
44 |
|
Missouri |
8,001 |
88 |
17 |
27 |
|
|
Number of |
|
|
|
State |
grade |
Incidents |
Fatalities |
Injuries |
Montana |
3,514 |
24 |
1 |
2 |
Nebraska |
6,575 |
55 |
7 |
14 |
Nevada |
571 |
2 |
0 |
0 |
New Hampshire |
637 |
3 |
0 |
0 |
New Jersey |
2,493 |
36 |
5 |
10 |
New Mexico |
1,355 |
17 |
0 |
11 |
New York |
6,216 |
41 |
5 |
14 |
North Carolina |
7,813 |
113 |
14 |
25 |
North Dakota |
6,343 |
17 |
6 |
2 |
Ohio |
9,633 |
148 |
15 |
38 |
Oklahoma |
5,913 |
89 |
12 |
47 |
Oregon |
5,213 |
30 |
0 |
13 |
Pennsylvania |
8,946 |
69 |
8 |
17 |
Rhode Island |
189 |
0 |
0 |
0 |
South Carolina |
4,270 |
80 |
10 |
24 |
South Dakota |
3,495 |
11 |
0 |
5 |
Tennessee |
5,062 |
90 |
8 |
26 |
Texas |
18,289 |
388 |
52 |
164 |
Utah |
1,755 |
18 |
2 |
7 |
Vermont |
1,192 |
2 |
0 |
0 |
Virginia |
4,829 |
54 |
3 |
21 |
Washington |
5,749 |
45 |
1 |
10 |
West Virginia |
3,632 |
20 |
1 |
8 |
Wisconsin |
7,043 |
122 |
15 |
49 |
Wyoming |
1,151 |
3 |
0 |
0 |
United States |
256,241 |
3,502 |
425 |
1,219 |
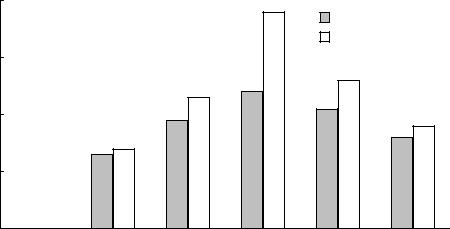
Figure 2-3: Alaska Highway-Rail Grade Crossing
Fatalities and Injuries
10 |
|
|
|
|
|
|
|
|
|
|
|
|
|
|
|
|
|
|
|
|
|
|
|
|
|
|
|
|
|
|
|
|
|
8 |
|
|
|
|
|
Fatalities |
|
|
Injuries |
|
|
|
|
|
|
|
|
|
|
|
|
|
|
|
|
|
|
|
|||||
|
|
|
|
|
|
|
|
|
|
|
|
|||||
|
|
|
|
|
|
|
|
|
|
|
|
|
|
|
|
|
|
|
|
|
|
|
|
|
|
|
|
|
|
|
|
|
|
6 |
|
|
|
|
|
|
|
|
|
|
|
|
|
|
|
|
|
5 |
|
|
|
|
|
|
|
|
|
|
|
|
|
|
|
4 |
|
|
|
|
|
|
|
|
|
|
|
|
|
|
|
|
|
|
|
|
|
|
|
|
|
|
|
|
|
|
|
|
|
2 |
|
|
|
|
|
|
|
|
|
|
2 |
|
|
|
|
|
|
|
|
|
|
|
1 |
|
|
|
|
1 |
|
|
|||
|
|
|
|
|
|
|
|
|
|
|
|
|
||||
0 |
0 |
|
0 |
0 |
|
|
|
0 |
0 |
|
0 |
|
0 |
0 |
||
|
|
|
|
|
|
|||||||||||
|
|
|
|
|
|
|
|
|
|
|
|
|
|
|
|
|
1995 |
1996 |
1997 |
1998 |
1999 |
2000 |
|||||||||||
NOTE FOR DATA ON THIS PAGE: Any impact, regardless of severity, between railroad on-track equipment and any user of a public or private crossing site must be reported to the U.S. Department of Transportation, Federal Railroad Administration on Form F 6180.57. The crossing site includes sidewalks and pathways at, or associated with, the crossing. Counts of fatalities and injuries include motor vehicles occupants, people not in vehicles or on the trains, as well as people on the train or railroad equipment.
SOURCE FOR DATA ON THIS PAGE: U.S. Department of Transportation, Federal Railroad Administration, Railroad Safety Statistics Annual Report 2000, Washington, DC: 2001, available at http://safetydata.fra.dot.gov/officeofsafety/ as of Oct. 22, 2001.
Alaska |
B-10 |
BTS State Transportation Profile |
Safety
Table 2-11: Highway-Rail Grade Crossings by Type: 2000
|
|
Alaska |
|
United States |
|
|
Number |
Percent |
|
Number |
Percent |
Total |
336 |
100.0 |
|
256,241 |
100.0 |
Public, motor vehicle |
224 |
66.7 |
155,370 |
60.6 |
|
Private, motor vehicle |
104 |
31.0 |
98,918 |
38.6 |
|
Pedestrian |
8 |
2.4 |
1,953 |
0.8 |
|
SOURCE: U.S. Department of Transportation, Federal Railway Administration, Office of Railway Safety, Railroad Safety Statistics Annual Report 2000, table 9-2, available at http://safetydata.fra.dot.gov/officeofsafety as of Nov. 21, 2001.
Table 2-12: Warning Devices at Public Highway-Rail Grade Crossings: 2000
|
|
Alaska |
|
United States |
|
|
Number |
Percent |
|
Number |
Percent |
Total |
224 |
100.0 |
|
155,370 |
100.0 |
Cross bucks |
98 |
43.8 |
71,468 |
46.0 |
|
Gates |
51 |
22.8 |
34,296 |
22.1 |
|
Flashing lights |
30 |
13.4 |
27,100 |
17.4 |
|
Stop signs |
29 |
12.9 |
11,630 |
7.5 |
|
Unknown |
9 |
4.0 |
5,253 |
3.4 |
|
Special warning |
7 |
3.1 |
3,723 |
2.4 |
|
HWTS, WW, bells |
0 |
0.0 |
1,417 |
0.9 |
|
Other |
0 |
0.0 |
483 |
0.3 |
|
KEY: HWTS = highway traffic signals, WW = wigwags.
SOURCE: U.S. Department of Transportation, Federal Railway Administration, Office of Railway Safety, Railroad Safety Statistics Annual Report 2000 , Washington, DC: 2001, table 9-4, available at http://safetydata.fra.dot.gov/officeofsafety as of Nov. 21, 2001.
BTS State Transportation Profile |
B-11 |
Alaska |

Safety
Table 2-13: Types of People Injured in Alaska
Train Accidents/Incidents: 2000 (Includes highway-rail crossing)
Type of person |
Fatalities |
Injuries |
Worker on duty (railroad employee) |
2 |
66 |
Employee not on duty |
0 |
0 |
Passenger on train |
0 |
7 |
Nontrespasser |
0 |
0 |
Trespasser |
0 |
0 |
Worker on duty (contractor) |
0 |
9 |
Contractor (other) |
0 |
0 |
Worker on duty (volunteer) |
0 |
0 |
Volunteer (other) |
0 |
0 |
Nontrespasser (off railroad property) |
0 |
0 |
Figure 2-4: Railroad Trespasser Deaths and Injuries in
Alaska (Excludes highway-rail crossing)
3 |
|
|
|
|
|
|
Deaths |
|
Injuries |
|
|
|
|
|
|
|
|
|
|
||
2 |
|
2 |
|
|
|
|
|
|
|
|
|
|
|
|
|
|
|
|
|
|
|
1 |
1 |
1 |
|
|
1 |
1 |
|
|
|
|
1 |
|
|
|
|
|
|
|
|
|
|
0 |
|
|
0 |
0 |
|
|
0 |
0 |
0 |
0 |
|
|
|
|
|
|
|
|
|
|
|
1995 |
1996 |
1997 |
1998 |
1999 |
2000 |
|||||
NOTE FOR DATA ON THIS PAGE: As defined by the U.S. Department of Transportation, Federal Railroad Administration, a trespasser is any person on a part of railroad property used in railroad operations whose presence is prohibited, forbidden, or unlawful. Employees who are trespassing on railroad property are reported as trespassers.
SOURCE FOR DATA ON THIS PAGE: U.S. Department of Transportation, Federal Railroad Administration, Railroad Safety Statistics Annual Report 2000, Washington, DC: 2001, available at http://safetydata.fra. dot.gov/officeofsafety/ as of Oct. 22, 2001.
Alaska |
B-12 |
BTS State Transportation Profile |

Safety
Table 2-14: Alaska Transit Safety Data: 2000
|
|
Collision |
|
|
Non-collision |
|
|
Total property |
|
|
Number of |
|
|
|
Number of |
|
|
|
damage |
|
incidents |
Fatalities |
Injuries |
|
incidents |
Fatalities |
Injuries |
|
($ thousands ) |
Cable car |
0 |
0 |
0 |
|
0 |
0 |
0 |
|
0 |
Commuter rail |
0 |
0 |
0 |
0 |
0 |
0 |
0 |
||
Demand responsive |
6 |
0 |
1 |
1 |
0 |
1 |
30 |
||
Ferry boat |
0 |
0 |
0 |
0 |
0 |
0 |
0 |
||
Heavy rail |
0 |
0 |
0 |
0 |
0 |
0 |
0 |
||
Light rail |
0 |
0 |
0 |
0 |
0 |
0 |
0 |
||
Motor bus |
6 |
0 |
3 |
14 |
0 |
14 |
102 |
||
Trolley bus |
0 |
0 |
0 |
0 |
0 |
0 |
0 |
||
Van pool |
2 |
0 |
2 |
0 |
0 |
0 |
33 |
||
Table 2-15: U.S. Transit Safety Data: 2000
|
|
Collision |
|
|
Non-collision |
|
|
Total property |
|
|
Number of |
|
|
|
Number of |
|
|
|
damage |
|
incidents |
Fatalities |
Injuries |
|
incidents |
Fatalities |
Injuries |
|
($ thousands) |
Cable car |
10 |
0 |
15 |
|
10 |
0 |
11 |
|
10 |
Commuter rail |
267 |
104 |
95 |
1,981 |
2 |
1,865 |
8,047 |
||
Demand responsive |
3,055 |
6 |
1,603 |
1,510 |
11 |
1,494 |
6,910 |
||
Ferry boat |
7 |
0 |
6 |
719 |
0 |
730 |
106 |
||
Heavy rail |
389 |
55 |
316 |
12,388 |
22 |
10,530 |
5,034 |
||
Light rail |
343 |
30 |
361 |
979 |
0 |
978 |
3,062 |
||
Motor bus |
23,184 |
93 |
20,800 |
19,847 |
8 |
20,967 |
43,717 |
||
Trolley bus |
122 |
0 |
103 |
257 |
0 |
265 |
103 |
||
Van pool |
186 |
1 |
65 |
5 |
0 |
5 |
563 |
||
NOTES FOR DATA ON THIS PAGE: Collision includes at-grade crossings and suicides. Non-collision includes: 1) derailments/buses going off road; 2) personal casualties in parking facilities, inside vehicles, on right of way, boarding/alighting, and in station/bus stops; and 3) non-arson fires.
SOURCE FOR DATA ON THIS PAGE: U.S. Department of Transportation, Federal Transit Administration, 2000 National Transit Database, available at www.ntdprogram.com as of Dec. 5, 2001.
BTS State Transportation Profile |
B-13 |
Alaska |
Safety
Table 2-16: Recreational Boating Accidents: 2000
|
Alaska |
United States |
Number of accidents |
|
|
Total |
68 |
7,740 |
Fatal |
16 |
616 |
Non-fatal injury |
13 |
3,292 |
Property damage |
39 |
3,832 |
Number of persons |
|
|
Killed |
18 |
701 |
Injured |
18 |
4,355 |
NOTE: Guam, Puerto Rico, and the Virgin Islands are included in the
U.S. total.
Figure 2-5: Alaska Recreational Boating Accidents
40 |
|
|
|
|
38 |
|
|
|
|
|
|
|
|
Fatal accidents |
|
|
|
|
|
|
|
Fatalities |
|
30 |
|
|
|
|
|
26 |
|
|
|
|
|
|
24 |
|
|
|
|
|
|
23 |
|
|
|
|
|
|
|
|
21 |
|
|
|
|
|
|
19 |
|
|
|
20 |
|
|
|
|
|
18 |
|
|
|
|
|
|
|
||
|
|
|
14 |
|
|
|
16 |
|
|
13 |
|
|
|
|
|
10 |
|
|
|
|
|
|
|
0 |
0 |
|
|
|
|
|
|
0 |
|
|
|
|
|
|
|
1995 |
1996 |
1997 |
1998 |
1999 |
2000 |
||
NOTES FOR DATA ON THIS PAGE: An accident is listed under one category only, with fatal being the highest priority, followed by non-fatal injury, followed by property damage. For example, if two vessels are in an accident resulting in a fatality and a non-fatal injury, the accident is counted as a fatal accident involving two vessels.
These data do not include: 1) accidents involving only slight injury not requiring medical treatment beyond first-aid; 2) accidents involving property damage of $500 or less; 3) accidents not caused or contributed to by a vessel, its
equipment, or its appendages; and 4) accidents in which the boat was used solely as a platform for other activities, such as swimming or skin diving. Such cases are not included because the victims freely left the safety of a boat. However, the data do include accidents involving people in the water who are struck by their boat or another boat.
SOURCE FOR DATA ON THIS PAGE: U.S. Department of Transportation, U.S. Coast Guard, Boating Statistics, 2000, Washington, DC: 2001, available at www.uscgboating.org/Saf/pdf/Boating_Statistics_2000.pdf as of Nov. 14, 2001.
Alaska |
B-14 |
BTS State Transportation Profile |