

СТАТИСТИКА 1 / Министерство транспорта США / Alaska Transportation Statistics 2008
.pdfA Infrastructure

|
|
|
|
|
|
Infrastructure |
|
Table 1-1: Alaska Public Road Length, Miles by Functional System |
|
|
|
||||
|
|
|
|
|
|
|
|
|
1995 |
1996 |
1997 |
1998 |
1999 |
2000 |
|
Total rural and urban |
13,486 |
13,255 |
12,775 |
12,680 |
12,667 |
12,823 |
|
Rural |
11,705 |
11,460 |
10,983 |
10,870 |
10,858 |
11,014 |
|
Interstate |
1,032 |
1,033 |
1,034 |
1,030 |
1,030 |
1,030 |
|
Other principal arterial |
810 |
810 |
810 |
809 |
809 |
809 |
|
Minor arterial |
442 |
442 |
442 |
437 |
437 |
436 |
|
Major arterial |
1,271 |
1,382 |
1,425 |
1,422 |
1,417 |
1,418 |
|
Minor collector |
958 |
1,142 |
1,097 |
1,093 |
1,090 |
1,090 |
|
Local |
7,192 |
6,651 |
6,175 |
6,079 |
6,075 |
6,231 |
|
Urban |
1,781 |
1,795 |
1,792 |
1,810 |
1,809 |
1,809 |
|
Interstate |
54 |
53 |
53 |
53 |
53 |
53 |
|
Other freeways and expressways |
0 |
0 |
0 |
0 |
0 |
0 |
|
Other principal arterial |
56 |
56 |
57 |
57 |
57 |
57 |
|
Minor arterial |
203 |
204 |
203 |
202 |
202 |
202 |
|
Collector |
215 |
229 |
229 |
229 |
229 |
228 |
|
Local |
1,253 |
1,253 |
1,250 |
1,269 |
1,268 |
1,269 |
|
SOURCE: U.S. Department of Transportation, Federal Highway Administration, Highway Statistics, Washington, DC: annual editions, table HM-20, available at http://www.fhwa.dot.gov/ohim/hs00/hm20.htm as of Feb. 1, 2002.
Table 1-2: Alaska Public Road Length, Miles by Ownership: 2000
|
National |
Other |
|
|
|
Highway |
federal-aid Nonfederal- |
|
|
|
System |
highway |
aid highway |
Total |
Total |
2,110 |
2,122 |
8,590 |
12,822 |
State highway agency |
2,109 |
1,896 |
1,504 |
5,509 |
County |
1 |
92 |
3,428 |
3,521 |
Town, township, municipal |
NA |
36 |
1,676 |
1,712 |
Other jurisdiction1 |
NA |
83 |
473 |
556 |
Federal agency2 |
NA |
15 |
1,509 |
1,524 |
1Includes state park, state toll, other state agency, other local agency, and roadways not identified by ownership.
2Roadways in federal parks, forests, and reservations that are not part of the state and local highway systems.
KEY: NA = not applicable.
SOURCE: U.S. Department of Transportation, Federal Highway Administration, Highway
Statistics, Washington, DC: annual editions, table HM-14, available at
http://www.fhwa.dot.gov/ohim/hs00/hm14.htm as of Feb. 1, 2002.
BTS State Transportation Profile |
A-1 |
Alaska |

Infrastructure
Table 1-3: Alaska Toll Ferries: 2001
|
|
|
|
Toll |
Electronic |
|
Financing or operating |
|
Length |
collection |
collection |
Vehicular toll ferries |
authority |
Location |
in miles |
direction |
system |
Motor Vessel le Conte |
Alaska DOTPF |
From Petersburg to Skagway, AK |
Motor Vessel Tustumena |
Alaska DOTPF |
From Valdez to Dutch Harbor, AK |
Motor Vessel Bartlett |
Alaska DOTPF |
From Cordova to Whittier, AK |
Motor Vessel Bob Ellis |
Ketchikan Gateway |
From Ketchikan to Ketchikan International |
|
Borough |
Airport, AK |
Motor Vessel Ken Eichner |
Ketchikan Gateway |
From Ketchikan to Ketchikan International |
|
Borough |
Airport, AK |
Motor Vessel Malaspina |
Alaska DOTPF |
From Juneau to Skagway, AK |
Motor Vessel Taku |
Alaska DOTPF |
From Prince Rupert, BC to Skagway, AK |
Motor Vessel Aurora |
Alaska DOTPF |
From Prince Rupert, BC to Juneau, AK |
Motor Vessel Matanoska |
Alaska DOTPF |
From Prince Rupert, BC to Skagway, AK |
Motor Vessel Kennicott |
Alaska DOTPF |
From Bellingham, WA to Skagway, AK |
Motor Vessel Columbia |
Alaska DOTPF |
From Bellingham, WA to Skagway, AK |
U |
Both ways |
No |
U |
Both ways |
No |
U |
Both ways |
No |
U |
Both ways |
No |
U |
Both ways |
No |
U |
Both ways |
No |
U |
Both ways |
No |
U |
Both ways |
No |
U |
Both ways |
No |
U |
Both ways |
No |
U |
Both ways |
No |
KEY: DOTPF = Department of Transportation and Public Facilities; U = data are unavailable.
SOURCE: U.S. Department of Transportation, Federal Highway Administration, Toll Facilities in the United States: Bridges-Roads-Tunnels-Ferries, Washington, DC: June 2001, available at http://www.fhwa.dot.gov/ohim/tollpage.htm as of Feb. 18, 2002.
Alaska |
A-2 |
BTS State Transportation Profile |
Infrastructure
Table 1-4: Alaska Road Condition by Functional System -- Rural (Miles)
|
1995 |
1996 |
1997 |
1998 |
1999 |
2000 |
Interstate (total reported) |
1,032 |
1,033 |
1,034 |
1,030 |
1,030 |
1,030 |
Very good |
1 |
1 |
1 |
12 |
23 |
13 |
Good |
255 |
310 |
174 |
238 |
318 |
333 |
Fair |
297 |
292 |
336 |
337 |
346 |
313 |
Mediocre |
386 |
330 |
424 |
356 |
297 |
370 |
Poor |
93 |
100 |
99 |
87 |
46 |
1 |
Not reported |
0 |
0 |
0 |
0 |
0 |
0 |
Other principal arterial (total reported) |
354 |
355 |
356 |
354 |
354 |
353 |
Very good |
0 |
0 |
0 |
6 |
7 |
7 |
Good |
65 |
66 |
72 |
90 |
109 |
113 |
Fair |
85 |
134 |
87 |
68 |
39 |
66 |
Mediocre |
181 |
137 |
170 |
150 |
181 |
108 |
Poor |
23 |
18 |
27 |
40 |
18 |
59 |
Not reported |
456 |
455 |
454 |
455 |
455 |
455 |
Minor arterial (total reported) |
160 |
161 |
228 |
225 |
225 |
223 |
Very good |
0 |
0 |
0 |
0 |
0 |
0 |
Good |
38 |
44 |
129 |
61 |
52 |
46 |
Fair |
1 |
14 |
43 |
0 |
17 |
121 |
Mediocre |
84 |
57 |
19 |
127 |
119 |
46 |
Poor |
37 |
46 |
37 |
37 |
37 |
10 |
Not reported |
282 |
281 |
214 |
212 |
0 |
0 |
Major collector (total reported) |
N |
N |
N |
N |
N |
845 |
Very good |
N |
N |
N |
N |
N |
42 |
Good |
N |
N |
N |
N |
N |
60 |
Fair |
N |
N |
N |
N |
N |
532 |
Mediocre |
N |
N |
N |
N |
N |
130 |
Poor |
N |
N |
N |
N |
N |
81 |
Not reported |
N |
N |
N |
N |
N |
0 |
KEY: N = Data do not exist.
NOTE: In 2000, the Federal Highway Administration began reporting road condition for rural major collectors using the International Roughness Index. In prior years, data were only available using the Present Servicability Rating.
|
|
|
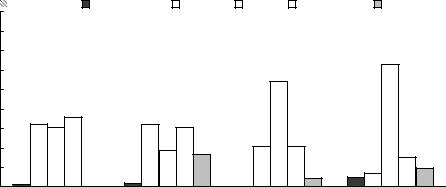
Figure 1-1: Rural Road Conditions in Alaska: 2000 |
|
|
|||||||
90 |
Percent |
|
|
Very good |
|
Good |
Fair |
|
Mediocre |
|
Poor |
|
|
|
|
|
|
|
|
|
|
|
|
|
|
80 |
|
|
|
|
|
|
|
|
|
|
|
|
70 |
|
|
|
|
|
|
|
|
|
|
|
63 |
|
|
|
|
|
|
|
|
|
|
|
|
|
60 |
|
|
|
|
|
|
54 |
|
|
|
|
|
50 |
|
|
|
|
|
|
|
|
|
|
|
|
40 |
32 |
30 |
36 |
32 |
|
31 |
|
|
|
|
|
|
30 |
|
|
|
|
|
|
|
|
||||
|
|
|
|
|
|
21 |
21 |
|
|
|
|
|
|
|
|
|
|
19 |
17 |
|
|
|
15 |
||
20 |
|
|
|
|
|
|
|
|
|
|||
|
|
|
|
|
|
|
|
|
|
|||
10 |
|
|
|
|
|
|
|
|
4 |
5 |
7 |
10 |
|
|
|
2 |
|
|
|
|
|
||||
1 |
|
0 |
|
|
0 |
|
|
|
||||
0 |
|
|
|
|
|
|
|
|
||||
|
|
|
|
|
|
|
|
|
|
|
|
|
|
Interstate |
Other principal arterial |
Minor arterial |
|
Major collector |
|||||||
NOTE FOR DATA ON THIS PAGE: Road condition is based on measured pavement roughness using the International Roughness Index (IRI). IRI is a measure of surface condition. A comprehensive measure of pavement condition would require data on other pavement distresses such as rutting, cracking, and faulting.
SOURCE FOR DATA ON THIS PAGE: U.S. Department of Transportation, Federal Highway Administration, Highway Statistics, Washington, DC: annual editions, tables HM-63 and HM-64, available at http://www.fhwa.dot.gov/ as of Feb. 1, 2002.
BTS State Transportation Profile |
A-3 |
Alaska |
Infrastructure
Table 1-5: Alaska Road Condition by Functional System -- Urban (Miles)
|
1995 |
1996 |
1997 |
1998 |
1999 |
2000 |
Interstate (total reported) |
53 |
53 |
53 |
53 |
54 |
53 |
Very good |
0 |
0 |
0 |
0 |
1 |
4 |
Good |
24 |
21 |
14 |
22 |
31 |
34 |
Fair |
25 |
22 |
39 |
24 |
12 |
9 |
Mediocre |
4 |
8 |
0 |
7 |
9 |
6 |
Poor |
0 |
2 |
0 |
0 |
1 |
0 |
Not reported |
0 |
0 |
0 |
0 |
0 |
0 |
Other freeways and expressways (total reported) |
0 |
0 |
0 |
0 |
0 |
0 |
Very good |
0 |
0 |
0 |
0 |
0 |
0 |
Good |
0 |
0 |
0 |
0 |
0 |
0 |
Fair |
0 |
0 |
0 |
0 |
0 |
0 |
Mediocre |
0 |
0 |
0 |
0 |
0 |
0 |
Poor |
0 |
0 |
0 |
0 |
0 |
0 |
Not reported |
0 |
0 |
0 |
0 |
0 |
0 |
Other principal arterial (total reported) |
56 |
56 |
56 |
55 |
55 |
56 |
Very good |
1 |
0 |
0 |
0 |
0 |
7 |
Good |
7 |
13 |
9 |
9 |
7 |
15 |
Fair |
38 |
37 |
45 |
42 |
40 |
30 |
Mediocre |
7 |
5 |
1 |
4 |
6 |
2 |
Poor |
3 |
1 |
1 |
0 |
2 |
2 |
Not reported |
0 |
0 |
0 |
0 |
0 |
0 |
Urban minor arterial (total reported) |
N |
N |
N |
N |
N |
202 |
Very good |
N |
N |
N |
N |
N |
0 |
Good |
N |
N |
N |
N |
N |
24 |
Fair |
N |
N |
N |
N |
N |
141 |
Mediocre |
N |
N |
N |
N |
N |
25 |
Poor |
N |
N |
N |
N |
N |
12 |
Not reported |
N |
N |
N |
N |
N |
0 |
Urban collector (total reported) |
N |
N |
N |
N |
N |
218 |
Very good |
N |
N |
N |
N |
N |
4 |
Good |
N |
N |
N |
N |
N |
16 |
Fair |
N |
N |
N |
N |
N |
88 |
Mediocre |
N |
N |
N |
N |
N |
49 |
Poor |
N |
N |
N |
N |
N |
61 |
Not reported |
N |
N |
N |
N |
N |
0 |
KEY: N = data do not exist.
NOTE: In 2000, the Federal Highway Administration began reporting road condition for urban minor arterials and urban collectors using the International Roughness Index. In prior years, data were only available using the Present Servicability Rating.
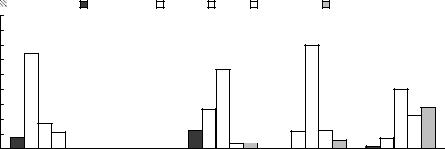
Figure 1-2: Urban Road Conditions in Alaska: 2000
90 |
Percent |
|
Very good |
|
Good |
Fair |
|
Mediocre |
Poor |
|
|||
|
|
|
|
|
|
|
|
|
|
|
|
|
|
80 |
|
|
|
|
|
|
|
|
|
|
70 |
|
|
70 |
64 |
|
|
|
|
|
|
|
|
|
|
|
|
|
|
|
|
|
|
|
|
|
|
|
|
||
60 |
|
|
|
|
|
|
|
|
54 |
|
|
|
|
50 |
|
|
|
|
|
|
|
|
|
|
|
|
40 |
40 |
|
|
|
|
|
|
|
|
|
|
|
|
|
|
|
|
|
|
|
|
|
27 |
|
|
|
28 |
|
30 |
|
|
|
|
|
|
|
|
|
|
|
||
17 |
|
|
|
|
|
|
|
|
|
|
|
22 |
|
20 |
11 |
|
|
|
|
|
13 |
|
|
12 |
12 |
7 |
|
10 |
8 |
|
|
|
|
|
|
|
4 |
4 |
|
6 |
|
|
0 |
0 |
0 |
0 |
0 |
0 |
|
0 |
|
2 |
|||
0 |
|
|
|
|
|
|
|||||||
|
|
|
|
|
|
|
|
|
|
|
|
|
|
|
Interstate |
Other freeways and |
Other principal |
Urban minor arterial |
Urban collector |
||||||||
|
|
|
|
expressways |
|
|
arterial |
|
|
|
|
||
NOTE FOR DATA ON THIS PAGE: Road condition is based on measured pavement roughness using the International Roughness Index (IRI). IRI is a measure of surface condition. A comprehensive measure of pavement condition would require data on other pavement distresses such as rutting, cracking, and faulting.
SOURCE FOR DATA ON THIS PAGE: U.S. Department of Transportation, Federal Highway Administration, Highway Statistics, Washington, DC: annual editions, tables HM-63 and HM-64, available at http://www.fhwa.dot.gov/ as of Feb. 1, 2002.
Alaska |
A-4 |
BTS State Transportation Profile |
Infrastructure
Table 1-6: Highway Bridge Condition: 2001
|
|
Structurally |
Functionally |
|
|
State |
All bridges |
deficient |
obsolete |
Total of both |
|
(number) |
(number) |
(number) |
(number) |
(percent) |
|
Alabama |
15,641 |
2,677 |
2,245 |
4,922 |
31.5 |
Alaska |
1,433 |
169 |
243 |
412 |
28.8 |
Arizona |
6,918 |
194 |
541 |
735 |
10.6 |
Arkansas |
12,434 |
1,479 |
1,996 |
3,475 |
27.9 |
California |
23,770 |
2,636 |
4,204 |
6,840 |
28.8 |
Colorado |
8,082 |
596 |
847 |
1,443 |
17.9 |
Connecticut |
4,171 |
362 |
943 |
1,305 |
31.3 |
Delaware |
829 |
47 |
82 |
129 |
15.6 |
District of Columbia |
243 |
25 |
136 |
161 |
66.3 |
Florida |
11,303 |
300 |
1,814 |
2,114 |
18.7 |
Georgia |
14,394 |
1,578 |
1,924 |
3,502 |
24.3 |
Hawaii |
1,071 |
193 |
344 |
537 |
50.1 |
Idaho |
4,069 |
320 |
436 |
756 |
18.6 |
Illinois |
25,529 |
2,725 |
2,099 |
4,824 |
18.9 |
Indiana |
18,067 |
2,257 |
2,161 |
4,418 |
24.5 |
Iowa |
25,030 |
5,036 |
2,060 |
7,096 |
28.3 |
Kansas |
25,638 |
3,465 |
2,959 |
6,424 |
25.1 |
Kentucky |
13,442 |
1,189 |
2,864 |
4,053 |
30.2 |
Louisiana |
13,426 |
2,425 |
2,166 |
4,591 |
34.2 |
Maine |
2,367 |
354 |
512 |
866 |
36.6 |
Maryland |
4,957 |
436 |
1,010 |
1,446 |
29.2 |
Massachusetts |
4,986 |
696 |
1,792 |
2,488 |
49.9 |
Michigan |
10,631 |
2,012 |
1,354 |
3,366 |
31.7 |
Minnesota |
12,830 |
1,221 |
563 |
1,784 |
13.9 |
Mississippi |
16,825 |
3,694 |
1,308 |
5,002 |
29.7 |
Missouri |
23,604 |
6,083 |
2,747 |
8,830 |
37.4 |
Montana |
5,009 |
570 |
560 |
1,130 |
22.6 |
Nebraska |
15,493 |
2,676 |
1,661 |
4,337 |
28.0 |
Nevada |
1,510 |
67 |
154 |
221 |
14.6 |
New Hampshire |
2,354 |
387 |
415 |
802 |
34.1 |
New Jersey |
6,366 |
930 |
1,420 |
2,350 |
36.9 |
New Mexico |
3,790 |
348 |
355 |
703 |
18.5 |
New York |
17,378 |
2,406 |
4,182 |
6,588 |
37.9 |
North Carolina |
16,991 |
2,513 |
2,794 |
5,307 |
31.2 |
North Dakota |
4,517 |
871 |
266 |
1,137 |
25.2 |
Ohio |
27,952 |
3,304 |
3,862 |
7,166 |
25.6 |
Oklahoma |
22,708 |
7,605 |
1,518 |
9,123 |
40.2 |
Oregon |
7,309 |
362 |
1,291 |
1,653 |
22.6 |
Pennsylvania |
22,092 |
5,418 |
4,022 |
9,440 |
42.7 |
Rhode Island |
749 |
187 |
192 |
379 |
50.6 |
South Carolina |
9,064 |
1,187 |
869 |
2,056 |
22.7 |
South Dakota |
6,001 |
1,398 |
346 |
1,744 |
29.1 |
Tennessee |
19,362 |
1,761 |
2,940 |
4,701 |
24.3 |
Texas |
48,085 |
3,182 |
7,373 |
10,555 |
22.0 |
Utah |
2,743 |
389 |
245 |
634 |
23.1 |
Vermont |
2,714 |
452 |
503 |
955 |
35.2 |
Virginia |
12,789 |
1,222 |
2,243 |
3,465 |
27.1 |
Washington |
7,939 |
551 |
1,591 |
2,142 |
27.0 |
West Virginia |
6,767 |
1,172 |
1,495 |
2,667 |
39.4 |
Wisconsin |
13,516 |
1,862 |
795 |
2,657 |
19.7 |
Wyoming |
3,076 |
389 |
253 |
642 |
20.9 |
United States |
590,066 |
83,630 |
81,469 |
165,099 |
28.0 |
SOURCE: U.S. Department of Transportation, Federal Highway Administration, National Bridge Inventory: Deficient Bridges by State and Highway System, Washington, DC: 2001, available at http://www.fhwa.dot.gov/bridge/britab.htm as of Jan. 31, 2002.
BTS State Transportation Profile |
A-5 |
Alaska |

Infrastructure
Figure 1-3: Highway Bridge Condition
Alaska
40 |
Percent |
|
35 |
|
|
|
|
|
|
|
|
|
|
Structurally deficient |
|
Functionally obsolete |
|
|
|
|
|
|
|||||||||||
|
|
|
|
|
|
|
|
|
|
|
|
|
|
|
|
|
|
|||||||||||||
|
|
|
|
|
|
|
|
|
|
|
|
|
|
|
|
|
|
|||||||||||||
|
|
|
|
|
|
|
|
|
|
|
|
|
|
|
|
|
|
|
|
|
|
|
|
|
|
|
|
|
|
|
30 |
|
|
|
|
|
|
|
|
|
|
|
|
|
|
|
|
|
|
|
|
|
|
|
|
|
|
|
|
|
|
25 |
|
|
|
|
|
|
|
|
|
|
|
|
|
|
|
|
|
|
|
|
|
|
|
|
|
|
|
|
|
|
|
|
|
|
|
|
|
|
|
|
|
|
|
|
|
|
|
|
|
|
|
|
|
|
|
|
|
|
|
|
|
20 |
|
18 |
|
|
18 |
|
|
|
|
17 |
|
|
|
|
18 |
|
|
17 |
|
|
16 |
|
|
|||||||
15 |
|
|
|
|
|
|
|
|
|
|
|
|
|
|
|
|
|
|
|
|
|
|
|
|
|
|
|
|
|
|
10 |
|
|
|
|
|
|
|
|
|
|
|
|
|
|
|
|
|
|
|
|
|
|
|
|
|
|
|
|
|
|
|
|
|
|
|
|
|
|
|
|
|
|
|
|
|
|
|
|
|
|
|
|
|
|
|
|
|
|
|
|
|
|
|
|
|
|
|
|
|
|
|
|
|
|
|
|
|
|
|
|
|
|
|
|
|
|
|
|
|
|
||
|
|
|
|
|
|
|
|
|
|
|
|
|
|
|
|
|
|
|
|
|
|
|
|
|
|
|
|
|
|
|
|
|
|
|
|
|
|
|
|
|
|
|
|
11 |
|
|
|
|
|
11 |
|
|
|
11 |
|
|
|
12 |
|
|
|
5 |
|
|
10 |
|
|
|
11 |
|
|
|
|
|
|
|
|
|
|
|
|
|
|
|
|
|||||||
|
|
|
|
|
|
|
|
|
|
|
|
|
|
|
|
|
|
|
|
|
|
|
|
|
|
|
|
|||
0 |
|
|
|
|
|
|
|
|
|
|
|
|
|
|
|
|
|
|
|
|
|
|
|
|
|
|
|
|
|
|
|
|
|
|
|
|
|
|
|
|
|
|
|
|
|
|
|
|
|
|
|
|
|
|
|
|
|
|
|
|
|
|
|
|
|
|
|
|
|
|
|
|
|
|
|
|
|
|
|
|
|
|
|
|
|
|
|
|
|
|
|
|
|
|
|
|
|
|
|
|
|
|
|
|
|
|
|
|
|
|
|
|
|
|
|
|
|
|
|
|
|
|
|
|
|
|
|
|
|
|
|
|
|
|
|
|
|
|
|
|
|
|
|
|
|
|
|
|
|
|
|
|
|
|
|
|
1995 |
1996 |
1997 |
|
1998 |
1999 |
2000 |
|
|||||||||||||||||||||
United States
40 |
Percent |
|
35 |
|
|
|
|
|
|
|
|
|
|
Stucturally deficient |
|
|
Functionally obsolete |
|
|
|
|
|
|
||||||||||
|
|
|
|
|
|
|
|
|
|
|
|
|
|
|
|
|
|
|||||||||||||
|
|
|
|
|
|
|
|
|
|
|
|
|
|
|
|
|
|
|||||||||||||
|
|
|
|
|
|
|
|
|
|
|
|
|
|
|
|
|
|
|
|
|
|
|
|
|
|
|
|
|
|
|
30 |
|
|
|
|
|
|
|
|
|
|
|
|
|
|
|
|
|
|
|
|
|
|
|
|
|
|
|
|
|
|
|
|
|
|
|
|
|
|
|
|
|
|
|
|
|
|
|
|
|
|
|
|
|
|
|
|
|
|
|
|
|
25 |
|
14 |
|
|
14 |
|
|
|
|
13 |
|
|
|
|
14 |
|
|
14 |
|
|
|
|
|
|
||||||
|
|
|
|
|
|
|
|
|
|
|
|
|
|
|
|
|
|
|
||||||||||||
|
|
|
|
|
|
|
|
|
|
|
|
|
|
|
|
|
|
14 |
|
|
||||||||||
|
|
|
|
|
|
|
|
|
|
|
|
|
|
|
|
|
|
|
|
|
|
|||||||||
20 |
|
|
|
|
|
|
|
|
|
|
|
|
|
|
|
|
|
|
|
|
|
|
|
|
|
|
|
|
||
|
|
|
|
|
|
|
|
|
|
|
|
|
|
|
|
|
|
|
|
|
|
|
|
|
|
|
|
|
|
|
15 |
|
|
|
|
|
|
|
|
|
|
|
|
|
|
|
|
|
|
|
|
|
|
|
|
|
|
|
|
|
|
|
|
|
|
|
|
|
|
|
|
|
|
|
|
|
|
|
|
|
|
|
|
|
|
|
|
|
|
|
|
|
|
|
|
|
|
|
|
|
|
|
|
|
|
|
|
|
|
|
|
|
|
|
|
|
|
|
|
|
|
||
|
|
|
|
|
|
|
|
|
|
|
|
|
|
|
|
|
|
|
|
|
|
|
|
|
|
|
|
|
||
10 |
|
|
|
|
|
|
|
|
|
|
|
|
|
|
|
|
|
|
|
|
|
|
|
|
|
|
|
|
|
|
|
|
18 |
|
|
|
17 |
|
|
|
|
|
|
|
|
|
|
|
|
|
|
|
|
|
|
|
|
|
|
|
|
|
|
|
|
|
|
|
|
|
|
17 |
|
|
|
|
|
|
|
|
|
|
|
|
|
|
|
|
|
|||
|
|
|
|
|
|
|
|
|
|
|
|
|
|
|
16 |
|
|
|
16 |
|
|
|
|
|
|
|||||
5 |
|
|
|
|
|
|
|
|
|
|
|
|
|
|
|
|
|
|
|
|
|
15 |
|
|
||||||
|
|
|
|
|
|
|
|
|
|
|
|
|
|
|
|
|
|
|
|
|
|
|
|
|
|
|||||
|
|
|
|
|
|
|
|
|
|
|
|
|
|
|
|
|
|
|
|
|||||||||||
|
|
|
|
|
|
|
|
|
|
|
|
|
|
|
|
|
|
|
|
|
|
|
|
|
|
|
|
|
|
|
|
|
|
|
|
|
|
|
|
|
|
|
|
|
|
|
|
|
|
|
|
|
|
|
|
|
|
|
|
|
|
|
|
|
|
|
|
|
|
|
|
|
|
|
|
|
|
|
|
|
|
|
|
|
|
|
|
|
|
|
|
|
|
|
|
|
|
|
|
|
|
|
|
|
|
|
|
|
|
|
|
|
|
|
|
|
|
|
|
|
|
|
|
0 |
|
|
|
|
|
|
|
|
|
|
|
|
|
|
|
|
|
|
|
|
|
|
|
|
|
|
|
|
|
|
|
1995 |
1996 |
1997 |
|
|
|
1998 |
1999 |
2000 |
|
||||||||||||||||||||
|
|
|
|
|
|
|||||||||||||||||||||||||
SOURCE: U.S. Department of Transportation, Federal Highway Administration, National Bridge Inventory: Deficient Bridges by State and Highway System, Washington, DC: 2001, available at http://www.fhwa.dot.gov/bridge/britab.htm as of Jan. 31, 2002.
Alaska |
A-6 |
BTS State Transportation Profile |
Infrastructure
Table 1-7: Characteristics of Directly Operated Motor Bus Transit in Alaska: 2000
|
Directional route-miles |
||
|
Exclusive |
Controlled |
Mixed |
Transit agency |
right-of-way |
right-of-way |
right-of-way |
Motor bus |
|
|
|
Municipality of Anchorage |
0.0 |
0.0 |
275.0 |
NOTES: Directional route-miles is the mileage in each direction over which public transportation vehicles travel while in revenue service. Directional route-miles are a measure of the facility or roadway, not the service carried on the facility such as the number of routes or vehicle-miles. Directional route-miles are computed with regard to direction of service, but without regard to the number of traffic lanes or rail tracks existing in the right-of-way. Exclusive right-of-way refers to lanes reserved at all times for transit use and other high occupancy vehicles (HOVs). Controlled right-of-way refers to lanes restricted for at least a portion of the day for use by transit vehicles and other HOVs. Mixed right-of-way refers to lanes used for general automobile traffic.
SOURCE: U.S. Department of Transportation, Federal Transit Administration, National Transit Database, Data Tables, available at http://www.ntdprogram.com/ as of Feb. 19, 2002.
BTS State Transportation Profile |
A-7 |
Alaska |

Infrastructure
Table 1-8: Civil and Joint-Use Airports, Heliports, STOLports, and Seaplane Bases in Alaska: 20021
|
|
|
|
Seaplane |
|
Ownership and usage |
Airports |
Heliports |
STOLports |
bases |
Total |
Publicly owned |
300 |
12 |
0 |
74 |
386 |
Open to public |
277 |
4 |
0 |
73 |
354 |
Closed to public |
23 |
8 |
0 |
1 |
32 |
Privately owned |
159 |
16 |
0 |
30 |
205 |
Open to public |
24 |
2 |
0 |
25 |
51 |
Closed to public |
135 |
14 |
0 |
5 |
154 |
Total |
459 |
28 |
0 |
104 |
591 |
1Data are current as of Jan. 31, 2002.
KEY: STOLport = Short take-off and landing airport.
NOTE: Publicly owned facilities are open for public use with no prior authorization or permission. Publicly owned facilities closed to the public include medical, law enforcement, and other such facilities.
SOURCE: U.S. Department of Transportation, Federal Aviation Administration, Office of Airports, Airport Safety Data Branch.
Alaska |
A-8 |
BTS State Transportation Profile |