

СТАТИСТИКА 1 / Министерство транспорта США / Alaska Transportation Statistics 2008
.pdfSafety
Table 2-17: Alcohol Involvement in Recreational Boating
|
|
1999 |
|
|
2000 |
|
Alaska |
United States |
|
Alaska |
United States |
Number of accidents |
|
|
|
|
|
Total |
8 |
633 |
5 |
696 |
|
Number of persons |
|
|
|
|
|
Killed |
3 |
191 |
4 |
215 |
|
Injured |
3 |
476 |
0 |
542 |
|
Figure 2-6: Alaska Recreational Boating Accidents
Involving Alcohol
16 |
Accidents Persons killed Persons injured |
|
14 |
14 |
|
|
|
|
|
|
|
|
12 |
|
|
|
|
12 |
|
|
|
|
10 |
|
10 |
|
|
|
9 |
|
|
|
|
|
|
|
|
8 |
|
|
8 |
|
7 |
|
|
|
|
|
|
|
|
|
6 |
|
5 |
|
5 |
|
|
|
||
4 |
|
|
|
4 |
4 |
|
|
3 |
3 |
|
|
|
||
2 |
|
|
2 |
|
1 |
|
|
|
|
|
|
|
|
|
0 |
|
|
|
0 |
|
|
|
|
|
1996 |
1997 |
1998 |
1999 |
2000 |
NOTE FOR DATA ON THIS PAGE: Alcohol involvement in a boating accident includes any accident in which alcoholic beverages are consumed in the boat and the investigating official has determined that the operator was impaired or affected while operating the boat.
SOURCES FOR DATA ON THIS PAGE: U.S. Department of Transportation, U.S. Coast Guard, Boating Statistics 2000 , Washington, DC: 2001; U.S. Department of Transportation, U.S. Coast Guard, Boating Statistics 1999, W ashington, DC: 2000, available at www.uscgboating.org/Saf/pdf/ Boating_Statistics_2000.pdf and www.uscgboating.org /Saf/pdf/Boating_Statistics_1999.pdf as of Nov. 14, 2001.
BTS State Transportation Profile |
B-15 |
Alaska |
Safety
Table 2-18: Hazardous Materials Incidents: 2000 (Not including pipelines)
|
|
|
|
Injuries |
|
Damages |
|
Incidents |
Deaths |
Total |
Major |
Minor |
($ thousands) |
Alaska |
43 |
0 |
0 |
0 |
0 |
384 |
United States |
17,347 |
13 |
244 |
16 |
228 |
66,619 |
NOTES: U.S. total includes U.S. territories or foreign locations.
Hazardous material incident locations are often listed as the terminals or sorting centers where they are discovered. Therefore, states with this type of a facility may show a disproportionate number of incidents.
Hazardous materials transportation incidents required to be reported are defined in the Code of Federal Regulations (CFR), 49 CFR Part 171.15, 171.16 (Form F 5800.1). Hazardous materials deaths and injuries are caused by the hazardous material in commerce.
Figure 2-7: Alaska Hazardous Materials Incidents
(Not including pipelines)
50 |
|
|
|
|
|
|
|
|
|
|
|
42 |
43 |
|
|
|
|
|
|
|
40 |
|
|
|
|
|
|
|
|
|
35 |
|
|
|
30 |
|
|
|
29 |
|
|
|
|
|
|
|
|
|
|
|
24 |
|
|
|
|
20 |
19 |
|
|
|
|
|
|
|
|
|
|
|
|
10 |
|
|
|
|
|
|
0 |
|
|
|
|
|
|
|
1995 |
1996 |
1997 |
1998 |
1999 |
2000 |
NOTE FOR DATA ON THIS PAGE: Hazardous materials incident data are subject to revision and correction by the Office of Hazardous Materials Safety.
SOURCE FOR DATA ON THIS PAGE: U.S. Department of Transportation, Research and Special Programs Administration, Office of Hazardous Materials Safety, Hazmat Summary by State for Calendar Year 2000 , and earlier years, Washington, DC: 2002, available at http://hazmat.dot.gov as of April 24, 2002.
Alaska |
B-16 |
BTS State Transportation Profile |

Safety
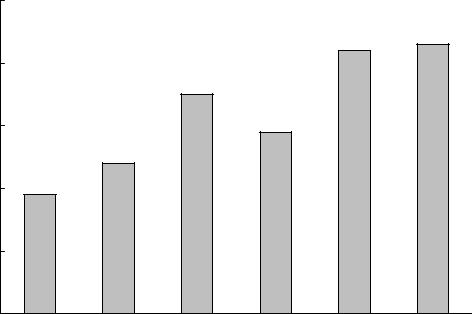
Table 2-19: Alaska Hazardous Materials Incidents by Mode: 2000 (Not including pipelines)
|
|
|
Injuries |
|
Damages |
Mode |
Total incidents |
Deaths |
Major |
Minor |
($ thousands) |
Highway |
5 |
0 |
0 |
0 |
22 |
Rail |
5 |
0 |
0 |
0 |
362 |
Air |
32 |
0 |
0 |
0 |
0.4 |
Water1 |
1 |
0 |
0 |
0 |
0 |
Total |
43 |
0 |
0 |
0 |
384 |
1Includes only packaged shipments (i.e., non-bulk shipments).
Figure 2-8: Alaska Hazardous Materials Incidents by Mode (Not including pipelines)
35 |
|
|
|
Highway |
|
|
Rail |
|
Air |
|
Water |
|||||||||
|
|
|
|
|
|
|
||||||||||||||
|
|
|
|
|
|
|
||||||||||||||
|
|
|
|
|
|
|
|
|
|
|
|
|
|
31 |
||||||
|
|
|
|
|
|
|
|
|
|
|
|
|
|
|
||||||
30 |
|
|
|
|
|
|
|
|
|
|
|
|
|
|
|
|
|
|
|
|
|
|
|
|
|
|
|
|
|
|
|
|
|
|
|
|
|
|
|
|
|
|
|
|
|
|
|
|
|
|
|
|
|
|
|
|
|
|
|
|
|
|
25 |
|
|
|
|
|
|
|
|
21 |
|
|
|
|
|
|
|
||||
|
|
|
|
|
|
|
|
|
|
|
|
|
|
|
||||||
|
|
|
|
|
|
|
|
|
|
|
|
|
|
|
|
|||||
20 |
|
|
|
|
|
|
|
|
|
|
|
|
|
|
|
|
|
|
|
|
|
|
|
|
|
|
|
|
|
|
|
|
|
|
|
|
|
|
|
|
|
|
|
|
|
|
|
|
|
|
|
|
|
|
|
|
|
|
|
|
|
|
15 |
|
|
|
|
12 |
|
|
|
|
|
|
|
|
|
|
|
|
|
|
|
|
|
|
|
|
|
|
|
|
|
|
|
|
|
|
|
|
|
|||
10 |
|
|
|
|
|
|
|
|
|
|
|
|
|
|
|
|
|
|
|
|
|
|
|
|
|
|
|
|
|
|
|
|
|
|
|
|
|
|
|
|
|
|
|
|
|
|
|
|
|
|
|
|
|
|
|
|
|
|
|
|
|
|
5 |
|
|
|
|
|
|
|
|
|
|
|
|
|
|
3 |
|
|
|
|
|
2 |
|
|
|
2 |
1 |
|
|
|
1 |
|
|
|||||||||
|
|
|
|
|
|
|
|
|
|
|
||||||||||
0 |
0 |
|
0 |
|
|
|
|
0 |
|
|
|
0 |
||||||||
|
|
|
|
|
|
|
|
|
|
|
|
|
||||||||
|
|
|
|
|
|
|
|
|
|
|
|
|
|
|
|
|
|
|
|
|
1995 |
|
|
1996 |
|
1997 |
|||||||||||||||
|
|
|
|
|||||||||||||||||
|
|
30 |
32 |
|
|
|
|
||
|
26 |
|
|
|
|
|
10 |
|
|
|
3 |
5 |
5 |
|
|
2 |
|
||
0 |
|
1 |
||
0 |
0 |
|||
|
|
|||
|
1998 |
1999 |
2000 |
NOTE FOR DATA ON THIS PAGE: Hazardous materials incident data are subject to revision and correction by the Office of Hazardous Materials Safety.
SOURCE FOR DATA ON THIS PAGE: U.S. Department of Transportation, Research and Special Programs Administration, Office of Hazardous Materials Safety, Hazmat Summary by State for Calendar Year 2000 , and earlier years, Washington, DC: 2002, available at http://hazmat.dot.gov/ as of April 24, 2002.
BTS State Transportation Profile |
B-17 |
Alaska |

Safety
Table 2-20: Natural Gas Distribution Pipeline Incidents
|
1995 |
1996 |
1997 |
1998 |
1999 |
2000 |
Alaska |
1 |
3 |
4 |
9 |
1 |
8 |
Number of incidents |
||||||
Number of fatalities |
0 |
1 |
0 |
0 |
0 |
0 |
Number of injuries |
0 |
0 |
0 |
1 |
0 |
0 |
Property damage ($ thousands) |
50 |
100 |
345 |
1,500 |
100 |
1,400 |
United States, total |
|
|
|
|
|
|
Number of incidents |
97 |
110 |
102 |
137 |
119 |
154 |
Number of fatalities |
16 |
471 |
9 |
17 |
19 |
22 |
Number of injuries |
43 |
1091 |
67 |
65 |
85 |
59 |
Property damage ($ thousands) |
10,951 |
16,2531 |
12,493 |
19,055 |
25,914 |
23,399 |
1 Includes 33 fatalities, 42 injuries, and $5,000,000 property damage associated with an incident in San Juan, Puerto Rico that was attributed to natural gas at the time. The cause of the incident is currently in dispute and subject to litigation.
NOTE: Incidents are reported on Form RSPA F 7100.1.
Table 2-21: Natural Gas Transmission Pipeline Incidents
|
1995 |
1996 |
1997 |
1998 |
1999 |
2000 |
Alaska |
|
|
|
|
|
|
Number of incidents |
0 |
0 |
0 |
1 |
1 |
0 |
Number of fatalities |
0 |
0 |
0 |
0 |
0 |
0 |
Number of injuries |
0 |
0 |
0 |
0 |
0 |
0 |
Property damage ($ thousands) |
0 |
0 |
0 |
2,000 |
100 |
0 |
United States, total |
|
|
|
|
|
|
Number of incidents |
64 |
77 |
73 |
99 |
54 |
80 |
Number of fatalities |
2 |
1 |
1 |
1 |
2 |
15 |
Number of injuries |
10 |
5 |
5 |
11 |
8 |
18 |
Property damage ($ thousands) |
9,958 |
13,078 |
12,078 |
29,749 |
17,696 |
17,868 |
NOTE: Incidents are reported on Form RSPA F 7100.2.
NOTES FOR DATA ON THIS PAGE: Incident means any of the following events:
I. An event that involves a release of gas from a pipeline or of liquefied natural gas (LNG) facility and a) a death or personal injury necessitating in-patient hospitalization or b) estimated property damage, including cost of gas lost, of the operator or others, or both, of $50,000 or more.
II. An event that results in an emergency shutdown of an LNG facility.
III. An event that is significant, in the judgment of the operator, even though it did not meet the criteria of I or II.
Historical totals may change as the Office of Pipeline Safety receives supplemental information on incidents.
SOURCE FOR DATA ON THIS PAGE: U.S. Department of Transportation, Research and Special Programs Administration, Office of Pipeline Safety, available at http://ops.dot.gov as of Jan. 7, 2002.
Alaska |
B-18 |
BTS State Transportation Profile |
Safety
Table 2-22: Hazardous Liquid Pipeline Incidents
|
1995 |
1996 |
1997 |
1998 |
1999 |
2000 |
Alaska |
|
|
|
|
|
|
Number of incidents |
0 |
2 |
0 |
0 |
0 |
0 |
Number of fatalities |
0 |
0 |
0 |
0 |
0 |
0 |
Number of injuries |
0 |
0 |
0 |
0 |
0 |
0 |
Property damage ($ thousands) |
0 |
100 |
0 |
0 |
0 |
0 |
United States, total |
|
|
|
|
|
|
Number of incidents |
188 |
193 |
171 |
153 |
168 |
147 |
Number of fatalities |
3 |
5 |
0 |
2 |
4 |
1 |
Number of injuries |
11 |
13 |
5 |
6 |
20 |
4 |
Property damage ($ thousands) |
32,519 |
53,647 |
42,671 |
59,824 |
42,977 |
115,658 |
NOTES: Historical totals may change as the Office of Pipeline Safety receives supplemental information on incidents. Incidents are reported on Form RSPA F 7100.1. An accident report is required for each failure in a pipeline system in which there is a release of the hazardous liquid or carbon dioxide transported resulting in any of the following:
1.Explosion or fire not intentionally set by the operator;
2.Loss of 50 or more barrels (8 or more cubic meters) of hazardous liquid or carbon dioxide;
3.Escape to the atmosphere of more than 5 barrels (0.8 cubic meters) a day of highly volatile liquids;
4.Death of any person;
5.Bodily harm to any person resulting in: a. loss of consciousness; or b. necessity to carry the person from the scene;
or c. necessity for medical treatment; or d. disability which prevents the discharge of normal duties or the pursuit of normal activities beyond the day of the accident;
6. Estimated property damage, including cost of clean-up and recovery, value of lost product, and damage to the property of the operator or others, or both, exceeding $50,000.
SOURCE: U.S. Department of Transportation, Research and Special Programs Administration, Office of Pipeline Safety, available at http://ops.dot.gov as of Jan 7, 2002.
BTS State Transportation Profile |
B-19 |
Alaska |
B-20
C Freight Transportation

Freight
Table 3-1: Domestic Shipments to Alaska by State: 1997 (Descending order by weight)
|
|
Weight |
|
Value |
(thousand |
State of origin |
Rank ($ millions) |
short tons) |
Alaska |
1 |
5,376 |
17,448 |
Washington |
2 |
2,535 |
2,446 |
Oregon |
3 |
1,007 |
171 |
California |
4 |
764 |
131 |
Texas |
5 |
S |
47 |
Oklahoma |
6 |
78 |
35 |
Indiana |
7 |
136 |
13 |
Illinois |
8 |
109 |
6 |
Missouri |
9 |
52 |
5 |
Minnesota |
10 |
47 |
3 |
North Carolina |
10 |
48 |
3 |
Pennsylvania |
10 |
44 |
3 |
Virginia |
10 |
27 |
3 |
Colorado |
14 |
S |
2 |
Florida |
14 |
49 |
2 |
Georgia |
14 |
39 |
2 |
South Carolina |
14 |
25 |
2 |
Tennessee |
14 |
29 |
2 |
Massachusetts |
19 |
33 |
1 |
Michigan |
19 |
13 |
1 |
New Jersey |
19 |
54 |
1 |
Alabama |
22 |
5 |
S |
Arizona |
22 |
22 |
S |
Arkansas |
22 |
7 |
S |
Connecticut |
22 |
12 |
Z |
Delaware |
22 |
S |
S |
|
|
|
Weight |
|
|
Value |
(thousand |
State of origin |
Rank |
($ millions) |
short tons) |
District of Columbia |
22 |
Z |
Z |
Hawaii |
22 |
S |
S |
Idaho |
22 |
6 |
S |
Iowa |
22 |
11 |
Z |
Kansas |
22 |
S |
S |
Kentucky |
22 |
S |
S |
Louisiana |
22 |
S |
S |
Maine |
22 |
S |
S |
Maryland |
22 |
8 |
S |
Mississippi |
22 |
S |
S |
Montana |
22 |
S |
S |
Nebraska |
22 |
7 |
S |
Nevada |
22 |
S |
S |
New Hampshire |
22 |
S |
S |
New Mexico |
22 |
17 |
S |
New York |
22 |
S |
S |
North Dakota |
22 |
S |
S |
Ohio |
22 |
70 |
S |
Rhode Island |
22 |
S |
S |
South Dakota |
22 |
S |
S |
Utah |
22 |
39 |
S |
Vermont |
22 |
S |
S |
West Virginia |
22 |
S |
Z |
Wisconsin |
22 |
64 |
S |
Wyoming |
22 |
S |
S |
From all states |
|
12,610 |
20,571 |
KEY: S = data do not meet publication standards because of high sampling variability or other reasons; Z = zero or less than 1 unit of measure.
NOTES: The Commodity Flow Survey covers business establishments in mining, manufacturing, wholesale trade, and selected retail industries. The survey also covers selected auxiliary establishments (e.g., warehouses) of in-scope multiunit and retail companies. The survey excludes establishments classified as farms, forestry, fisheries, governments, construction, transportation, foreign establishments, services, and most establishments in retail. Due to industry-wide reporting problems, shipments by oil and gas extraction establishments are also excluded. "From all states" total includes all domestic shipments to the destination state, including intrastate shipments.
SOURCE: U.S. Department of Transportation, Bureau of Transportation Statistics and U.S. Department of Commerce, U.S. Census Bureau, 1997 Commodity Flow Survey , Washington, DC: 1999, available at http://www.bts.gov/ntda/cfs/cfs97od.html as of Nov. 2, 2001.
BTS State Transportation Profile |
C-1 |
Alaska |

Freight
Table 3-2: Domestic Shipments from Alaska by State: 1997 (Descending order by weight)
|
|
|
Weight |
State of |
|
Value |
(thousand |
destination |
Rank |
($ millions) |
short tons) |
Alaska |
1 |
5,376 |
17,448 |
Alabama |
- |
S |
S |
Arizona |
- |
S |
S |
Arkansas |
- |
S |
S |
California |
- |
S |
S |
Colorado |
- |
S |
S |
Connecticut |
- |
S |
S |
Delaware |
- |
S |
S |
District of Columbia |
- |
S |
S |
Florida |
- |
S |
Z |
Georgia |
- |
S |
S |
Hawaii |
- |
S |
S |
Idaho |
- |
S |
S |
Illinois |
- |
1 |
Z |
Indiana |
- |
S |
Z |
Iowa |
- |
S |
S |
Kansas |
- |
S |
S |
Kentucky |
- |
S |
S |
Louisiana |
- |
S |
S |
Maine |
- |
S |
S |
Maryland |
- |
S |
S |
Massachusetts |
- |
S |
S |
Michigan |
- |
1 |
S |
Minnesota |
- |
S |
S |
Mississippi |
- |
S |
S |
Missouri |
- |
S |
S |
|
|
|
Weight |
State of |
|
Value |
(thousand |
destination |
Rank |
($ millions) |
short tons) |
Montana |
- |
S |
S |
Nebraska |
- |
S |
S |
Nevada |
- |
Z |
S |
New Hampshire |
- |
S |
S |
New Jersey |
- |
S |
S |
New Mexico |
- |
S |
S |
New York |
- |
18 |
S |
North Carolina |
- |
S |
S |
North Dakota |
- |
S |
S |
Ohio |
- |
Z |
Z |
Oklahoma |
- |
S |
S |
Oregon |
- |
S |
S |
Pennsylvania |
- |
5 |
Z |
Rhode Island |
- |
S |
S |
South Carolina |
- |
Z |
Z |
South Dakota |
- |
Z |
Z |
Tennessee |
- |
S |
S |
Texas |
- |
S |
Z |
Utah |
- |
S |
S |
Vermont |
- |
S |
S |
Virginia |
- |
S |
S |
Washington |
- |
878 |
S |
West Virginia |
- |
Z |
Z |
Wisconsin |
- |
S |
S |
Wyoming |
- |
S |
S |
To all states |
|
6,653 |
19,673 |
KEY: S = data do not meet publication standards because of high sampling variability or other reasons; Z = zero or less than 1 unit of measure.
NOTES: The Commodity Flow Survey covers business establishments in mining, manufacturing, wholesale trade, and selected retail industries. The survey also covers selected auxiliary establishments (e.g., warehouses) of in-scope multiunit and retail companies. The survey excludes establishments classified as farms, forestry, fisheries, governments, construction, transportation, foreign establishments, services, and most establishments in retail. Due to industry-wide reporting problems, shipments by oil and gas extraction establishments are also excluded. "To all states" total includes all domestic shipments from the state of origin, including intrastate shipments.
SOURCE: U.S. Department of Transportation, Bureau of Transportation Statistics and U.S. Department of Commerce, U.S. Census Bureau, 1997 Commodity Flow Survey , Washington, DC: 1999, available at http://www.bts.gov/ntda/cfs/cfs97od.html as of Nov. 2, 2001.
Alaska |
C-2 |
BTS State Transportation Profile |