

СТАТИСТИКА 1 / Министерство транспорта США / Alaska Transportation Statistics 2008
.pdfTable 1-9: Alaska Commercial Service Airport Enplanements: 2000
(For airports with scheduled service and 2,500 or more passengers enplaned)
|
|
Commuter and |
|
|
|
|
Large |
small |
Air taxi |
|
|
|
certificated air |
certificated air |
commuter |
Foreign air |
Total |
Airport |
carriers |
carriers |
operators |
carriers |
enplanements |
Ted Stevens Anchorage International |
1,708,249 |
279,481 |
215 |
515,193 |
2,503,138 |
Juneau International |
255,362 |
75,917 |
61,592 |
1,034 |
393,905 |
Fairbanks International |
331,890 |
54,743 |
2,100 |
0 |
388,733 |
Bethel |
44,108 |
85,459 |
0 |
0 |
129,567 |
Ketchikan International |
99,730 |
7,397 |
5,083 |
0 |
112,210 |
Kenai Municipal |
0 |
100,876 |
89 |
0 |
100,965 |
Sitka Rocky Gutierrez |
67,322 |
547 |
133 |
0 |
68,002 |
Kodiak |
30,411 |
35,489 |
5 |
0 |
65,905 |
Ralph Wien Memorial |
26,187 |
31,925 |
0 |
0 |
58,112 |
Nome |
27,500 |
27,640 |
5 |
0 |
55,145 |
King Salmon |
11,748 |
35,119 |
394 |
0 |
47,261 |
Ketchikan Harbor |
0 |
46,192 |
0 |
0 |
46,192 |
Dillingham |
11,966 |
31,512 |
1,920 |
0 |
45,398 |
Wiley Post-Will Rogers Memorial |
27,874 |
11,006 |
0 |
0 |
38,880 |
Unalaska |
20,373 |
10,736 |
0 |
0 |
31,109 |
Homer |
0 |
27,519 |
1,218 |
0 |
28,737 |
Skagway |
0 |
23,002 |
0 |
0 |
23,002 |
Valdez |
0 |
22,530 |
250 |
0 |
22,780 |
Merle K (Mudhole) Smith |
11,342 |
9,012 |
0 |
0 |
20,354 |
Lake Hood |
0 |
1,056 |
18,071 |
0 |
19,127 |
Petersburg James A Johnson |
17,643 |
1,229 |
126 |
0 |
18,998 |
Aniak |
0 |
17,184 |
10 |
0 |
17,194 |
Deadhorse |
10,581 |
6,360 |
0 |
0 |
16,941 |
Yakutat |
12,010 |
3,335 |
13 |
0 |
15,358 |
Gustavus |
4,855 |
5,130 |
4,791 |
0 |
14,776 |
Wrangell |
9,633 |
87 |
3,339 |
0 |
13,059 |
Kodiak Municipal |
0 |
12,165 |
804 |
0 |
12,969 |
Manokotak |
0 |
2,023 |
10,499 |
0 |
12,522 |
Haines |
0 |
10,655 |
0 |
0 |
10,655 |
Fort Yukon |
1 |
10,452 |
45 |
0 |
10,498 |
Hoonah |
0 |
10,483 |
0 |
0 |
10,483 |
Red Dog |
6,171 |
4,086 |
0 |
0 |
10,257 |
Metlakatla |
0 |
8,849 |
1,178 |
0 |
10,027 |
Iliamna |
0 |
8,517 |
679 |
0 |
9,196 |
Merrill Field |
0 |
4,269 |
4,904 |
0 |
9,173 |
Edward G. Pitka Sr. |
0 |
9,089 |
0 |
0 |
9,089 |
Cold Bay |
4,470 |
3,934 |
132 |
0 |
8,536 |
Unalakleet |
0 |
8,413 |
0 |
0 |
8,413 |
St Mary's |
0 |
7,126 |
0 |
0 |
7,126 |
Craig |
0 |
5,060 |
1,342 |
0 |
6,402 |
Emmonak |
0 |
5,981 |
0 |
0 |
5,981 |
Mc Grath |
0 |
5,484 |
3 |
0 |
5,487 |
Mountain Village |
0 |
5,448 |
0 |
0 |
5,448 |
Robert/Bob/Curtis Memorial |
0 |
5,314 |
0 |
0 |
5,314 |
Ugnu-Kuparuk |
0 |
5,169 |
0 |
0 |
5,169 |
Hooper Bay |
0 |
5,109 |
0 |
0 |
5,109 |
Selawk |
0 |
5,073 |
0 |
0 |
5,073 |
Lake Brooks |
114 |
4,503 |
0 |
0 |
4,617 |
Kipnuk |
0 |
4,555 |
0 |
0 |
4,555 |
NOTE: Rank order by total enplaned passengers on air carriers of all types, including foreign air carriers.
|
|
Commuter and |
|
|
|
|
Large |
small |
Air taxi |
Foreign |
|
|
certificated air |
certificated air |
commuter |
air |
Total |
Airport |
carriers |
carriers |
operators |
carriers |
enplanements |
Point Hope |
0 |
4,533 |
0 |
0 |
4,533 |
Sand Point |
2,151 |
2,239 |
0 |
0 |
4,390 |
Nuiqsut |
1 |
4,184 |
0 |
0 |
4,185 |
Ralph M Calhoun Memorial |
0 |
3,967 |
200 |
0 |
4,167 |
Kalskag |
0 |
4,146 |
0 |
0 |
4,146 |
Chevak |
0 |
4,141 |
0 |
0 |
4,141 |
Togiak |
0 |
3,397 |
728 |
0 |
4,125 |
Noatak |
0 |
4,120 |
0 |
0 |
4,120 |
Beluga |
0 |
4,090 |
0 |
0 |
4,090 |
Alakanuk |
0 |
4,054 |
0 |
0 |
4,054 |
Pilot Station |
0 |
3,903 |
0 |
0 |
3,903 |
Savoonga |
0 |
3,812 |
0 |
0 |
3,812 |
Kake |
0 |
3,754 |
0 |
0 |
3,754 |
Bob Baker Memorial |
0 |
3,735 |
0 |
0 |
3,735 |
Shishmaref/New |
0 |
3,667 |
0 |
0 |
3,667 |
Toksook Bay |
0 |
3,516 |
0 |
0 |
3,516 |
Kotlik/New |
0 |
3,511 |
0 |
0 |
3,511 |
Gambell |
0 |
3,486 |
0 |
0 |
3,486 |
Tuntutuliak |
0 |
3,461 |
0 |
0 |
3,461 |
Hollis |
0 |
2,863 |
549 |
0 |
3,412 |
Kivalina |
0 |
3,320 |
0 |
0 |
3,320 |
St Paul Island |
2,826 |
491 |
0 |
0 |
3,317 |
Larsen bay |
0 |
3,309 |
0 |
0 |
3,309 |
Nulato |
0 |
3,226 |
0 |
0 |
3,226 |
New Stuyahok |
0 |
1,917 |
1,305 |
0 |
3,222 |
Kwigillingok |
0 |
3,209 |
0 |
0 |
3,209 |
Wainwright |
0 |
3,166 |
0 |
0 |
3,166 |
Buckland |
0 |
3,163 |
0 |
0 |
3,163 |
Port Alsworth |
0 |
157 |
3,000 |
0 |
3,157 |
Anaktuvuk Pass |
0 |
3,079 |
0 |
0 |
3,079 |
Tuluksak |
0 |
3,072 |
0 |
0 |
3,072 |
Kongiganak |
0 |
3,041 |
0 |
0 |
3,041 |
Chefornak |
0 |
3,022 |
0 |
0 |
3,022 |
Scammon Bay |
0 |
3,022 |
0 |
0 |
3,022 |
Angoon |
0 |
3,009 |
0 |
0 |
3,009 |
Kwethluk |
0 |
2,971 |
0 |
0 |
2,971 |
Huslia |
0 |
2,848 |
0 |
0 |
2,848 |
Kasigluk |
0 |
2,805 |
0 |
0 |
2,805 |
Nunapitchuk |
0 |
2,772 |
0 |
0 |
2,772 |
Marshell |
0 |
2,711 |
0 |
0 |
2,711 |
Kokhankok |
0 |
1,777 |
931 |
0 |
2,708 |
Akiachak |
0 |
2,681 |
0 |
0 |
2,681 |
Stebbins |
0 |
2,666 |
0 |
0 |
2,666 |
Thorne bay |
0 |
1,933 |
722 |
0 |
2,655 |
Elim |
0 |
2,634 |
0 |
0 |
2,634 |
King Cove |
0 |
2,577 |
0 |
0 |
2,577 |
Bettles |
0 |
2,564 |
0 |
0 |
2,564 |
Russian Mission |
0 |
2,519 |
0 |
0 |
2,519 |
SOURCE: U.S. Department of Transportation, Federal Aviation Administration, Office of the Associate Administrator for Airports, CY 2000 Enplanement Activity at U.S. Commercial Service Airports , available at http://www.faa.gov/arp/Planning/v3.htm as of March 26, 2002.

Infrastructure
Table 1-10: Freight Railroads in Alaska and the United States: 2000
Number |
Miles operated2 |
|
of railroads |
|
|
United |
|
Type of railroad |
States |
Alaska |
Total |
562 |
1 |
Class I |
8 |
0 |
Regional |
35 |
1 |
Local |
304 |
0 |
Switching and terminal |
213 |
0 |
Canadian1 |
2 |
0 |
|
|
Alaska |
|
|
Excluding |
Including |
|
United |
trackage |
trackage |
Percent of |
States |
rights |
rights |
U.S. total |
172,101 |
482 |
482 |
0.3 |
120,597 |
0 |
0 |
0.0 |
20,978 |
482 |
482 |
2.3 |
21,512 |
0 |
0 |
0.0 |
7,425 |
0 |
0 |
0.0 |
1,589 |
0 |
0 |
0.0 |
1Refers to non-Class I, Canadian-owned lines.
2Miles operated is in terms of railroad so that a mile of single track is counted the same as a mile of double track. Sidings, turnouts, yard switching mileage, and mileage not operated are excluded. Miles operated under trackage rights provided by another (owning) railroad are included.
NOTES:
1.As defined by the Surface Transportation Board in 2000, a Class I Railroad is a railroad with operating revenues of at least $261.9 million.
2.A Regional Railroad is a non-Class I, line-haul railroad operating 350 or more miles of road or with revenues of at least $40 million or both.
3.A Local Railroad is a railroad which is neither a Class I nor a Regional Railroad, and is engaged primarily in line-haul service.
4.A Switching and Terminal Railroad is a non-Class I railroad engaged primarily in switching and/or terminal services for other railroads.
SOURCE: Association of American Railroads, Railroads and States - 2000, Washington, DC: 2002, available at http://www.aar.org/AboutTheIndustry/StateInformation.asp as of Mar. 19, 2002.
Alaska |
A-10 |
BTS State Transportation Profile |

Infrastructure
Table 1-11: Freight Railroads Operating in Alaska by Class: 2000
|
Miles operated in |
Railroad |
Alaska1 |
Class I railroads |
|
(None) |
0 |
Regional railroads |
|
Alaska Railroad |
482 |
Local railroads |
|
(None) |
0 |
Switching and terminal railroads |
|
(None) |
0 |
1Miles operated is in terms of railroad so that a mile of single track is counted the same as a mile of double track. Sidings, turnouts, yard switching mileage, and mileage not operated are excluded. Miles operated under trackage rights provided by another (owning) railroad are included.
NOTE: For definition of railroad types see previous table.
SOURCE: Association of American Railroads, Railroads and States - 2000 , Washington, DC: 2002, available at http://www.aar.org/AboutTheIndustry/StateInformation.asp as of Mar. 19, 2002.
BTS State Transportation Profile |
A-11 |
Alaska |

Infrastructure
Table 1-12: Alaska Water Ports Ranked in Top 150 U.S.
Ports by Tonnage: 2000
|
|
Millions of short tons |
||
Port |
U.S. rank |
Total |
Foreign |
Domestic |
Valdez |
10 |
53.4 |
4.0 |
49.4 |
Nikishka |
80 |
5.1 |
2.8 |
2.4 |
Anchorage |
93 |
3.7 |
1.8 |
1.9 |
Kivilina |
124 |
1.9 |
0.7 |
1.2 |
Ketchlkan |
138 |
1.4 |
0.7 |
0.7 |
SOURCE: U.S. Army Corps of Engineers, Waterborne Commerce of the United States, Calendar Year 2000, Part 5 National Summaries, Alexandria, VA: 2001, available at: http://www.wrsc.usace.army.mil/ndc/wcusnatl00.pdf as of April 15, 2002.
Table 1-13: Inland Waterway Mileage: 2000
(Includes 39 states and the District of Columbia)
State |
Miles |
Alabama |
1,270 |
Alaska |
5,497 |
Arkansas |
1,860 |
California |
286 |
Connecticut |
117 |
Delaware |
99 |
District of Columbia |
7 |
Florida |
1,540 |
Georgia |
721 |
Idaho |
111 |
Illinois |
1,095 |
Indiana |
353 |
Iowa |
492 |
Kansas |
120 |
Kentucky |
1,591 |
Louisiana |
2,823 |
Maine |
73 |
Maryland |
532 |
Massachusetts |
90 |
Minnesota |
258 |
State |
Miles |
Mississippi |
873 |
Missouri |
1,033 |
Nebraska |
318 |
New Hampshire |
8 |
New Jersey |
360 |
New York |
394 |
North Carolina |
1,152 |
Ohio |
444 |
Oklahoma |
150 |
Oregon |
681 |
Pennsylvania |
259 |
Rhode Island |
39 |
South Carolina |
482 |
South Dakota |
75 |
Tennessee |
946 |
Texas |
834 |
Virginia |
674 |
Washington |
1,057 |
West Virginia |
682 |
Wisconsin |
231 |
NOTES: Waterway mileages were determined by including the length of channels 1) with a controlling draft of nine feet or greater, 2) with commercial cargo traffic reported for 1998 and 1999, but 3) were not offshore (i.e., channels in coastal areas included only the miles from the entrance channel inward). Channels within major bays are included (e.g., Chesapeake Bay, San Francisco Bay, Puget Sound, Long Island Sound, major sounds and straits in southeastern Alaska). Channels in the Great Lakes are not included, but waterways connecting lakes and the St. Lawrence Seaway inside the United States are included.
SOURCE: U.S. Army Corps of Engineers, personal communication, Jan. 8, 2002.
Alaska |
A-12 |
BTS State Transportation Profile |
B Safety
Safety
Table 2-1: Highway Traffic Fatalities and Fatality Rates: 2000
|
|
|
|
|
Fatality rate per |
|
|
|
|
|
|
|
|
|
|
100 million |
|
|
|
Licensed |
Registered |
Vehicle-miles |
100,000 |
100,000 |
vehicle- |
|
|
Traffic |
drivers |
vehicles |
traveled |
licensed |
registered |
miles |
|
State |
fatalities |
(thousands) |
(thousands) |
(millions) |
drivers |
vehicles |
traveled |
|
Alabama |
995 |
3,521 |
4,015 |
56,534 |
28.3 |
24.8 |
1.8 |
|
Alaska |
103 |
465 |
611 |
4,613 |
22.2 |
16.9 |
2.2 |
|
Arizona |
1,036 |
3,434 |
3,960 |
49,768 |
30.2 |
26.2 |
2.1 |
|
Arkansas |
652 |
1,948 |
1,865 |
29,167 |
33.5 |
35.0 |
2.2 |
|
California |
3,753 |
21,244 |
28,146 |
306,649 |
17.7 |
13.3 |
1.2 |
|
Colorado |
681 |
3,107 |
3,724 |
41,771 |
21.9 |
18.3 |
1.6 |
|
Connecticut |
342 |
2,653 |
2,907 |
30,756 |
12.9 |
11.8 |
1.1 |
|
Delaware |
123 |
557 |
641 |
8,240 |
22.1 |
19.2 |
1.5 |
|
District of Columbia |
49 |
348 |
244 |
3,498 |
14.1 |
20.1 |
1.4 |
|
Florida |
2,999 |
12,853 |
12,036 |
152,136 |
23.3 |
24.9 |
2.0 |
|
Georgia |
1,541 |
5,550 |
7,243 |
105,010 |
27.8 |
21.3 |
1.5 |
|
Hawaii |
131 |
769 |
758 |
8,543 |
17.0 |
17.3 |
1.5 |
|
Idaho |
276 |
884 |
1,220 |
13,534 |
31.2 |
22.6 |
2.0 |
|
Illinois |
1,418 |
7,961 |
9,168 |
102,866 |
17.8 |
15.5 |
1.4 |
|
Indiana |
875 |
3,976 |
5,689 |
70,862 |
22.0 |
15.4 |
1.2 |
|
Iowa |
445 |
1,953 |
3,233 |
29,433 |
22.8 |
13.8 |
1.5 |
|
Kansas |
461 |
1,908 |
2,346 |
28,130 |
24.2 |
19.7 |
1.6 |
|
Kentucky |
820 |
2,694 |
2,870 |
46,803 |
30.4 |
28.6 |
1.8 |
|
Louisiana |
937 |
2,759 |
3,605 |
40,849 |
34.0 |
26.0 |
2.3 |
|
Maine |
169 |
920 |
1,053 |
14,190 |
18.4 |
16.1 |
1.2 |
|
Maryland |
588 |
3,382 |
3,897 |
50,174 |
17.4 |
15.1 |
1.2 |
|
Massachusetts |
433 |
4,490 |
5,372 |
52,796 |
9.6 |
8.1 |
0.8 |
|
Michigan |
1,382 |
6,925 |
8,619 |
97,792 |
20.0 |
16.0 |
1.4 |
|
Minnesota |
625 |
2,941 |
4,773 |
52,601 |
21.3 |
13.1 |
1.2 |
|
Mississippi |
949 |
2,008 |
2,321 |
35,536 |
47.3 |
40.9 |
2.7 |
|
Missouri |
1,157 |
3,856 |
4,641 |
67,083 |
30.0 |
24.9 |
1.7 |
|
Montana |
237 |
679 |
1,053 |
9,882 |
34.9 |
22.5 |
2.4 |
|
Nebraska |
276 |
1,195 |
1,640 |
18,081 |
23.1 |
16.8 |
1.5 |
|
Nevada |
323 |
1,371 |
1,245 |
17,639 |
23.6 |
25.9 |
1.8 |
|
New Hampshire |
126 |
930 |
1,100 |
12,021 |
13.6 |
11.5 |
1.0 |
|
New Jersey |
731 |
5,655 |
6,502 |
67,446 |
12.9 |
11.2 |
1.1 |
|
New Mexico |
430 |
1,239 |
1,557 |
22,760 |
34.7 |
27.6 |
1.9 |
|
New York |
1,458 |
10,871 |
10,342 |
129,057 |
13.4 |
14.1 |
1.1 |
|
North Carolina |
1,472 |
5,690 |
6,305 |
89,504 |
25.9 |
23.3 |
1.6 |
|
North Dakota |
86 |
459 |
711 |
7,217 |
18.7 |
12.1 |
1.2 |
|
Ohio |
1,351 |
8,206 |
10,722 |
105,898 |
16.5 |
12.6 |
1.3 |
|
Oklahoma |
652 |
2,295 |
3,072 |
43,355 |
28.4 |
21.2 |
1.5 |
|
Oregon |
451 |
2,495 |
3,091 |
35,010 |
18.1 |
14.6 |
1.3 |
|
Pennsylvania |
1,520 |
8,229 |
9,476 |
102,337 |
18.5 |
16.0 |
1.5 |
|
Rhode Island |
80 |
654 |
779 |
8,359 |
12.2 |
10.3 |
1.0 |
|
South Carolina |
1,065 |
2,843 |
3,146 |
45,538 |
37.5 |
33.9 |
2.3 |
|
South Dakota |
173 |
544 |
822 |
8,432 |
31.8 |
21.0 |
2.1 |
|
Tennessee |
1,306 |
4,251 |
4,891 |
65,732 |
30.7 |
26.7 |
2.0 |
|
Texas |
3,769 |
13,462 |
14,257 |
220,064 |
28.0 |
26.4 |
1.7 |
|
Utah |
373 |
1,463 |
1,656 |
22,597 |
25.5 |
22.5 |
1.7 |
|
Vermont |
79 |
506 |
537 |
6,811 |
15.6 |
14.7 |
1.2 |
|
Virginia |
930 |
4,837 |
6,107 |
74,801 |
19.2 |
15.2 |
1.2 |
|
Washington |
632 |
4,155 |
5,235 |
53,330 |
15.2 |
12.1 |
1.2 |
|
West Virginia |
410 |
1,347 |
1,468 |
19,242 |
30.4 |
27.9 |
2.1 |
|
Wisconsin |
799 |
3,770 |
4,545 |
57,266 |
21.2 |
17.6 |
1.4 |
|
Wyoming |
152 |
371 |
605 |
8,090 |
41.0 |
25.1 |
1.9 |
|
United States |
41,821 |
190,625 |
217,028 |
2,749,803 |
21.9 |
19.3 |
1.5 |
|
SOURCES: U.S. Department of Transportation, National Highway Traffic Safety Administration, Traffic Safety Facts 2000 , Washington, DC: 2001, available at http://www-nrd.nhtsa.dot.gov/pdf/nrd-30/NCSA/TSFAnn/TSF2000.pdf as of Jan. 4, 2001; U.S. Department of Transportation, Federal Highway Administration, Highway Statistics 2000 , Washington, DC: 2001, available at http://www.fhwa.dot.gov/ohim/ohimstat.htm as of Dec. 6, 2001.
BTS State Transportation Profile |
B-1 |
Alaska |

Safety
Table 2-2: Passenger Car Occupants Killed and Restraint Use: 2000
|
|
|
|
|
|
|
Restraint use |
|
Total occupants |
||
|
Restraint used |
|
No restraint used |
|
unknown |
|
killed |
||||
State |
Number |
Percent |
|
Number |
Percent |
|
Number |
Percent |
|
Number |
Percent |
Alabama |
204 |
38.2 |
308 |
57.7 |
22 |
4.1 |
534 |
100.0 |
|||
Alaska |
11 |
39.3 |
17 |
60.7 |
0 |
0.0 |
28 |
100.0 |
|||
Arizona |
131 |
36.0 |
183 |
50.3 |
50 |
13.7 |
364 |
100.0 |
|||
Arkansas |
95 |
32.3 |
160 |
54.4 |
39 |
13.3 |
294 |
100.0 |
|||
California |
917 |
53.5 |
499 |
29.1 |
298 |
17.4 |
1,714 |
100.0 |
|||
Colorado |
129 |
47.1 |
142 |
51.8 |
3 |
1.1 |
274 |
100.0 |
|||
Connecticut |
69 |
38.1 |
90 |
49.7 |
22 |
12.2 |
181 |
100.0 |
|||
Delaware |
20 |
29.0 |
47 |
68.1 |
2 |
2.9 |
69 |
100.0 |
|||
District of Columbia |
4 |
22.2 |
7 |
38.9 |
7 |
38.9 |
18 |
100.0 |
|||
Florida |
523 |
37.7 |
836 |
60.3 |
27 |
1.9 |
1,386 |
100.0 |
|||
Georgia |
337 |
42.9 |
351 |
44.7 |
98 |
12.5 |
786 |
100.0 |
|||
Hawaii |
23 |
37.7 |
29 |
47.5 |
9 |
14.8 |
61 |
100.0 |
|||
Idaho |
42 |
35.9 |
69 |
59.0 |
6 |
5.1 |
117 |
100.0 |
|||
Illinois |
234 |
34.3 |
311 |
45.6 |
137 |
20.1 |
682 |
100.0 |
|||
Indiana |
203 |
43.0 |
222 |
47.0 |
47 |
10.0 |
472 |
100.0 |
|||
Iowa |
107 |
41.6 |
98 |
38.1 |
52 |
20.2 |
257 |
100.0 |
|||
Kansas |
77 |
33.2 |
127 |
54.7 |
28 |
12.1 |
232 |
100.0 |
|||
Kentucky |
156 |
36.3 |
269 |
62.6 |
5 |
1.2 |
430 |
100.0 |
|||
Louisiana |
127 |
30.1 |
232 |
55.0 |
63 |
14.9 |
422 |
100.0 |
|||
Maine |
37 |
36.6 |
58 |
57.4 |
6 |
5.9 |
101 |
100.0 |
|||
Maryland |
167 |
55.3 |
117 |
38.7 |
18 |
6.0 |
302 |
100.0 |
|||
Massachusetts |
63 |
25.9 |
128 |
52.7 |
52 |
21.4 |
243 |
100.0 |
|||
Michigan |
364 |
51.3 |
260 |
36.6 |
86 |
12.1 |
710 |
100.0 |
|||
Minnesota |
129 |
37.5 |
174 |
50.6 |
41 |
11.9 |
344 |
100.0 |
|||
Mississippi |
144 |
28.3 |
354 |
69.5 |
11 |
2.2 |
509 |
100.0 |
|||
Missouri |
198 |
33.4 |
326 |
55.0 |
69 |
11.6 |
593 |
100.0 |
|||
Montana |
38 |
37.3 |
56 |
54.9 |
8 |
7.8 |
102 |
100.0 |
|||
Nebraska |
35 |
27.1 |
76 |
58.9 |
18 |
14.0 |
129 |
100.0 |
|||
Nevada |
52 |
38.2 |
81 |
59.6 |
3 |
2.2 |
136 |
100.0 |
|||
New Hampshire |
13 |
21.0 |
43 |
69.4 |
6 |
9.7 |
62 |
100.0 |
|||
New Jersey |
161 |
42.4 |
197 |
51.8 |
22 |
5.8 |
380 |
100.0 |
|||
New Mexico |
72 |
41.9 |
90 |
52.3 |
10 |
5.8 |
172 |
100.0 |
|||
New York |
360 |
50.8 |
290 |
40.9 |
59 |
8.3 |
709 |
100.0 |
|||
North Carolina |
369 |
45.0 |
354 |
43.2 |
97 |
11.8 |
820 |
100.0 |
|||
North Dakota |
8 |
19.0 |
33 |
78.6 |
1 |
2.4 |
42 |
100.0 |
|||
Ohio |
319 |
41.5 |
396 |
51.6 |
53 |
6.9 |
768 |
100.0 |
|||
Oklahoma |
128 |
40.4 |
187 |
59.0 |
2 |
0.6 |
317 |
100.0 |
|||
Oregon |
147 |
67.1 |
60 |
27.4 |
12 |
5.5 |
219 |
100.0 |
|||
Pennsylvania |
265 |
31.7 |
443 |
53.1 |
127 |
15.2 |
835 |
100.0 |
|||
Rhode Island |
8 |
18.6 |
33 |
76.7 |
2 |
4.7 |
43 |
100.0 |
|||
South Carolina |
158 |
38.3 |
246 |
59.7 |
8 |
1.9 |
412 |
100.0 |
|||
South Dakota |
11 |
15.3 |
58 |
80.6 |
3 |
4.2 |
72 |
100.0 |
|||
Tennessee |
207 |
28.6 |
479 |
66.1 |
39 |
5.4 |
725 |
100.0 |
|||
Texas |
914 |
54.7 |
723 |
43.2 |
35 |
2.1 |
1,672 |
100.0 |
|||
Utah |
66 |
39.3 |
97 |
57.7 |
5 |
3.0 |
168 |
100.0 |
|||
Vermont |
23 |
57.5 |
15 |
37.5 |
2 |
5.0 |
40 |
100.0 |
|||
Virginia |
199 |
40.4 |
264 |
53.7 |
29 |
5.9 |
492 |
100.0 |
|||
Washington |
153 |
44.5 |
185 |
53.8 |
6 |
1.7 |
344 |
100.0 |
|||
West Virginia |
71 |
31.1 |
151 |
66.2 |
6 |
2.6 |
228 |
100.0 |
|||
Wisconsin |
161 |
37.3 |
231 |
53.5 |
40 |
9.3 |
432 |
100.0 |
|||
Wyoming |
23 |
46.0 |
27 |
54.0 |
0 |
0.0 |
50 |
100.0 |
|||
United States |
8,472 |
41.3 |
10,229 |
49.9 |
1,791 |
8.7 |
20,492 |
100.0 |
|||
NOTE: Fatalities in this table include passenger car occupants only. Occupants of other vehicle types - light trucks, heavy trucks, motorcycles, and buses - are excluded as are other types of highway related fatalities such as pedestrian fatalities. Hence, the fatalities represented here are lower then those in table 2-1. Percents may not add to totals due to rounding.
SOURCE: U.S. Department of Transportation, National Highway Traffic Safety Administration, Traffic Safety Facts 2000 , Washington, DC: 2001, available at http://www-nrd.nhtsa.dot.gov/pdf/nrd-30/NCSA/TSFAnn /TSF2000.pdf as of Jan. 4, 2002.
Alaska |
B-2 |
BTS State Transportation Profile |

Safety
Table 2-3. Key Provisions of Safety Belt Use Laws: 2000
State |
Effective1 |
Enforcement2 |
Fine |
Seats |
Vehicles exempted3 |
Alabama |
7/18/92 |
Primary |
$25 |
Front |
Designed for more than 10 passengers |
Alaska |
9/12/90 |
Secondary |
$15 |
All |
School bus |
Arizona |
1/1/91 |
Secondary |
$10 |
Front |
Designed for more than 10 passengers; model |
|
|
|
$25 4 |
|
year before 1972 |
Arkansas |
7/15/91 |
Secondary |
Front |
School bus, church bus, public bus |
|
California |
1/1/86 |
Primary |
$20 5 |
All |
None |
Colorado |
7/1/87 |
Secondary |
$15 |
Front |
Passenger bus, school bus |
Connecticut |
1/1/86 |
Primary |
$15 |
Front |
Truck or bus over 15,000 lbs. |
Delaware |
1/1/92 |
Secondary |
$20 |
Front |
None |
District of Columbia |
12/12/85 |
Primary |
$50 6 |
All |
Seating more than 8 people |
Florida |
7/1/86 |
Secondary |
$30 |
Front |
School bus, public bus, truck over 5,000 lbs. |
Georgia |
9/1/88 |
Primary |
$15 |
Front |
Designed for more than 10 passengers, pickup |
Hawaii |
2/16/85 |
Primary |
$45 |
Front |
Bus or school bus over 10,000 lbs. |
Idaho |
7/1/86 |
Secondary |
$5 |
Front |
Over 8,000 lbs. |
Illinois |
7/1/85 |
Secondary |
$25 |
Front |
None |
Indiana |
7/1/87 |
Primary |
$25 |
Front |
Truck, tractor, RV |
Iowa |
7/1/86 |
Primary |
$10 |
Front |
None |
Kansas |
7/1/86 |
Secondary |
$10 |
Front |
Designed for more than 10 people, truck over |
|
|
|
|
|
12,000 lbs. |
Kentucky |
7/13/94 |
Secondary |
$25 |
All |
Designed for more than 10 people |
Louisiana |
7/1/86 |
Primary |
$25 7 |
Front |
Manufactured before 1/1/81 |
Maine |
12/27/95 |
Secondary |
$50 |
All |
None |
Maryland |
7/1/86 |
Primary |
$25 |
Front |
Historic vehicle |
Massachusetts |
2/1/94 |
Secondary |
$25 |
All |
Truck over 18,000 lbs., bus, taxi |
Michigan |
7/1/85 |
Primary |
$25 |
Front |
Bus |
Minnesota |
8/1/86 |
Secondary |
$25 |
Front |
Farm pickup truck |
Mississippi |
3/20/90 |
Secondary |
$25 |
Front |
Farm vehicle, bus |
Missouri |
9/28/85 |
Secondary |
$10 |
Front |
Designed for more than 10 people, truck over |
|
|
|
|
|
12,000 lbs. |
Montana |
10/1/87 |
Secondary |
$20 |
All |
None |
Nebraska |
1/1/93 |
Secondary |
$25 |
Front |
Manufactured before 1973 |
Nevada |
7/1/87 |
Secondary |
$25 |
All |
Taxi, bus, school bus |
New Hampshire |
None |
NA |
NA |
NA |
NA |
New Jersey |
3/1/85 |
Secondary |
$20 |
Front |
None |
New Mexico |
1/1/86 |
Primary |
$25 |
Front |
Vehicle over 10,000 lbs. |
New York |
12/1/84 |
Primary |
$50 |
Front |
Bus, school bus, taxi |
North Carolina |
10/1/85 |
Primary |
$25 |
Front |
Designed for more than 10 people |
North Dakota |
7/14/94 |
Secondary |
$20 |
Front |
Designed for more than 10 people |
Ohio |
5/6/86 |
Secondary |
$25 |
Front |
None |
Oklahoma |
2/1/87 |
Primary |
$20 |
Front |
Farm vehicle, truck, truck tractor, RV |
Oregon |
12/7/90 |
Primary |
$75 |
All |
None |
Pennsylvania |
11/23/87 |
Secondary |
$10 |
Front |
Truck over 7,000 lbs. |
Rhode Island |
6/18/91 |
Secondary |
$50 |
All |
None |
South Carolina |
7/1/89 |
Secondary |
$10 |
All |
School bus, public bus |
South Dakota |
1/1/95 |
Secondary |
$20 |
Front |
Bus, school bus |
Tennessee |
4/21/86 |
Secondary |
$50 |
Front |
Vehicle over 8,500 lbs. |
Texas |
9/1/85 |
Primary |
$50 |
Front |
Designed for more than 10 people, truck over |
|
|
|
|
|
15,000 lbs. |
Utah |
4/28/86 |
Secondary |
$45 |
Front |
Vehicle over 10,000 lbs., school/public bus, taxi |
Vermont |
1/1/94 |
Secondary |
$10 |
All |
Bus, taxi |
Virginia |
1/1/88 |
Secondary |
$25 |
Front |
Designed for more than 10 people, taxi |
Washington |
6/11/86 |
Secondary |
$35 |
All |
Designed for more than 10 people |
West Virginia |
9/1/93 |
Secondary |
$25 |
Front |
Designed for more than 10 people |
Wisconsin |
12/1/87 |
Secondary |
$10 |
All |
Taxi, farm truck |
Wyoming |
6/8/89 |
Secondary |
$25 |
Front |
Designed for more than 10 people, bus |
1 Effective date of first belt law in the state; 2 Primary enforcement enables police officers to stop vehicles and write citations whenever they observe a violation of the seat belt law. Secondary enforcement allows police officers to write a citation for seat belt infractions only after stopping a vehicle for some other traffic infraction; 3 Most states exempt vehicles not manufactured with seat belts; 4 Plus 3 points on license; 5 Fine for first offense; 6 Plus 2 points on license; 7 Penalty could include 30 days in jail.
KEY: NA = not applicable; RV = recreational vehicle.
SOURCE: U.S. Department of Transportation, National Highway Traffic Safety Administration, Traffic Safety Facts 2000, Washington, DC: 2001, available at http://www-nrd.nhtsa.dot.gov/pdf/nrd-30/NCSA/TSFAnn/TSF2000.pdf as of Jan. 4, 2002.
BTS State Transportation Profile |
B-3 |
Alaska |
Safety
Table 2-4: Shoulder Belt Use: 2000
State |
Percent |
Alabama |
70.6 |
Alaska |
61.0 |
Arizona |
75.2 |
Arkansas |
52.4 |
California |
88.9 |
Colorado |
65.1 |
Connecticut |
76.3 |
Delaware |
66.1 |
District of Columbia |
82.6 |
Florida |
64.8 |
Georgia |
73.6 |
Hawaii |
80.4 |
Idaho |
58.6 |
Illinois |
70.2 |
Indiana |
62.1 |
Iowa |
78.0 |
Kansas |
61.6 |
Kentucky |
60.0 |
Louisiana |
68.2 |
Maine |
N |
Maryland |
85.0 |
Massachusetts |
50.0 |
Michigan |
83.5 |
Minnesota |
73.4 |
Mississippi |
50.4 |
Missouri |
67.7 |
KEY: N = Data do not exist.
State |
Percent |
Montana |
75.6 |
Nebraska |
70.5 |
Nevada |
78.5 |
New Hampshire |
N |
New Jersey |
74.2 |
New Mexico |
86.6 |
New York |
77.3 |
North Carolina |
80.5 |
North Dakota |
47.7 |
Ohio |
65.3 |
Oklahoma |
67.5 |
Oregon |
83.6 |
Pennsylvania |
70.7 |
Rhode Island |
64.4 |
South Carolina |
73.9 |
South Dakota |
53.4 |
Tennessee |
59.0 |
Texas |
76.6 |
Utah |
75.7 |
Vermont |
61.6 |
Virginia |
69.6 |
Washington |
81.6 |
West Virginia |
49.5 |
Wisconsin |
65.4 |
Wyoming |
66.8 |
|
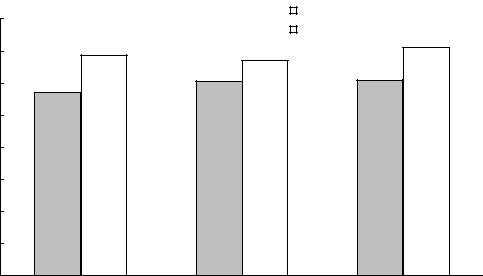
Figure 2-1: Shoulder Belt Use |
||
80.0 Percent |
|
|
Alaska |
|
|
||
|
|
||
|
|
|
United States |
71.0 |
|
68.7 |
67.0 |
|
|
70.0 |
|
|
||
|
|
|
||
|
57.0 |
60.6 |
|
61.0 |
60.0 |
|
|
|
|
50.0 |
|
|
|
|
40.0 |
|
|
|
|
30.0 |
|
|
|
|
20.0 |
|
|
|
|
10.0 |
|
|
|
|
0.0 |
|
|
|
|
|
1998 |
1999 |
|
2000 |
SOURCE FOR DATA ON THIS PAGE:U.S. Department of Transportation, National Highway Traffic Safety Administration, 1998-2000 State Shoulder Belt Use Survey Results , Research Note, Washington, DC: May 2001, available at http://www-nrd.nhtsa.dot.gov/departments/nrd-30/ncsa/availinf.html as of March 20, 2002.
Alaska |
B-4 |
BTS State Transportation Profile |