

СТАТИСТИКА 1 / Министерство транспорта США / Alaska Transportation Statistics 2008
.pdfFreight
Table 3-16: U.S. Waterborne Exports by State and Vessel Type: 1999 (Thousands of metric tons) (Descending order by weight)
|
|
|
Vessel type |
|
|
|
|
|
Dry-bulk |
Full |
Other |
Cargo loaded in |
Total |
Tanker |
carrier |
container |
freighter1 |
Louisiana |
97,093 |
9,842 |
77,773 |
3,669 |
5,809 |
Texas |
50,331 |
23,279 |
18,917 |
4,769 |
3,366 |
California |
34,585 |
4,778 |
11,074 |
17,011 |
1,722 |
Washington |
30,810 |
2,459 |
19,189 |
6,897 |
2,265 |
Virginia |
27,374 |
269 |
22,106 |
4,018 |
981 |
Florida |
17,797 |
692 |
9,332 |
2,773 |
5,000 |
Ohio |
12,936 |
74 |
12,505 |
130 |
227 |
Oregon |
12,712 |
501 |
8,535 |
2,181 |
1,495 |
Alaska |
10,122 |
5,794 |
3,300 |
319 |
709 |
New York |
9,644 |
508 |
2,992 |
5,476 |
668 |
Michigan |
8,392 |
190 |
7,673 |
348 |
181 |
Maryland |
7,834 |
129 |
6,257 |
734 |
714 |
Alabama |
7,724 |
126 |
4,656 |
366 |
2,576 |
Wisconsin |
7,492 |
117 |
7,007 |
142 |
226 |
Georgia |
6,291 |
173 |
1,323 |
3,246 |
1,549 |
South Carolina |
5,929 |
39 |
222 |
5,157 |
511 |
Minnesota |
3,994 |
45 |
3,721 |
125 |
103 |
North Carolina |
2,614 |
305 |
1,212 |
323 |
774 |
Mississippi |
2,456 |
421 |
1,095 |
329 |
611 |
Puerto Rico |
1,054 |
593 |
33 |
238 |
190 |
Virgin Islands |
772 |
699 |
35 |
14 |
24 |
Illinois |
624 |
1 |
521 |
90 |
12 |
Pennsylvania |
616 |
89 |
116 |
276 |
135 |
Massachusetts |
576 |
19 |
226 |
297 |
34 |
Hawaii |
509 |
328 |
63 |
57 |
61 |
Delaware |
513 |
17 |
173 |
189 |
134 |
Maine |
329 |
57 |
61 |
44 |
167 |
New Jersey |
285 |
113 |
63 |
47 |
62 |
Connecticut |
126 |
8 |
81 |
19 |
18 |
Rhode Island |
111 |
9 |
98 |
2 |
2 |
New Hampshire |
23.6 |
20 |
0.6 |
1 |
2 |
Indiana |
18.7 |
0.3 |
18 |
0.2 |
0.2 |
District of Columbia |
0.01 |
0 |
0 |
0.01 |
0 |
United States, total |
361,687 |
51,694 |
220,378 |
59,287 |
30,328 |
1 Roll-on/roll-off, breakbulk ships, partial containerships, refrigerated cargo ships, barge carriers, and specialized cargo ships.
SOURCE: U.S. Department of Transportation, Maritime Administration, personal communication, May 29, 2002.
BTS State Transportation Profile |
C-13 |
Alaska |

Freight
Table 3-17: Scheduled and Nonscheduled Air Freight and
Enplaned: 2000 (Short tons)
|
Freight |
|
|
||
State |
Scheduled |
Nonscheduled |
Scheduled |
Nonscheduled |
|
Alabama |
17,233 |
139,250 |
|
6,796 |
25 |
Alaska |
467,057 |
141,482 |
|
52,354 |
10,232 |
Arizona |
70,430 |
66,143 |
|
36,115 |
27,465 |
Arkansas |
1,886 |
12,578 |
|
6,534 |
2,955 |
California |
1,176,476 |
504,757 |
|
237,537 |
87,278 |
Colorado |
106,816 |
61,503 |
|
55,370 |
31,711 |
Connecticut |
14,802 |
54,627 |
|
10,260 |
1,575 |
Delaware |
0 |
3,251 |
|
0 |
0 |
District of Columbia |
92,526 |
6,208 |
|
46,511 |
6,615 |
Florida |
461,831 |
334,177 |
|
85,818 |
14,182 |
Georgia |
204,986 |
66,293 |
|
116,174 |
3,961 |
Hawaii |
208,048 |
52,473 |
|
33,768 |
476 |
Idaho |
11,231 |
5,064 |
|
3,065 |
1,307 |
Illinois |
318,957 |
202,867 |
|
112,959 |
9,111 |
Indiana |
408,262 |
85,326 |
|
24,814 |
134,145 |
Iowa |
15,346 |
53,766 |
|
7,429 |
3,984 |
Kansas |
6,200 |
20,199 |
|
2,597 |
18 |
Kentucky |
16,427 |
823,924 |
|
5,093 |
0 |
Louisiana |
29,577 |
21,753 |
|
11,399 |
1,758 |
Maine |
8,428 |
11,368 |
|
185 |
91 |
Maryland |
25,723 |
24,781 |
|
19,850 |
3,573 |
Massachusetts |
114,243 |
422,158 |
|
31,133 |
9,384 |
Michigan |
87,127 |
68,108 |
|
41,678 |
4,848 |
Minnesota |
85,691 |
51,285 |
|
59,550 |
9,192 |
Mississippi |
398 |
11,338 |
|
2,198 |
0 |
Missouri |
71,317 |
67,157 |
|
67,876 |
4,120 |
Montana |
16,261 |
7,917 |
|
1,987 |
3,341 |
Nebraska |
12,188 |
26,366 |
|
10,825 |
6,546 |
Nevada |
45,636 |
12,641 |
|
30,407 |
1,373 |
New Hampshire |
17,995 |
30,439 |
|
740 |
11 |
New Jersey |
352,556 |
115,712 |
|
54,837 |
4,550 |
New Mexico |
12,845 |
29,355 |
|
9,327 |
3,379 |
New York |
317,258 |
167,388 |
|
113,892 |
5,622 |
North Carolina |
85,996 |
85,765 |
|
35,985 |
3,498 |
North Dakota |
5,424 |
383 |
|
222 |
2,820 |
Ohio |
283,292 |
292,529 |
|
48,750 |
6,442 |
Oklahoma |
25,773 |
16,804 |
|
9,022 |
9 |
Oregon |
73,035 |
59,101 |
|
12,655 |
22,729 |
Pennsylvania |
156,043 |
312,359 |
|
45,377 |
9,035 |
Puerto Rico |
78,117 |
44,530 |
|
4,319 |
3,312 |
Rhode Island |
3,883 |
2,753 |
|
2,543 |
0 |
South Carolina |
17,237 |
76,688 |
|
3,234 |
6 |
South Dakota |
8,114 |
12,298 |
|
1,040 |
4,583 |
Tennessee |
1,324,829 |
60,779 |
|
31,342 |
6,417 |
Texas |
440,864 |
482,724 |
|
138,548 |
47,644 |
Utah |
66,549 |
133,609 |
|
30,908 |
25,073 |
Vermont |
3,257 |
19 |
|
122 |
0 |
Virginia |
20,961 |
35,881 |
|
5,189 |
3,492 |
Washington |
152,299 |
84,367 |
|
34,449 |
55,975 |
West Virginia |
4,306 |
128 |
|
4 |
0 |
Wisconsin |
30,060 |
19,618 |
|
11,558 |
1,088 |
Wyoming |
6,786 |
11 |
|
5 |
0 |
United States, total |
7,582,577 |
5,422,002 |
|
1,714,348 |
584,950 |
SOURCE: U.S. Department of Transportation, Bureau of Transportation Statistics, Airport Activity Statistics of Certificated Air Carriers: Summary Tables, Twelve Months Ending December 31, 2000, Washington, DC: 2001, available at www.bts.gov/publications/airactstats2000/ as of Oct. 29, 2001.
Alaska |
C-14 |
BTS State Transportation Profile |
Freight
Table 3-18: Surface Merchandise Trade with Canada and Mexico: 2000 (Millions of current dollars)
|
Exports to |
|
Imports from |
|||
|
Canada |
Mexico |
|
Canada |
Mexico |
|
Alaska |
58 |
10 |
|
128 |
4 |
|
United States, total |
154,847 |
97,159 |
210,270 |
113,437 |
|
|
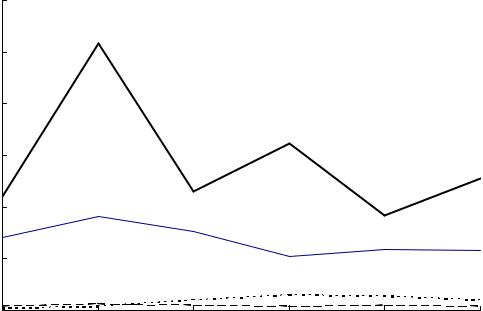
Figure 3-1: Alaska Surface Merchandise Trade with
Canada and Mexico (Millions of current dollars)
300 |
|
|
|
|
|
250 |
|
Imports from Canada |
|
|
|
200 |
|
|
|
|
|
150 |
|
|
|
|
|
100 |
Exports to Canada |
|
|
|
|
50 |
|
|
|
|
|
Imports from Mexico |
|
Exports to Mexico |
|
||
|
|
|
|
||
0 |
|
|
|
|
|
1995 |
1996 |
1997 |
1998 |
1999 |
2000 |
SOURCE FOR DATA ON THIS PAGE: U.S. Department of Transportation, Bureau of
Transportation Statistics, Transborder Surface Freight Data , available at
http://www.bts.gov/ntda/tbscd/reports.html as of Aug.9, 2002.
BTS State Transportation Profile |
C-15 |
Alaska |
Freight
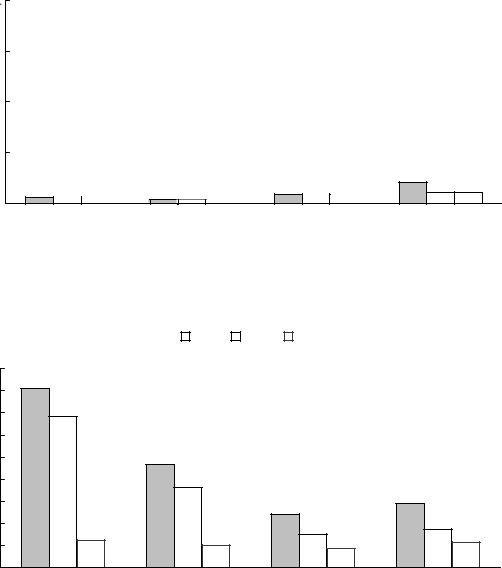
Figure 3-2: Truck and Rail Imports from Mexico to Alaska by Weight

 Total
Total 
 Truck
Truck 
 Rail
Rail
Thousands of metric tons
100
75
50
25
|
|
|
|
|
|
|
|
10 |
|
3 |
3 |
|
2 |
2 |
|
4 |
4 |
5 |
5 |
0 |
0 |
|
|
0 |
|
||||
0 |
|
|
|
|
|
|
|||
|
|
|
|
|
|
|
|
|
|
|
1997 |
|
|
1998 |
|
|
1999 |
2000 |
|
Figure 3-3: Truck and Rail Imports from Canada to Alaska by Weight
Thousands of metric tons |
|
Total Truck Rail |
|
||
|
||
|
|
225 |
202 |
|
|
|
|
200 |
|
|
|
|
|
171 |
|
|
|
|
|
175 |
|
|
|
|
|
|
|
|
|
|
|
150 |
|
|
|
|
|
125 |
|
116 |
|
|
|
|
|
|
|
|
|
100 |
|
90 |
|
|
72 |
75 |
|
|
60 |
|
|
|
|
|
|
||
50 |
31 |
|
38 |
|
43 |
|
|
29 |
|||
25 |
|
26 |
22 |
||
|
|
|
|
||
|
|
|
|
|
|
0 |
|
|
|
|
|
|
1997 |
1998 |
1999 |
|
2000 |
NOTES FOR DATA ON THIS PAGE: Data do not include transshipment activity. Transshipments are shipments that enter or exit the United States by way of a U.S. Customs port on the northern or southern border, but whose origin or destination is a country other than Canada or Mexico. All figures are based on the declared gross shipment weight and include packaging. Shipping weight for imports may be underestimated because U.S. Customs Service does not require weight to be reported at the individual commodity level for surface trade.
SOURCE FOR DATA ON THIS PAGE: U.S. Department of Transportation, Bureau of Transportation Statistics, Transborder Surface Freight Data, available at http://www.bts.gov/ntda/tbscd/reports as of Oct. 31, 2001.
Alaska |
C-16 |
BTS State Transportation Profile |

Freight
Table 3-19: Incoming Truck Crossings, U.S.-Canadian Border (Thousands)
State/port |
1995 |
1996 |
1997 |
1998 |
1999 |
2000 |
Alaska |
12 |
19 |
12 |
11 |
10 |
11 |
Alcan |
4 |
5 |
5 |
7 |
6 |
8 |
Dalton Cache |
2 |
1 |
1 |
1 |
1 |
<1 |
Skagway |
6 |
13 |
5 |
3 |
2 |
2 |
Idaho |
47 |
51 |
52 |
52 |
59 |
59 |
Maine |
363 |
396 |
405 |
445 |
497 |
536 |
Michigan |
1,881 |
2,032 |
2,186 |
2,348 |
2,620 |
2,676 |
Minnesota |
136 |
121 |
143 |
115 |
119 |
130 |
Montana |
133 |
148 |
157 |
166 |
183 |
206 |
New York |
1,505 |
1,555 |
1,662 |
1,797 |
1,955 |
1,983 |
North Dakota |
258 |
271 |
301 |
307 |
325 |
345 |
Vermont |
241 |
240 |
254 |
281 |
313 |
325 |
Washington |
559 |
597 |
655 |
748 |
736 |
778 |
United States, total |
5,135 |
5,431 |
5,827 |
6,271 |
6,817 |
7,048 |
NOTE: Data represent the number of truck crossings, not the number of unique vehicles, and include both loaded and unloaded trucks.
Table 3-20: Incoming Truck Container (Loaded) Crossings, U.S.-Canadian Border (Thousands)
State/port |
1995 |
1996 |
1997 |
1998 |
1999 |
2000 |
Alaska |
U |
U |
<1 |
8 |
7 |
7 |
Alcan |
U |
U |
<1 |
5 |
5 |
6 |
Dalton Cache |
U |
U |
<1 |
<1 |
<1 |
<1 |
Skagway |
U |
U |
U |
2 |
1 |
1 |
Idaho |
U |
45 |
42 |
42 |
47 |
51 |
Maine |
U |
164 |
222 |
332 |
343 |
344 |
Michigan |
U |
656 |
899 |
1,982 |
2,186 |
2,069 |
Minnesota |
U |
31 |
37 |
77 |
83 |
100 |
Montana |
U |
121 |
137 |
147 |
165 |
170 |
New York |
U |
1 |
145 |
805 |
1,544 |
1,708 |
North Dakota |
U |
74 |
<1 |
138 |
268 |
305 |
Vermont |
U |
94 |
116 |
148 |
171 |
217 |
Washington |
U |
235 |
367 |
552 |
517 |
363 |
United States, total |
U |
1,421 |
1,966 |
4,232 |
5,331 |
5,335 |
Table 3-21: Incoming Truck Container (Unloaded) Crossings, U.S.-Canadian Border |
||||||
(Thousands) |
|
|
|
|
|
|
State/port |
1995 |
1996 |
1997 |
1998 |
1999 |
2000 |
Alaska |
U |
U |
<1 |
3 |
3 |
2 |
Alcan |
U |
U |
<1 |
<1 |
<1 |
<1 |
Dalton Cache |
U |
U |
<1 |
<1 |
<1 |
<1 |
Skagway |
U |
U |
U |
2 |
2 |
1 |
Idaho |
U |
<1 |
<1 |
2 |
2 |
2 |
Maine |
U |
44 |
48 |
59 |
52 |
50 |
Michigan |
U |
75 |
130 |
274 |
335 |
402 |
Minnesota |
U |
14 |
17 |
30 |
32 |
31 |
Montana |
U |
18 |
19 |
22 |
19 |
28 |
New York |
U |
<1 |
22 |
99 |
191 |
202 |
North Dakota |
U |
10 |
<1 |
26 |
38 |
36 |
Vermont |
U |
10 |
11 |
7 |
6 |
9 |
Washington |
U |
62 |
110 |
163 |
174 |
134 |
United States, total |
U |
235 |
358 |
685 |
852 |
897 |
KEY: U = data are unavailable.
SOURCE FOR DATA ON THIS PAGE: U.S. Department of Transportation, Bureau of Transportation Statistics, special tabulation, April 2002. Based on the following primary data source: U.S. Department of Treasury, U.S. Customs Service, Office of Field Operations, Operations Management Database, special tabulation, Washington, DC: 2001.
BTS State Transportation Profile |
C-17 |
Alaska |
Freight
Table 3-22: Incoming Train Crossings, U.S.-Canadian Border
State/port |
1995 |
1996 |
1997 |
1998 |
1999 |
2000 |
Alaska |
227 |
234 |
259 |
277 |
266 |
326 |
Alcan |
NA |
NA |
NA |
NA |
NA |
NA |
Dalton Cache |
NA |
NA |
NA |
NA |
NA |
NA |
Skagway |
227 |
234 |
259 |
277 |
266 |
326 |
Idaho |
506 |
443 |
482 |
577 |
673 |
699 |
Maine |
1,201 |
1,357 |
1,380 |
1,698 |
1,653 |
1,428 |
Michigan |
7,576 |
8,654 |
9,278 |
9,224 |
8,993 |
9,757 |
Minnesota |
10,052 |
9,451 |
9,754 |
11,351 |
9,207 |
9,162 |
Montana |
366 |
340 |
348 |
373 |
392 |
471 |
New York |
5,274 |
5,134 |
5,418 |
5,837 |
5,961 |
5,725 |
North Dakota |
1,268 |
1,283 |
1,406 |
1,621 |
1,596 |
1,728 |
Vermont |
1,427 |
1,316 |
1,410 |
1,287 |
1,238 |
1,119 |
Washington |
3,124 |
3,245 |
3,128 |
3,190 |
2,951 |
3,032 |
United States, total |
31,021 |
31,457 |
32,863 |
35,435 |
32,930 |
33,447 |
Table 3-23: Incoming Rail Container (Full) Crossings, U.S.-Canadian Border |
|
|||||
|
|
|
|
|
|
|
State/port |
1995 |
1996 |
1997 |
1998 |
1999 |
2000 |
Alaska |
NA |
NA |
NA |
NA |
NA |
NA |
Alcan |
NA |
NA |
NA |
NA |
NA |
NA |
Dalton Cache |
NA |
NA |
NA |
NA |
NA |
NA |
Skagway |
NA |
NA |
NA |
NA |
NA |
NA |
Idaho |
U |
24,912 |
27,371 |
33,623 |
39,872 |
47,263 |
Maine |
U |
9,917 |
11,496 |
23,324 |
31,210 |
28,139 |
Michigan |
U |
197,196 |
269,954 |
433,779 |
459,213 |
528,096 |
Minnesota |
U |
20,940 |
44,891 |
175,229 |
210,011 |
204,386 |
Montana |
U |
18,195 |
18,596 |
17,824 |
17,595 |
15,964 |
New York |
U |
U |
17,931 |
105,854 |
190,227 |
192,614 |
North Dakota |
U |
U |
U |
20,087 |
102,225 |
112,462 |
Vermont |
U |
15,408 |
21,396 |
33,122 |
34,857 |
37,745 |
Washington |
U |
43,415 |
52,446 |
60,742 |
65,726 |
48,770 |
United States, total |
U |
329,983 |
464,081 |
903,584 |
1,150,936 |
1,215,439 |
Table 3-24: Incoming Rail Containers (Empty) Crossings, U.S.-Canadian Border |
||||||
|
|
|
|
|
|
|
State/port |
1995 |
1996 |
1997 |
1998 |
1999 |
2000 |
Alaska |
NA |
NA |
NA |
NA |
NA |
NA |
Alcan |
NA |
NA |
NA |
NA |
NA |
NA |
Dalton Cache |
NA |
NA |
NA |
NA |
NA |
NA |
Skagway |
NA |
NA |
NA |
NA |
NA |
NA |
Idaho |
U |
2,095 |
2,295 |
3,956 |
2,464 |
2,977 |
Maine |
U |
16,902 |
17,293 |
23,558 |
35,738 |
32,219 |
Michigan |
U |
75,756 |
116,426 |
153,538 |
140,390 |
151,651 |
Minnesota |
U |
3,553 |
8,283 |
40,670 |
45,482 |
46,557 |
Montana |
U |
5,095 |
7,323 |
5,905 |
5,737 |
9,291 |
New York |
U |
U |
5,331 |
34,568 |
43,950 |
64,541 |
North Dakota |
U |
U |
U |
6,595 |
36,818 |
42,236 |
Vermont |
U |
5,372 |
5,554 |
10,429 |
11,385 |
13,324 |
Washington |
U |
15,234 |
17,910 |
22,086 |
15,603 |
16,602 |
United States, total |
U |
124,007 |
180,415 |
301,305 |
337,567 |
379,398 |
KEY: NA = not applicable; U = data are unavailable.
SOURCE FOR DATA ON THIS PAGE: U.S. Department of Transportation, Bureau of Transportation Statistics, special tabulation, April 2002. Based on the following primary data source: U.S. Department of Treasury, U.S. Customs Service, Office of Field Operations, Operations Management Database, special tabulation, Washington, DC: 2001.
Alaska |
C-18 |
BTS State Transportation Profile |

Freight
Table 3-25: Top 50 U.S. Foreign Trade Freight Gateways: 2000 (Ranked by value of shipments in $ billions)
|
Mode |
U.S. rank |
Exports |
Imports |
Total |
Alaska gateways1 in top 50 |
|
|
|
|
|
Anchorage, AK |
Air |
21 |
3.5 |
19.7 |
23.2 |
U.S. gateways1 in top 50 |
|
|
|
|
|
JFK International Airport, NY |
Air |
1 |
56.0 |
75.5 |
131.6 |
Port of Los Angeles, CA |
Water |
2 |
16.7 |
85.1 |
101.8 |
Port of Long Beach, CA |
Water |
3 |
16.9 |
81.3 |
98.2 |
Port of Detroit, MI |
Land |
4 |
49.5 |
44.9 |
94.4 |
San Francisco Airport, CA |
Air |
5 |
41.8 |
46.9 |
88.7 |
Port of Laredo, TX |
Land |
6 |
39.2 |
44.4 |
83.7 |
Port of New York, NY and NJ |
Water |
7 |
19.7 |
61.2 |
80.9 |
Los Angeles International Airport, CA |
Air |
8 |
41.7 |
35.6 |
77.3 |
Port of Buffalo-Niagra Falls, NY |
Land |
9 |
36.2 |
33.9 |
70.1 |
Port of Huron, MI |
Land |
10 |
18.8 |
40.9 |
59.7 |
Chicago, IL |
Air |
11 |
20.4 |
25.4 |
45.7 |
Port of Houston, TX |
Water |
12 |
18.7 |
24.6 |
43.4 |
Port of El Paso, TX |
Land |
13 |
17.5 |
21.9 |
39.4 |
Port of Seattle, WA |
Water |
14 |
5.4 |
26.9 |
32.3 |
New Orleans, LA |
Air |
15 |
16.2 |
15.9 |
32.0 |
Port of Charleston, SC |
Water |
16 |
11.3 |
20.2 |
31.5 |
Port of Norfolk Harbor, VA |
Water |
17 |
11.1 |
14.1 |
25.2 |
Port of Oakland, CA |
Water |
18 |
9.6 |
15.5 |
25.1 |
Cleveland, OH |
Air |
19 |
11.8 |
12.7 |
24.5 |
Miami International Airport, FL |
Air |
20 |
15.9 |
7.7 |
23.6 |
Anchorage, AK |
Air |
21 |
3.5 |
19.7 |
23.2 |
Port of Baltimore, MD |
Water |
22 |
5.3 |
15.3 |
20.6 |
Dallas-Fort Worth, TX |
Air |
23 |
10.1 |
10.2 |
20.4 |
Port of Tacoma, WA |
Water |
24 |
4.4 |
15.5 |
19.8 |
Port of Otay Mesa, TX |
Land |
25 |
8.1 |
10.7 |
18.8 |
Port of New Orleans, LA |
Water |
26 |
7.6 |
11.2 |
18.8 |
Port of Miami, FL |
Water |
27 |
8.4 |
9.1 |
17.5 |
Port of Champlain-Rouses Pt., NY |
Land |
28 |
6.0 |
11.3 |
17.3 |
Atlanta, GA |
Air |
29 |
8.4 |
8.7 |
17.2 |
Port of Savannah, GA |
Water |
30 |
5.9 |
10.5 |
16.3 |
Port of Nogales, AZ |
Land |
31 |
5.3 |
8.3 |
13.6 |
Port of Hildago, TX |
Land |
32 |
6.2 |
6.4 |
12.6 |
Port of Blaine, WA |
Land |
33 |
5.6 |
6.7 |
12.3 |
Port of Brownsville-Cameron, TX |
Land |
34 |
6.2 |
5.9 |
12.1 |
Port of Alexandria Bay, NY |
Land |
35 |
4.6 |
7.4 |
12.0 |
Port of South Louisiana, LA |
Water |
36 |
7.1 |
4.0 |
11.1 |
Port of Beaumont, TX |
Water |
37 |
1.0 |
9.6 |
10.6 |
Newark, NJ |
Air |
38 |
3.9 |
6.7 |
10.6 |
Port of Pembina, ND |
Land |
39 |
5.3 |
5.2 |
10.6 |
Port of Port Everglades, FL |
Water |
40 |
4.7 |
5.8 |
10.5 |
Port of Portland, OR |
Water |
41 |
3.0 |
7.5 |
10.5 |
Port of Corpus Christi, TX |
Water |
42 |
1.6 |
8.7 |
10.3 |
Port of Jacksonville, FL |
Water |
43 |
1.9 |
8.4 |
10.3 |
Boston Logan Airport, MA |
Air |
44 |
5.9 |
4.4 |
10.0 |
Port of Philadelphia, PA |
Water |
45 |
0.5 |
9.5 |
10.0 |
Port of Morgan City, LA |
Water |
46 |
0.1 |
9.3 |
9.4 |
Seattle-Tacoma International Airport, WA |
Air |
47 |
3.7 |
4.8 |
8.5 |
Port of Calexico-East, TX |
Land |
48 |
3.5 |
4.8 |
8.3 |
Port of Sweetgrass, MT |
Land |
49 |
3.4 |
4.4 |
7.8 |
Port of Highgate Springs-Alburg, VT |
Land |
50 |
3.0 |
4.6 |
7.6 |
Total, top 50 |
NA |
NA |
619 |
989 |
1,608 |
1Gateway means any port, airport, or border crossing that provides access for the import or export of goods.
KEY: NA = not applicable.
NOTES: Mode of transportation is the type of transportation as a shipment enters or exits at a border port. Flows through individual ports are based on reported data collected from U.S. trade documents. Low-value shipments, generally imports valued at less than $1,250 and exports valued at less than $2,500, are not included. Data for air gateways include some shipments (generally less than 3% of the total value) from small user-fee airports located in the same region. Air gateways not identified by airport name include major airport(s) in that geographic area in addition to small regional airports. In addition, due to Bureau of Census confidentiality regulations, data for courier operations are included in the airport totals for JFK International Airport, New Orleans, Los Angeles, Cleveland, Chicago, Miami, and Anchorage.
SOURCES:
Air: U.S. Department of Commerce, U.S. Census Bureau, Foreign Trade Division, special tabulation, August 2001. Water: U.S. Department of Transportation, Maritime Administration, Office of Statistical and Economical Analysis, personal communication, Sept. 5, 2001.
Land: U.S. Department of Transportation, Bureau of Transportation Statistics, Transborder Surface Freight Data, 2001.
BTS State Transportation Profile |
C-19 |
Alaska |
C-20
D Passenger Travel