

Dale_Molecular Genetics of Bacteria 4th ed
.pdfGENE MAPPING TO GENOMICS |
277 |
to the right of B. If A and B are close together, it is unlikely that the second crossover would occur in the short region between them, so both markers will be incorporated together (co-transformation). The further apart the two markers are, the more likely it is that the second crossover will happen in the intervening region and hence the frequency of co-transformation will be lower.
Generalized transduction (see Chapter 6) can be used in a similar way and provides a powerful tool for the short range mapping of the position of genes on the bacterial chromosome. As an example, if the phage P1 is grown on a prototrophic E. coli strain, the phage preparation can be used to infect cells of a recipient strain which is auxotrophic for threonine and proline. Plating these cells on a medium that contains threonine (but not proline) will detect transductants that have received the pro gene from the donor by transduction. These cells can then be tested for their ability to grow in the absence of threonine, i.e. whether they have also received the thr gene. A high degree of co-transduction indicates closely linked genes.
10.1.3 Molecular techniques for gene mapping
Gene libraries
Gene cloning techniques provide a powerful alternative to the classical gene mapping techniques described above. Since each clone in a genomic library (Chapter 8) carries a limited amount of DNA, it can be used to identify two genes that are close together on the chromosome, for example by testing the ability to complement two mutations simultaneously – essentially by a co-transformation test.
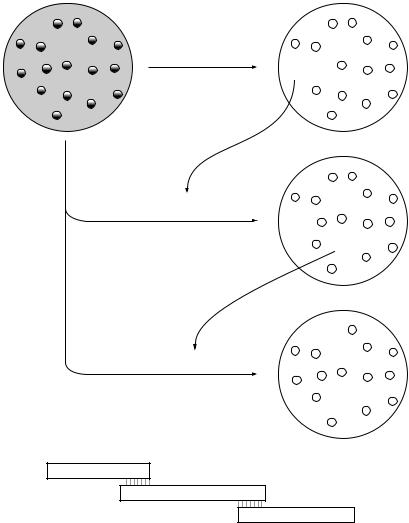
More commonly, the relative position of genes in a library would be determined by hybridization. If a clone that contains the first gene is selected using a specific probe (probe 1 in Figure 10.4), the insert from that clone can be used as a probe to identify a second clone that contains an overlapping portion of the genome. This second clone can in turn be used as a probe to identify a further overlapping clone and so on until a clone containing the second gene of interest is selected. This procedure, known as chromosome walking, can either be used to map the position of two known genes or conversely to clone an unknown gene that is known to be close to an identified marker.
An extension of this procedure can be used to obtain a complete set of overlapping clones that are arranged in the order they appear in the chromosome. This is known as an ordered library. Constructing an ordered library can involve a significant amount of work, but once established it is a valuable resource. Some of the genome sequencing projects (see below) have made good use of ordered gene libraries.
278 |
MOLECULAR GENETICS OF BACTERIA |
Genomic
library
Probe 1
 1
1 
Probe 2
 1
1
 2
2
3 
Probe 3
 2
2
Ordered clones
Clone 1
Clone 2
Clone 3
Figure 10.4 Chromosome walking and construction of an ordered library. Clone 1, identified by probing a genomic library with probe 1, is used to generate probe 2 for rescreening the library. This identifies an overlapping clone (clone 2), which is in turn used to identify clone 3 and so on
Restriction mapping and pulsed-field gel electrophoresis
It is possible to determine the position of restriction sites on a DNA fragment by digesting it with various restriction enzymes, singly and in combination, and analysing the fragment sizes obtained.
GENE MAPPING TO GENOMICS |
279 |
Restriction mapping used to be a key procedure for characterizing a cloned fragment of DNA, but this is now more easily achieved with DNA sequencing. Nevertheless, analysis of restriction sites (or fragment sizes) is still useful, for example in comparing the chromosomal organization of different strains. However, cutting the total bacterial DNA with most restriction enzymes results in such a large number of fragments that they cannot easily be resolved by conventional gel electrophoresis and usually appear as a smear. In Chapter 9 the use of Southern blotting with specific probes for RFLP strain typing was discussed. One alternative is to use enzymes that cut less often, such as NotI or PacI (which both have 8 bp recognition sites, rather than the 6- or 4-bp sites required by more commonly used restriction enzymes) and are therefore likely to yield a relatively small number of very large fragments.
However, linear DNA fragments above a certain size (commonly about 20 kb, but varying according to the conditions) are not separated on a conventional agarose gel. The fragments do move through the gel but in a size-independent manner. This can be visualized as the large DNA molecules migrating end on; once they are lined up, their length is immaterial. This is in contrast to smaller fragments where the random configuration is small enough to pass through the pores of the gel.
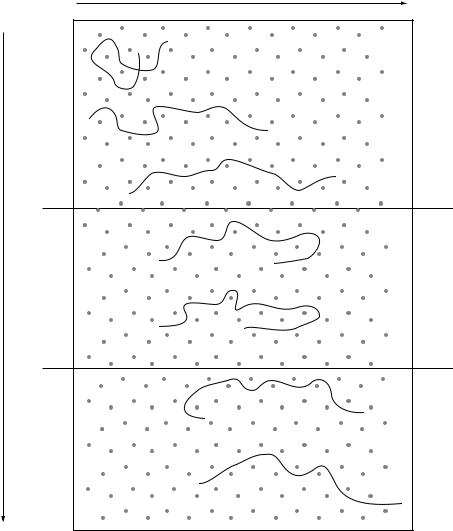
These larger fragments can however be separated by periodically changing the direction of the electric field (Figure 10.5). All of the fragments actually move at the same speed through the gel, but when the direction of the field changes they have to re-orientate themselves in the new direction. The larger the molecule, the longer this takes. The overall effect therefore is that the larger molecules are found nearer to the origin of the gel.
This technique is generally referred to as Pulsed Field Gel Electrophoresis (PFGE). There are several variants of this technique. The simplest, but rather limited, method is Field Inversion Gel Electrophoresis (FIGE) which uses a conventional electrophoresis tank with short pulses of reversed polarity of the electrodes. More powerful techniques rely on complex arrangements of electrodes; one of the most widely used systems is known as Contour-clamped Homogeneous Electric Field Gel Electrophoresis (CHEF) which uses an hexagonal array of electrodes with the field intensity and direction being controlled so as to generate an homogeneous electric field, thus ensuring that the DNA molecules migrate in a straight line.
10.2 Gene sequencing
One of the key aims of molecular biology is to understand the structure of DNA and how the information held within it is translated into the complex workings of a cell. Obviously, this task is only feasible if the exact sequence of the bases in DNA can be determined. In 1977, Fred Sanger developed an enzymatic chain
280 |
MOLECULAR GENETICS OF BACTERIA |
|
Net direction of migration |
Stages |
|
a |
- |
b -
c -
Reversal of field
d |
+ |
e |
+ |
Reversal of field
f -
g -
+
+
+
-
-
+
+
Figure 10.5 The principle of pulsed field gel electrophoresis (PFGE). The DNA molecule is too large to migrate through the gel in its initial state (a). Under the influence of an electric field, it gradually orientates itself (b, c) so that it can move, end on. When the direction of the field changes briefly (d), it becomes tangled again (e). Before it has completed re-orientation, the field changes again (f) and the molecule has to resume its linear form before it can start moving from left to right again (g). Once the molecule is orientated, its mobility is essentially independent of size; the main determinant of mobility (at given pulse conditions) will be how quickly it can re-orientate itself, which is a function of its length
GENE MAPPING TO GENOMICS |
281 |
termination procedure that made this possible and for the first time the sequence of strands of DNA could be deciphered.
10. 2.1 DNA sequence determination
The method that Sanger developed involves in vitro DNA synthesis with DNA polymerase and the use of 20,30-dideoxynucleotides. These lack the 30 OH group, so their incorporation into a growing DNA strand will stop the synthesis of the strand at that point, since there is nothing to attach the next residue to.
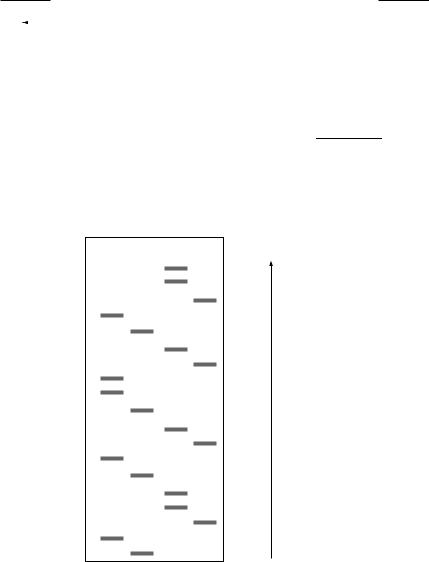
Synthesis of the new strand is initiated from a specific position by using a primer that hybridizes to a position adjacent to the 30-end of the region to be sequenced (Figure 10.6). If the reaction is supplied with each of the four deoxynucleotide triphosphates plus, say, dideoxy ATP (ddATP), then at each point when an A residue should be added there is a chance of incorporating ddA instead. This will lead to a mixture of DNA chains each of which terminates at an A residue. Since these will be different in size, they can be separated on an acrylamide gel, thus indicating the position of each of the A residues. Similar reactions, carried out in parallel with each of the four dideoxy derivatives, lead to a gel with a pattern of bands as shown in Figure 10.6, from which the sequence can be read. Several hundred bases can be read from a single gel.
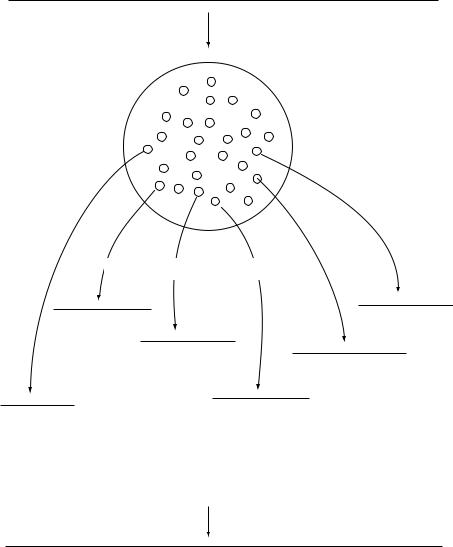
For obtaining longer sequences, a common strategy is to cut the DNA into random, overlapping, fragments and to clone and sequence each fragment (Figure 10.7). As each new fragment is sequenced, a computer is used to compare the sequence to all the previous ones. When an overlap is found, the computer joins the two sequences together to form a contig. As more sequences are determined, the contigs become larger and will overlap other contigs; the overlapping contigs are joined to form an even larger contig. Eventually, the process forms a single contig, covering the whole gene.
The development of gene sequencing also provided a route for deriving the sequence of a protein by using a computer to produce the sequence of the translated product. Before this, determining protein sequences was an expensive and arduous task. This technique almost put the protein biochemists out of work, as it was now much easier to sequence the gene than to sequence the protein. However, with manual DNA sequencing, as described above, it could still take several years to clone and sequence an individual gene. When Leroy Hood in 1986 developed a semi-automated device for DNA sequencing, commercial machines soon followed. This opened the way for larger scale sequencing projects, including sequencing complete genomes of independently living organisms such as bacteria and eventually humans.
282 |
|
MOLECULAR GENETICS OF BACTERIA |
|
|
|
|||||
5 |
|
|
GGATCGATTCGATCGGATC |
|
|
|
|
|
|
3 |
|
|
|
|
|
|
|
||||
|
|
|
|
|
|
|
|
|
|
|
|
|
|
CCTAGCTAAGCTAGCCTAG |
|
|
|
|
|
5 |
|
|
|
|
Synthesis of complementary strand |
Primer |
||||||
In the presence of dATP and ddATP, a mixture of fragments will be generated due to termination by ddATP:
AGCTAAGCTAGCCTAG 
 5
5
AAGCTAGCCTAG 
 5
5
AGCTAGCCTAG 
 5
5
AGCCTAG 
 5
5
AG 
 5
5
Similar reactions are carried out with ddGTP, ddCTP and ddTTP The fragments from the four reactions are separated on an acrylamide gel and detected by autoradiography
A G C T
C
C
T
A
G
C
T
A
A
G
C
T
A
G
C
C
T
A
G
Read in this direction (5 to 3 )
Figure 10.6 Determination of DNA sequence
10. 2. 2 Genome sequencing
The first DNA genome to be sequenced was that of the bacteriophage fX174 (5.4 kb). The sequences of other viruses, including bacteriophage l (49 kb) followed gradually, but determining the complete sequence of a bacterial genome
GENE MAPPING TO GENOMICS |
283 |
DNA fragment to be sequenced
Random fragments cloned with appropriate vector
Library of random clones
Pick and sequence random clones
a
f
b
c
d
e
Computer assembly of overlapping sequences into a contig
|
|
|
|
|
|
|
|
e |
||
|
b |
|
|
d |
|
|
|
f |
||
|
|
|
|
|
|
|||||
|
|
|
|
|
|
|
|
|
|
|
|
|
|
|
|
|
|
|
|
|
|
|
a |
c |
|
|
|
|||||
Finished sequence
Figure 10.7 Shotgun cloning and sequencing
(about 100 times larger than that of l) only became possible with the advent of automated sequencing machines and robotic methods for the associated procedures.
A key moment in the history of molecular biology was on 28 July 1995 when Venter, Smith and Fraser reported the first complete genome sequence for a
284 |
MOLECULAR GENETICS OF BACTERIA |
free-living organism, Haemophilus influenzae (which has a genome of 1.83 Mb). The ability to sequence entire bacterial genomes has now revolutionized our understanding of bacteria and the entire field of bacteriology. To put this in perspective, by 2002 the sequences of nearly 100 bacterial genomes had been completed.
Analysis of these sequences provides tremendous biological insight into an organism, including information that cannot be obtained using classical approaches. For example, it has become clear that classical bacterial genetics has identified only a fraction of the genes within any genome and often half of the predicted coding regions had not been previously characterized and did not have any known function. By comparing entire genome sequences the evolutionary forces that have forged the physiology of a bacterium can be determined. Genome projects can also be the starting points for far-reaching projects which seek for example, to identify the function of all genes that an organism possesses or to characterize the expression of all genes in a bacterial cell.
Genome sequencing strategies
The aim of a bacterial genome sequencing project is to determine the sequence of several million bases (mega bases or Mb) with an error rate lower than 1 per 10 000 nucleotides. However, the available methods can produce, at the most, sequence data for 1000 bases for each reaction and consequently it is necessary to split up the total DNA of an organism, sequence the parts and then reassemble the information. The most widely used strategy for this is whole genome shotgun sequencing. The principle of this is essentially the same as that illustrated in Figure 10.7, but using thousands or millions of clones rather than a handful. In essence, the DNA of a chosen bacterium is shattered into millions of small fragments which are cloned using a plasmid vector (or sometimes M13), generating a library that represents the entire genome of the target organism. The inserts in each of these plasmids are then sequenced and assembled into contigs.
Since these are random fragments, many of them will overlap. This may seem wasteful, as sequences that have already been determined will be repeated. Actually, it is critical to the success of the procedure. Not only does the sequencing of overlapping fragments enhance the accuracy of the sequence, but the overlaps are crucial for contig assembly.
After this process the genome sequence is nearly complete but often small gaps are left in the sequence because certain regions cannot be cloned. Repetitive elements such as insertion sequences also cause difficulties in contig assembly. Closing these gaps is often the limiting factor which dictates the speed at which genomes can be sequenced. Vectors that are capable of accepting very large inserts (such as bacterial artificial chromosomes or BACs) are useful for bridging large gaps, while smaller gaps can be bridged using PCR.
GENE MAPPING TO GENOMICS |
285 |
An alternative strategy, as used for sequencing the largest bacterial genome determined so far (Streptomyces coelicolor), is to start by establishing an ordered gene library and then to determine the sequence of each of the clones separately before joining them together to obtain the complete sequence. This ‘clone by clone’ approach has the advantage that each clone sequenced is a coherent and usable piece of information. Contig assembly and gap closure are also easier, since this approach is less affected by problems with repetitive DNA. However, establishing an ordered library can involve extensive work. Many genome sequencing projects combine elements of both approaches.
10. 2.3 Comparative genomics
With genome sequences being available for a number of bacteria, it is possible to compare them to investigate gene function and provide information on the evolutionary history of bacteria. If for example, RNA polymerases from two bacteria are compared, they will be seen to share a very similar sequence. They have descended, through divergence, from a common ancestral molecule. These two enzymes are called homologues. In this case it is apparent that the homologues have evolved from a common ancestral gene by speciation and thus have similar function, and consequently the two RNA polymerases can be described as orthologues (a specific type of homologue). Sometimes evolutionary events are not as straightforward. Paralogues, for example, are homologues that are produced by duplication of a gene within a genome followed by subsequent divergence of one of the copies. Although they share some amino acid sequences, they have different functions. In contrast, analogues are genes/proteins that have descended convergently from an unrelated ancestor but have similar functions although they are not related to each other – so they are non-homologous.
One of the most obvious differences in genome sequences is size. This can range from 450 and 580 kb for Buchnera and Mycoplasma genitalium respectively, to those of Pseudomonas aeruginosa (6.3 Mb), Mesorhizobium loti (7.04 Mb) and
Streptomyces coelicolor (8.7 Mb). Buchnera is an intracellular symbiont of aphids and has through evolution, retained only the bare minimum of essential genes for survival in its own specialized niche. On the other hand, P. aeruginosa is a highly adaptable bacterium which can thrive in many different environments including the human host. S. coelicolor is a soil-dwelling bacterium which also shows nutritional versatility as well as a life cycle involving different morphological stages (see Chapter 9) and the ability to produce a range of secondary metabolites (Streptomyces species are the main source of naturally-occurring antibiotics). Not surprisingly, both of these organisms contain a large number of regulatory genes and the size and complexity of their genomes reflect an evolutionary adaptation that allows them to occupy diverse environments.
286 |
MOLECULAR GENETICS OF BACTERIA |
The study of E. coli, more than any other organism, has provided key biological insights. Whilst most strains of E. coli are regarded as commensals in the gut, a small number cause disease. In this context, the sequence of the non-pathogenic K-12 strain provides a baseline against which other E. coli sequences can be assessed. For example, E. coli O157:H7 is one of the most dangerous pathogens threatening our food supply. When the genome of this strain was sequenced it was found to possess over 1000 genes that the non-pathogenic K-12 strain lacked. Many of these ‘new’ genes appear to be associated with the ability of O157:H7 to cause disease. The nature and origin of this inserted DNA was discussed in more detail in Chapter 4. Important insights into other closely related pathogens have also been gained by comparing genomes. For example, Mycobacterium leprae (the causative agent of leprosy) has lost the function of around 1700 genes compared with its close relative Mycobacterium tuberculosis and only half of the genome actually encodes functional genes. The degree of this decay in genetic function represents a highly specialized adaptation, to such an extent that M. leprae still cannot be grown in laboratory culture.
Microarrays
The genome sequence of a bacterium can be used to study the variation that occurs within other strains of the same species. For example, the question could be asked, in what way does the tuberculosis vaccine strain BCG differ from the sequenced virulent strain of Mycobacterium tuberculosis? Rather than determining the complete sequence of BCG (although that will probably have been done by the time this book is published), microarrays can be used. A further application of microarrays – for comparing gene expression in two organisms – is dealt with later in this chapter.
From the complete genome sequence of a bacterium (in this example, M. tuberculosis), it is possible to generate a set of DNA fragments that correspond to part of each gene in the genome, either by PCR amplification or by using synthetic oligonucleotides. This might seem an impossible task – for example there would be about 4000 such DNA fragments for M. tuberculosis – and indeed it would be arduous if carried out manually. In fact, robotic devices are used. A tiny spot of each of these oligonucleotides is printed onto the surface of a glass slide in a grid-like arrangement (again using a robot to give very precise positioning of each spot).
To compare the genetic content of M. tuberculosis and BCG, DNA from each organism is extracted and labelled (as small fragments) with a different fluorescent dye. The two DNA samples are then mixed and applied to the glass slide so that they will hybridize to the array of spots (Figure 10.8). The binding of a labelled fragment to a spot on the microarray is read by a machine which is able to