

nanotechnology / nano4_1_032
.pdfINSTITUTE OF PHYSICS PUBLISHING |
NANOTECHNOLOGY |
Nanotechnology 15 (2004) 163–170 |
PII: S0957-4484(04)68285-7 |
Photoinduced charge transfer in composites of conjugated polymers and semiconductor nanocrystals
M Pientka1, V Dyakonov1, D Meissner2, A Rogach3, D Talapin4,
H Weller4, L Lutsen5 and D Vanderzande6
1Energy and Semiconductor Research Laboratory, University of Oldenburg, D-26111 Oldenburg, Germany
2University of Applied Sciences of Upper Austria, A-4600 Wels, Austria
3Photonics and Optoelectronics Group, Physics Department and CeNS, University of Munich, D-80799 Munich, Germany
4Physical Chemistry, University of Hamburg, D-20146 Hamburg, Germany
5IMEC, IMOMEC Division, Campus LUC, B-3590 Diepenbeek, Belgium
6Limburgs Universitair Centrum, Institute for Material Research, Universitaire Campus Bld. D, B-3590 Diepenbeek, Belgium
Received 29 August 2003, in final form 14 October 2003
Published 18 November 2003
Online at stacks.iop.org/Nano/15/163 (DOI: 10.1088/0957-4484/15/1/032)
Abstract
Photoinduced electron transfer in composites of CdSe and InP nanocrystals (NC) with a conjugated polymer [2-methoxy-5-(3-,7-dimethyl-octyloxy)-1, 4-phenylene vinylene] (OC1C10-PPV) is studied by means of light-induced electron spin resonance (LESR), photoluminescence (PL) as well as quasi steady-state photoinduced absorption (PIA) spectroscopy. The quenching of PL, the occurrence of two new optical absorption bands, and the formation of light-induced paramagnetic species on the polymer chain are altogether interpreted as an electron transfer between a donor polymer and acceptor NC in the excited state. In particular the LESR provides evidence of an electron transfer rather than energy transfer due to an overlap of absorption and emission bands of NC and the conjugated polymer. The g-factor of the signal is consistent with the cationic origin of OC1C10-PPV radicals. Additionally, the LESR signal is sensitive to NC surface coating being smaller in blends with the tri-n-octylphosphine oxide–tri-n-octylphosphine (TOPO–TOP) coated CdSe surface and completely absent in blends with TOPO–TOP–InP. LESR probes predominantly positive polarons on the conjugated polymer chain generated at room temperature in the course of an electron transfer to NC. This is very different from the situation in blends of OC1C10-PPV with fullerenes, another promising photovoltaic acceptor, where the photogenerated cation and anion were both observed in the LESR. In PIA we found contributions of both polymer polarons and electrons on the NC. The recombination kinetics shows a broad distribution of lifetimes, which is characteristic for dispersive (diffusive) recombination processes with fractional power frequency dependence.
1. Introduction
Semiconductor nanocrystals (NC) are particularly interesting for the development of novel electronic and optoelectronic devices like transistors, light emitting diodes, and lasers
[1–3]. Layered hybrid structures consisting of NC and semiconducting polymers have been utilized in colour tunable light-emitting diodes [4–6]. By mixing NC with conjugated polymers their applicability could also be expanded to the fabrication of photovoltaic devices [7–9] due to the formation
0957-4484/04/010163+08$30.00 © 2004 IOP Publishing Ltd Printed in the UK |
163 |
M Pientka et al
of a high surface interface for the effective photogeneration of charge carriers. Low cost, large area application and easy solution processability by spin coating or even screen printing techniques make this topic especially attractive for industry. The working principles of such a bulk-heterojunction photovoltaic device were intensively investigated in the case of blends of conjugated polymers and fullerene derivatives as the light absorber [10]. Upon photoexcitation, an ultrafast electron transfer between the conjugated polymer (donor) and the fullerene molecule (acceptor) takes place [11]. This ensures an efficient charge carrier generation with a quantum efficiency close to unity. However, those devices reach energy conversion efficiencies in the range of 2.5–3.5% [8, 12]. Taking the high quantum yield of charge carrier generation in these composites into account, a much higher development potential can be anticipated. One clear disadvantage of the above approach is the weak absorption of the acceptor molecule. Semiconducting NC have a potential to combine good electron accepting properties and high absorption coefficient in the spectral range of interest. In the latter case, the photoinduced hole transfer will take place, whereas the final charge transfer state will be the same. Critical parameters for such a charge transfer process are the HOMO–LUMO gap of the polymer, the band gap of the NC as well as their electron affinities. These values can be adjusted by chemical tailoring of side groups of the conjugated polymer, and, in the case of the NC, by varying the size and the composition of quantum dots [13].
The photoinduced electron transfer from derivatives of PPV and NC of cadmium selenide (CdSe) was investigated recently by Greenham et al [5, 14]. They demonstrated the quenching of the polymer photoluminescence (PL) and the formation of long-lived positive polarons on the polymer chain as a consequence of the electron transfer from polymer to NC upon photoexcitation. Due to the slight overlap between the polymer emission band and the nanocrystal absorption spectrum, as is the case in PPV/CdSe blends, the energy transfer may compete with the electron transfer. In this study we applied light-induced electron spin resonance (LESR) additionally to the spectroscopic techniques such as PL and photoinduced absorption (PIA) for the investigation of charge transfer processes in conjugated polymer [2-methoxy-5-(3-,7- dimethyl-octyloxy)-1,4-phenylene vinylene] (OC1C10-PPV) blended with CdSe or InP NC. Compared to CdSe, the InP absorbs light further in the red part of the spectrum, therefore increasing the spectral overlap of absorption and emission spectra of NC and conjugated polymer, respectively. The magnetic resonance technique applied in this work is only sensitive to the light-generated spin carrying polarons, therefore it can be employed to distinguish between electron and energy transfer. The technique was successfully applied to blends of conjugated polymers and methanofullerenes, where the formation of the photogenerated spins on donor and acceptor counterparts was demonstrated [15, 16].
2. Experimental details
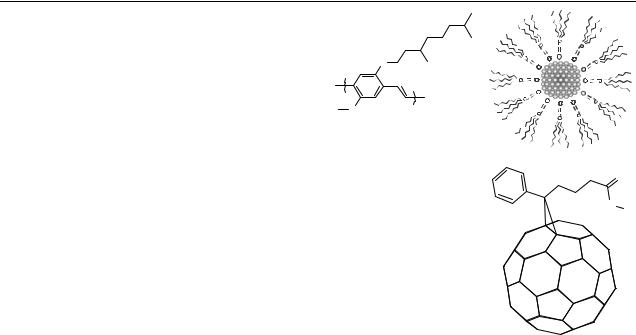
The chemical structure of the polymer used (OC1 C10-PPV) and a NC capped with an organic shell is schematically shown in figure 1. As a reference acceptor, we used a methanofullerne, phenyl-C61 butyric acid methyl ester (PCBM) (figure 1(c)).
O
*
*
|
O |
a) |
b) |
|
O
O C
c)
Figure 1. Chemical structures of (a) OC1C10-PPV, (b) capped TOPO–TOP nanocrystal and (c) methanofullerene PCBM.
OC1C10-PPV was synthesized by the sulfinyl route as described elsewhere [17] and dissolved in chloroform. CdSe NC were capped with the HDA–TOPO–TOP shell (HDA— is hexadecylamine). InP NC were capped with the tri- n-octylphosphine oxide–tri-n-octylphosphine (TOPO–TOP) shell. CdSe NC with narrow size distributions were synthesized in a HDA–TOPO–TOP mixture according to the method described in [18]. InP NC were prepared via dehalosilylation reaction between indium chloride and tris-(trimethylsilyl)phosphine in tri-n-octylphosphine oxide (TOPO) or (TOPO–TOP) mixtures [19]. To remove the TOPO–TOP or HDA–TOPO–TOP shell, some NC were treated with pyridine [20] and subsequently dissolved in chloroform.
The NC were prepared with different diameters: 2.4 nm (CdSe pyridine washed), 4.0 nm (CdSe–HDA–TOPO–TOP), 4.1 nm (CdSe pyridine washed), 4.2 nm (InP–TOPO–TOP and pyridine washed). The NC and polymer were mixed in two different weight ratios of 2:1 and 4:1. For PIA spectroscopy the samples were prepared as drop cast films onto sapphire substrates and mounted on a helium cold finger cryostat (20–293 K). During the measurement they were kept under dynamic vacuum to avoid photo-oxidation. The excitation source was a mechanically chopped solid state laser at a wavelength of 532 nm. Additionally, cw-illumination was provided by a halogen lamp. Both light sources were focused onto the same point of the sample. The transmitted light was collected by large diameter concave mirrors and focused into the entrance slit of a 300 mm monochromator. Depending on the wavelength, the detection was provided by a silicon diode (550–1100 nm), or by a liquid nitrogen cooled InSbdetector (1100–5550 nm). Therefore, a broad energy range 0.23–2.25 eV (with the sapphire cryostat windows and the sample substrate) was accessible. The signals were recorded with a standard phase sensitive technique synchronized with
164
Photoinduced charge transfer in composites of conjugated polymers and semiconductor nanocrystals
|
|
|
|
OC1C10-PPV Abs. |
|
|
|
|
|
|
OC1C10-PPV PL |
|
|
|
|
|
|
CdSe (4.0nm) Abs. |
|
|
|
|
|
|
InP (4.2nm) Abs. |
|
|
Absorption /a.u. |
|
|
|
|
|
PL /a.u. |
300 |
400 |
500 |
600 |
700 |
800 |
900 |
Wavelength / nm
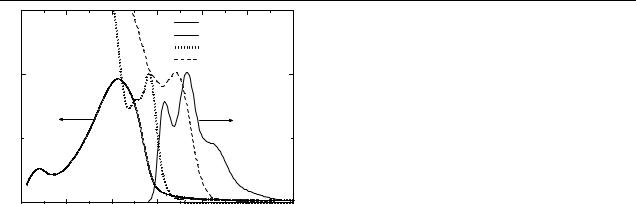
Figure 2. Absorption spectra of OC1C10-PPV (solid curve), CdSe NC (dotted curve), InP NC (dashed curve) and the PL of
OC1C10-PPV (solid curve).
the chopping frequency of the laser. Photoinduced changes of the transmission, T / T , were monitored as a function of probe light wavelength. PL measurements were done with the same set-up. LESR measurements were done in a commercial X-band Bruker E500 spectrometer with an optically accessible microwave cavity. The solutions were poured into quartz tubes, dried and sealed under vacuum.
3. Results and discussion
3.1. Optical absorption and photoluminescence
Figure 2 shows the absorption spectra of pure OC1C10-PPV, CdSe and InP NC, and the PL spectrum of pure OC1C10-PPV in the solid state. The absorption spectrum of nanocomposites (not shown) represents a superposition of respective spectra of pure materials, therefore no interaction of involved materials in the ground states take place. Figure 3 shows PL spectra for the pure OC1C10-PPV and its blends with different NC. All curves are obtained for nearly identically prepared films so that an estimation of the PL quenching efficiency may be made. The results can be summarized as follows: the PL in all composites is strongly quenched (note the magnification factor of 100). The most efficient quenching, however, takes place in the case of pyridine washed InP and CdSe based composites (down triangles and diamonds in figure 3). The quenching is less effective with CdSe NC of smaller size (2.4 nm, weight ratio 4:1, not shown), but also in less concentrated blends (weight ratio 2:1) of CdSe (4.1 nm). In contrast, the CdSe–HDA– TOPO–TOP (4.0 nm, weight ratio 4:1) and InP–TOPO–TOP (4.2 nm, 2:1) are worse PL quenchers.
The PL quenching may be due to two effects:
(i)photoinduced charge transfer, and
(ii)resonance energy transfer between species in the excited state and in the ground state, respectively, due to an overlap of emission and absorption spectra.
The latter depends on intermolecular distance and spectral overlap as well as on the mutual transition dipole orientation. For the occurrence of charge transfer, the binding energy of photogenerated exciton corrected for Coulomb attraction
between separated charges should be smaller than the difference in the electron affinities of the participating donor and acceptor species. The electron affinity (LUMO) for the polymer OC1C10-PPV is −2.7 eV and the ionization potential (HOMO) is −5.1 eV. The electron affinity value for CdSe NC (4.1 nm) is −4.6 eV and the ionization potential of −7 eV. The respective values for InP NC (4.2 nm) are −3.95 and −6.05 eV. The magnitude of the exciton binding energy in PPV is still a matter of debate. Values between 1 eV and kBT are reported in the literature. A theoretical estimate of the exciton binding energy in PPV based on effective mass calculations leads to the value of 0.4 eV [21]. Steady state photo-conduction experiments on PPV-derivative films result in the same value [22]. In all cases, it follows that the charge transfer between OC1C10-PPV and CdSe and InP NC is energetically possible.
3.2. Photoinduced absorption (PIA)
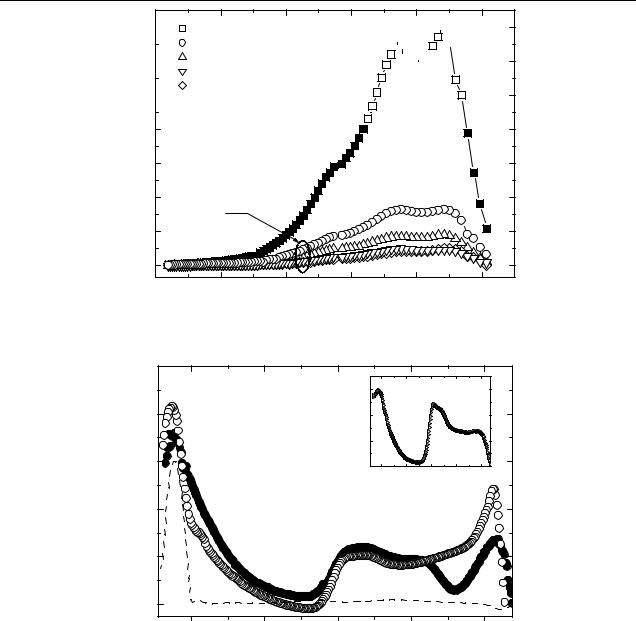
In figure 4, the room temperature PIA spectra of CdSe (pyridine, 4.1 nm):OC1C10-PPV mixed in weight ratio 4:1 and InP (pyridine, 4.2 nm):OC1C10-PPV (2:1) are shown. We identify two main features: the first one at 0.31 eV, the low energy (LE) peak, and the second one at 1.34 eV (with a pronounced shoulder at 1.22 eV), the high energy (HE) peak. The feature around 2.2 eV is due to the bleaching of conjugated polymer via ground state depletion. We attribute the LE and HE peaks to the allowed transitions of polarons located in the energy gap of the polymer. Similar spectra in blends of CdSe NC and MEH-PPV are reported by Ginger and Greenham [14]. There, the rising edge at 0.5–0.7 eV was detected, being probably of the same origin as the LE peak at 0.31 eV found in this work. Moreover, the PIA bands detected in polymer–NC blends are nearly identical to those found in polymer–fullerene composites. The inset to figure 4 shows the PIA spectrum in OC1C10-PPV blended with C60 derivative PCBM. The absorption peak at 0.35 eV and a double peak at 1.24–1.34 eV are identified as positive polarons generated in the photoinduced electron transfer between polymer and fullerene [23].
Similarly to the PIA results on polymer–fullerene composites, no direct indications for the electron located on the CdSe NC are found. PIA measurements performed on OC1C10-PPV:PCBM in solution (not shown) revealed a small contribution of a C60 radical anion at 1.1 eV. In solution, the situation for observation of the electron is more favourable due to reduced intermolecular interaction preventing the delocalization of the electron. In the solid state films this peak is not seen (see inset to figure 4). The mechanisms that leads to the absence of PIA of electrons on the NC might be different. The photoinduced electron might be trapped on the surface, particularly in pyridine treated NC. However, comparing the intensity ratios of LE and HE peaks in NC: polymer blends (4:1 in CdSe blends) with the one in polymer–fullerene blends (1:1), it is conceivable that there exists an additional contribution to the LE peak. To check this, we studied solid films of pure CdSe pyridine treated NC by the PIA technique, as shown in figure 4, dashed curve. (The InP NC demonstrated an identical behaviour, and is therefore not shown.) The origin of this peak in pure NC is apparently not the charge transfer
165
M Pientka et al
PL /a.u.
1,0 |
|
|
|
|
|
PPV |
|
|
|
|
|
||||||||||||||||||||
|
|
|
|
|
|
PPV/CdSe-TOPO-TOP (4.0nm) |
|
|
|
|
|
|
|
|
|
|
|
|
|
|
|
|
|
||||||||
|
|
|
|
|
|
||||||||||||||||||||||||||
|
|
|
|
|
|
|
|||||||||||||||||||||||||
0,9 |
|
|
|
|
|
PPV/InP-TOPO-TOP (4.2nm) |
|
|
|
|
|
|
|
|
|
|
|
|
|
|
|
|
|
|
|
|
|||||
|
|
|
|
|
|
PPV/CdSe (pyridine) (4.1nm) |
|
|
|
|
|
||||||||||||||||||||
|
|
|
|
|
|
|
|
|
|
|
|
|
|
|
|
|
|
|
|
|
|
|
|
|
|
|
|
||||
0,7 |
|
|
|
|
|
PPV/InP (pyridine) (4.2nm) |
|
|
|
|
|
|
|||||||||||||||||||
|
|
|
|
||||||||||||||||||||||||||||
|
|
|
|
|
|
|
|
|
|
|
|
|
|
|
|
|
|
|
|
|
|
|
|
|
|
|
|
|
|||
|
|
|
|
|
|
|
|
|
|
|
|
|
|
|
|
|
|
|
|
|
|
|
|
|
|
|
|
|
|
|
|
|
|
|
|
|
|
|
|
|
|
|
|
|
|
|
|
|
|
|
|
|
|
|
|
|
|
|
|
|
|
|
|
|
|
|
|
|
|
|
|
|
|
|
|
|
|
|
|
|
|
|
|
|
|
|
|
|
|
|
|
|
|
|
|
|
|
|
|
|
|
|
|
|
|
|
|
|
|
|
|
|
|
|
|
|
|
|
|
|
|
|
|
|
|
|
|
0,6
0,4
0,3 |
x 100 |
|
|
|
|
|
|
|
|
|
|
0,1 |
|
|
|
|
|
0,0 |
|
|
|
|
|
1,2 |
1,4 |
1,6 |
1,8 |
2,0 |
2,2 |
Energy /eV
Figure 3. PL spectra of OC1C10-PPV (squares) and OC1C10-PPV nanocrystal composites: CdSe–HDA–TOPO–TOP (4:1, circles), InP–TOPO–TOP (2:1, up triangles), CdSe pyridine treated (4:1, down triangles) and InP pyridine treated (2:1, diamonds).
10,0 |
|
|
|
|
|
|
|
|
|
|
|
|
|
3 |
|
|
PCBM/OC1C10-PPV |
||
|
8,0 |
|
-4 |
2 |
|
|
|
|
|
|
|
∆T/T*10 |
|
|
|
|
|
||
|
|
|
1 |
|
|
|
|
|
|
|
|
|
- |
|
|
|
|
|
|
|
6,0 |
|
|
0 |
|
|
|
|
|
|
|
|
|
0,4 |
0,8 |
1,2 |
1,6 |
2,0 |
|
|
|
|
|
|
|||||
-4 |
|
|
|
|
|
Energy /eV |
|
|
|
|
|
|
|
|
|
|
|
|
|
T/T*10∆ |
4,0 |
|
|
|
|
|
|
|
|
|
|
|
|
|
|
|
|
|
|
- |
|
|
|
|
|
|
|
|
|
|
2,0 |
|
|
|
|
|
|
|
|
|
0,0 |
|
|
|
|
|
|
|
|
|
0,4 |
0,8 |
1,2 |
|
|
1,6 |
|
2,0 |
|
Energy /eV
Figure 4. PIA spectra of OC1C10-PPV–CdSe (4.1 nm pyridine, open circles), OC1C10-PPV–InP (4.2 nm pyridine, filled circles) composites, pure CdSe (pyridine) NC (dashed curve). T = 293 K, ν = 80 Hz. Inset: PIA spectra for OC1C10-PPV–PCBM composite at T = 80 K.
process, as no polymer matrix was present. More probably, a decay of singlet excitons with subsequent trapping of charge carriers of one sign by surface states leads to the formation of residual charges in the NC. In a PIA experiment, however, it is difficult to distinguish the electrons injected from the polymer in a charge transfer reaction from those formed via exciton dissociation processes. The superposition of a broader peak with a flat rising edge from positive polarons on polymer chain with a sharp peak of charged NC results in a spectral line shape of the LE peak. The broad LE PIA peak in polymer–fullerene composites originates from positive polarons only (see inset to figure 4).
To summarize the PIA studies of polymer–NC, we note that similar PIA charge transfer signals were obtained in
all CdSe-based composites (capped and non-capped), in contrast to the results reported in [14]. Similar behaviour showed pyridine treated InP NC based blends. In the case of InP–TOPO–TOP (4.2 nm):OC1C10-PPV (2:1) blends, no indications for photoinduced charge transfer, as followed from PIA (and LESR presented below) studies, were found, even though the PL was quenched. This may be because of the resonance energy transfer due to an overlap of the emission spectrum of the polymer with the absorption spectrum of the InP NC. In the latter case, however, one would expect the formation of excitons in the NC with their subsequent decay. To hold the scenario of energy transfer, we assume that the radiative decay of excitons in InP NC cannot be distinguished from the residual background PL from the polymer.
166
Photoinduced charge transfer in composites of conjugated polymers and semiconductor nanocrystals
The spectral overlap in the case of CdSe is much smaller, and therefore the probability of energy transfer is lower (see figure 2). The weak PIA signals observed in CdSe–HDA– TOPO–TOP:OC1C10-PPV blends are due to the presence of surface ligands which act as a kinetic barrier, therefore hindering the charge transfer. The possibility of hole transfer from the NC to conjugated polymers cannot be ruled out on the basis of the PIA studies as the same final charge separated state will be formed. Furthermore, the absorption spectra of NC and polymers used are overlapping, making the selective excitation of NC only impossible. In this context, the studies of the photocurrent action spectra would shed more light.
Finally, in all investigated samples, we did not find any influence of the mixing ratio on PIA spectra.
3.3. Excitation intensity and frequency dependence of PIA
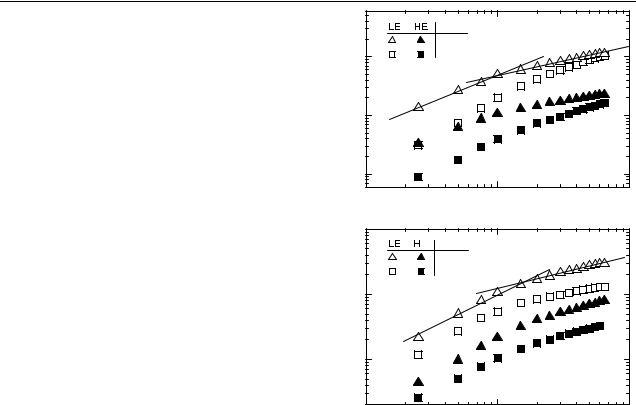
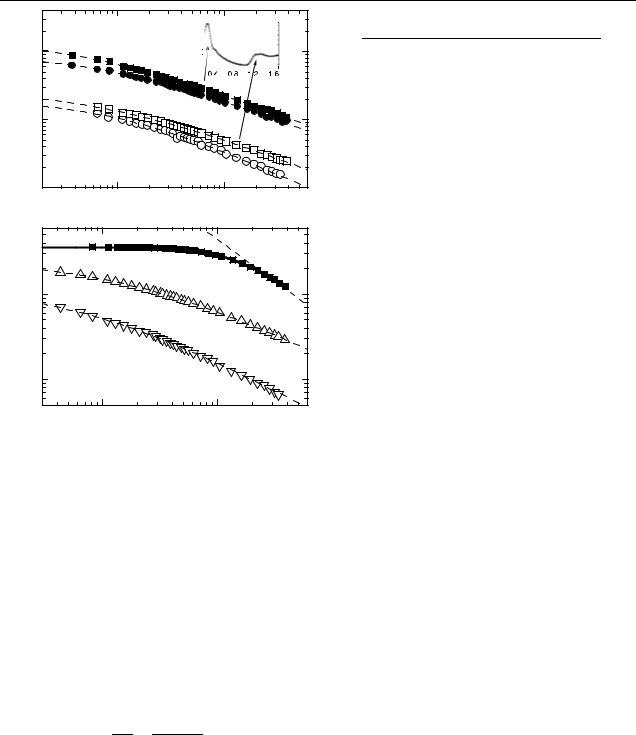
In figure 5, the excitation intensity dependence of the LE (open symbols) and HE (filled symbols) peaks for pyridine treated CdSe (a) and InP (b) based composites are shown at temperatures 293 and 20 K. The behaviour is identical for both investigated systems. Also, the variation of both peaks (LE and HE) with pump intensity I is correlated: a power law dependence of − T / T Iα with α ≈ 1 is observed at intensities below 1 mW cm−2 and α ≈ 0.5 at higher intensities. Hence, the recombination kinetics show a crossover from monomolecular to bimolecular recombination due to an efficient charge generation at high excitation levels. For monomolecular recombination of photogenerated charges, the magnitude of the PIA can be expressed as given by [24]:
− |
T |
|
|
gIτ |
T |
|
|
||
|
I + (ωτ )2 |
where ω is the excitation light modulation frequency, I is the laser light intensity, g is the generation efficiency, τ is the lifetime. For ωτ 1, − T / T gIω−1; for ωτ 1, − T / T gIτ is independent of modulation frequency. Hence, in both cases we expect a linear intensity dependence for PIA.
In the bimolecular case we expect [24] |
|
|
||||||||||||
|
|
|
|
|
|
|
|
|
|
|
||||
|
|
|
− T |
|
|
β |
|
αα+ tanh α , |
|
|||||
|
|
|
|
T |
|
|
gI |
|
|
tanh α |
|
|
|
|
where α |
= |
π √ |
|
/ω, β is the bimolecular decay constant. |
||||||||||
gIβ |
||||||||||||||
|
|
|
|
|
|
|
|
|
|
|
|
0.5 |
, i.e. the |
|
For large α, tanh α → 1 and − T / T ≈ |
(gI/β ) |
|||||||||||||
PIA is independent of ω and shows a square-root intensity dependence. For small α, − T / T ≈ α(gI/β )0.5 = π gI/ω, i.e. has ω−1 frequency dependence, but linear with intensity. Therefore, to distinguish between biand monomolecular types of recombination, one should use experimental data obtained in the low frequency limit. The values plotted in figure 5 are measured at a frequency of 80 Hz. We also note that in the presence of traps, as well as in the case of severe disorder [25], the monomolecular and bimolecular recombinations with a sublinear pump intensity are hardly distinguishable.
The PIA signals decrease with excitation intensity modulation frequency following nearly the same law for both LE and HE bands, as shown in figures 6(a) and (b). All curves were measured at higher excitation intensity, i.e. corresponding
|
|
293K |
slope 0.5 |
|
|
|
|
|
10 |
20K |
|
-4 |
|
slope 1 |
|
-∆T/T*10 |
|
|
|
1 |
|
|
|
|
|
|
|
|
0,1 |
|
a) |
|
|
|
|
|
0,1 |
1 |
10 |
|
|
Intensity / mWcm-2 |
|
|
10 |
|
|
|
|
E |
slope 0.5 |
|
|
293K |
|
|
|
|
|
|
|
20K |
|
-3 |
1 |
|
|
|
|
|
|
-∆T/T*10 |
|
slope 1 |
|
0,1 |
|
|
|
|
|
|
|
|
|
|
b) |
|
0,1 |
1 |
10 |
|
|
Intensity / mWcm-2 |
|
Figure 5. (a) Intensity dependence of the 0.31 (LE) and 1.34 eV HE PIA peaks for OC1C10-PPV-CdSe nanocomposites at T = 293 and 20 K, ν = 80 Hz. Symbols are indicated in the legend. The straight lines are fits with slope 1 and slope 0.5 indicating the monomolecular and bimolecular regime. (b) Intensity dependence of the LE and HE PIA peaks for OC1C10-PPV-InP nanocomposites at T = 293 and 20 K, ν = 80 Hz. The straight lines are fits with slope 1 and slope 0.5 indicating the monomolecular and bimolecular regime.
to the bimolecular recombination. The frequency dependence of PIA spectrum of triplet excitons in pure OC1C10-PPV is shown for comparison (figure 6(b), filled squares). The solid curve is a fit for monomolecular recombination with time constant of 156 µs. The latter follows the ω−1 frequency dependence in the high frequency limit (dashed line with slope = −1) as expected. In contrast, the data obtained for NC blends fit neither the pure mono-, nor the pure bimolecular behaviour. We attribute this behaviour to a broad distribution of lifetimes. In the frequency range used, 80–3800 Hz, we can estimate the lifetime of shortest involved species to be less than 250 µs and the lifetime of the long living species up to several tens or even hundreds of milliseconds. The latter values follow from the fact that PIA does not show a plateau in the low frequency range, i.e. it is frequency dependent already at lowest modulation frequency, where the reciprocal lifetime of photogenerated pairs τ −1 < ω. Such a broad distribution of lifetimes can be rationalized, if we assume the lifetime is determined by a mutual recombination of electron and holes, and the long living pairs are distant pairs, whereas the pairs with shorter lifetime are close pairs. For the recombination to occur, both charges should diffuse over a certain distance along their respective pathways. The recombination of distant
167
M Pientka et al
|
|
|
8,0 |
|
|
-4 |
6,0 |
|
|
-∆T/T*10 |
|
|
1 |
4,0 |
|
|
2,0 |
||
|
|
0,0 |
|
|
|
|
|
4 |
|
|
Energy /eV |
/ 10 |
|
|
|
|
|
|
|
-∆T/T |
0,1 |
|
|
|
|
|
|
|
a) |
|
|
|
100 |
|
1000 |
Frequency / Hz
|
|
slope=-1 |
1 |
|
|
3 |
|
|
-∆T/T / 10 |
|
|
0,1 |
b) |
|
|
100 |
1000 |
Frequency /Hz
Figure 6. (a) Frequency dependence of the LE and HE PIA peaks in OC1C10-PPV–CdSe composites: E = 0.31 eV, T = 293 K (filled squares); E = 0.31 eV, T = 20 K (filled circles); E = 1.34 eV,
T = 293 K |
(open squares); E |
= |
1.34 eV, T |
= |
20 K (open circles). |
|
2 |
|
|
|
|||
I = 6 mW cm− |
. (b) Frequency dependence of the LE (up |
|||||
triangles) and HE (down triangles) PIA bands in OC1C10-PPV–InP (pyridine). T = 293 K, I = 6 mW cm−2. Dashed curves are fits according to the dispersive recombination mechanism (see text). For comparison, the frequency dependence of the triplet exciton in
OC1C10-PPV at T = 20 K is shown (filled squares). The solid curve is a monomolecular fit with lifetime 156 µs.
pairs and closed pairs is selectively probed at low and high modulation frequencies, respectively. This is characteristic for dispersive (also called diffusive) recombination processes, as was observed in disordered amorphous materials [26] and π -conjugated polymers [27]. In this picture, the PIA response on modulated excitation is as follows:
−T = ( T / T )0 , T 1 + (ωτ )γ
where ( T / T )0 is the PIA amplitude at ω = 0, ω is the modulation frequency, τ –effective (mean) lifetime, constant γ < 1. We fitted the experimental data with the above expression (dashed curves in figures 6(a) and (b)) and the parameters are summarized in table 1. All experimental curves follow the modulation frequency with fractional power law dependence with γ between 0.6 and 0.75, and nearly independent of the sample. By applying the same analysis to PIA from triplet excitons in OC1C10-PPV (figure 6(b), filled squares), we obtain γ = 1.5.
Table 1. Parameters of the fit of modulation frequency dependence in figure 6 with the dispersive recombination model (see text).
Acceptor |
Energy T (K) |
τ (ms) |
γ |
|||
|
|
|
|
|
|
|
|
0.31 |
293 |
3.7 |
|
0.60 |
|
|
0.31 |
20 |
1.7 |
|
0.62 |
|
CdSe |
1.34 |
293 |
1.9 |
|
0.62 |
|
CdSe |
1.34 |
20 |
1.3 |
|
0.75 |
|
InP |
0.31 |
293 |
0.9 |
|
0.66 |
|
InP |
1.34 |
293 |
2.3 |
10−3 |
0.71 |
|
PCBM |
1.34 |
80 |
84 |
× |
0.75 |
|
|
||||||
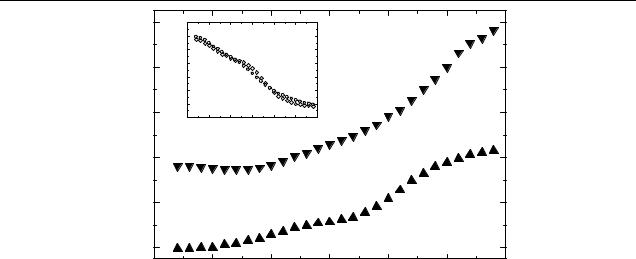
3.4. Temperature dependence of PIA
The results of the temperature dependence of T / T in InP– pyridine/OC1C10-PPV are shown in figure 7. For comparison, a temperature dependence for a OC1C10-PPV:PCBM is displayed in the inset. An increase of LE and HE PIA signals with temperature is observed. In contrast, a decrease is found in fullerene-based blends. Similar behaviour in CdSe:MEHPPV blends was reported in [14], but the explanation remained open. Generally the magnitude of PIA signal − T / T = nσ d (n is the density of photogenerated polarons/electrons, σ is the absorption cross-section, d is the sample thickness) is affected by the lifetime of the photogenerated charges and by their generation efficiency, provided the d and σ are constant. One expects an increase of the charge carriers lifetime at lower temperatures and, hence, an increase of n and T / T . This is expected in our case, too. However, in modulation techniques, such as PIA, a decrease of the reciprocal lifetime due to the temperature below the frequency of modulation of the optical excitation will lead to a decrease of the total signal. In the extreme case of very long lived charges, the switching-off of the optical excitation is not immediately followed by a change in density, therefore a zero signal is expected. As we discussed in the previous section, no plateau was reached in T / T (ω) dependence even at the lowest modulation frequency applied (see figures 6(a) and (b)). In contrast, the fullerene-based blends (see inset to figure 7) demonstrate PIA features with much shorter average lifetimes (84 µs), as indicated by aT / T (ω) plateau (not shown). Therefore, a decrease in temperature led to an increase of the density n and, hence, of the amplitude T / T .
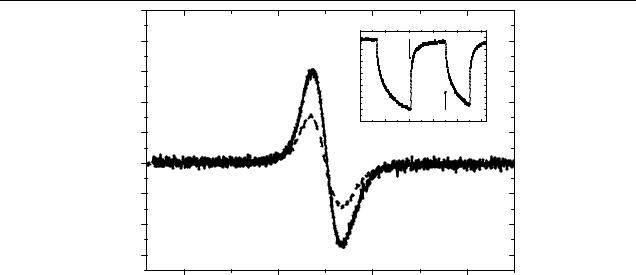
3.5. Light-induced electron spin resonance
Electron-spin resonance spectra for CdSe–pyridine:OC1 C10- PPV and CdSe–HDA TOPO–TOP:OC1C10-PPV composites under illumination with the 514 nm line of an Ar+-laser at room temperature are shown in figure 8. A strong signal (solid curve) at g = 2.0025 due to the polymer cation radicals (positive polarons) [16] is detected in the pyridine treated CdSe composite. The HDA–TOPO–TOP CdSe mixed with the polymer in the same weight ratio also shows an LESR signal with the same g-factor (dashed curve). The intensity is approximately twice as small as in the composites with NC without a HDA–TOPO–TOP shell. Note: we did not observe any ESR signals in pure OC1C10-PPV, CdSe and InP with and without optical excitation, and this indicates a high quality of the materials with only few paramagnetic defects. ESR and LESR signals were detectable in colloidal InP at low temperatures [28]. Therefore, we conclude that the LESR
168
Photoinduced charge transfer in composites of conjugated polymers and semiconductor nanocrystals
|
20 |
|
3,5 |
|
|
|
|
|
|
|
|
|
|
|
|
3,0 |
|
|
|
|
|
|
|
|
|
|
|
4 |
2,5 |
|
|
|
|
|
|
|
|
|
|
18 |
/10 |
2,0 |
|
|
|
|
|
|
|
|
|
|
T |
|
|
|
|
|
|
|
|
|
|
|
|
|
1,5 |
|
|
|
|
|
|
|
|
|
|
|
|
∆T/ |
|
|
|
|
|
|
|
|
|
|
|
|
1,0 |
|
|
|
|
|
|
|
|
|
|
|
|
- |
|
|
|
|
|
|
|
|
|
|
|
|
|
|
|
|
|
|
|
|
|
|
|
4 |
16 |
|
0,5 |
|
|
|
|
|
|
|
|
|
10 |
|
0,00 |
|
|
|
|
|
|
|
|
|
|
|
|
50 |
100 |
150 |
200 |
250 |
300 |
|
|
|
||
/ |
|
|
|
|
|
T / K |
|
|
|
|
|
|
-∆T/T |
|
|
|
|
|
|
|
|
|
|
|
|
14 |
|
|
|
|
|
|
|
|
|
|
|
|
|
|
|
|
|
|
|
|
|
|
|
|
x 3 |
|
12 |
|
|
|
|
|
|
|
|
|
|
|
|
10 |
|
|
|
|
|
|
|
|
|
|
|
|
|
0 |
|
50 |
|
|
100 |
|
150 |
200 |
250 |
300 |
|
|
|
|
|
|
|
|
|
T / K |
|
|
|
Figure 7. Temperature dependence of the LE (down triangles) and HE PIA peaks (up triangles) in InP (pyridine): OC1C10-PPV composites. I = 6 mW cm−2, ν = 80 Hz. Inset: temperature dependence of LE (diamonds) and HE (open circles) PIA peaks in OC1C10-PPV–PCBM composites.
signal found by us is due to a photoinduced electron transfer between conjugated polymer and NC and originates from positive polarons. The TOPO–TOP shell acts as a dielectric barrier, and therefore reduces the probability of the event. The studies performed on PPV blended with fullerenes show the occurrence of a second signal, which is due to the radical anion (electron) on a fullerene molecule [15, 16]. Such conclusions could be drawn because of the g-factor difference for radical cations on a polymer chain (g > 2) and radical anions on fullerenes (g < 2), the latter being a feature of fullerenes, and is due to the spin–orbit coupling. In the InP NC, a weak lightinduced ESR signal located at g = 2.001 from the delocalized hole in the NC core, as well as a signal from the electron adduct (electron injected to NC from a strong reducing agent sodium biphenyl and trapped by the surface state) at g = 2.055, were detected [28]. These LESR signals were detectable in the temperature range below 8 K (for the hole), and below 150 K (for the electron), and are therefore not visible at room temperature as in our case. However, these signals would strongly overlap with the positive polaron LESR signal due to the close g-values. The microwave power and temperature dependence measurements down to 100 K did not reveal any new hidden structures in the NC polymer blends. We conclude that under LESR conditions, predominantly positive polarons on the polymer chain can be detected. Further ESR studies at higher microwave frequencies may clarify the fate of electrons on the NC. In particular, the photoinduced electron state at g = 2.055 might be important for our conclusions, as it was assumed to be at <0.7 eV below the conduction band of the InP quantum dot [28].
By fixing the magnetic field at resonance position, it is possible to study the time evolution of a LESR signal after switching off the optical excitation (see inset to figure 8). Even after several hundreds of seconds, the LESR signal does not disappear completely. This indicates clearly the presence of the very long lived photogenerated polarons, recombining with trapped electrons on the surface of the NC.
4. Conclusions
We studied the photoinduced charge transfer of CdSe (InP)- OC1C10-PPV composites by means of PL quenching, photoinduced absorption and light-induced electron spin resonance techniques. Strong PL quenching is observed in all investigated samples indicating the possibility of electron transfer, though by no means proving it alone. The PIA spectrum revealed two distinct bands at 0.31 and 1.34 eV (double peak). The LE peak is found to be a superposition of two signals, originating from the positive polarons on the polymer chain and from the trapped electrons on the NC, whereas the HE peak is solely due to positive polarons. We did not find any difference in the frequency behaviour for those two bands, therefore, a common relaxation mechanism (and the lifetime), namely a mutual recombination of electrons on NC with positive polarons on the polymer chain via back transfer, is anticipated. A broad distribution of lifetimes is characteristic for dispersive (diffusive) recombination processes with fractional power frequency dependence (γ ranging between 0.6 and 0.75, see table 1). The HDA– TOPO–TOP shell on NC reduced the electron transfer, but prevented it completely only in the case of TOPO–TOP–InP based composites, where no charge transfer was found. We therefore interpret the latter observation as energy transfer between conjugated polymer and NC. Finally, the LESR provides evidence of an electron transfer rather than energy transfer. The g-factor of the signal is consistent with the cationic origin of OC1C10-PPV radicals. The LESR signal is sensitive to NC surface coating, being smaller in blends with the HDA–TOPO–TOP coated CdSe surface and completely absent in blends with TOPO–TOP–InP. The time evolution of the LESR signals after switching off the optical excitation reveals the formation of very long living trapped charges.
169
M Pientka et al
|
|
LESR Intensity / a.u. |
light on |
|
|
|
|
a.u. |
|
|
|
|
light off |
|
|
/ |
|
|
|
|
|
|
|
LESR intensity |
|
0 |
500 |
1000 |
1500 |
2000 |
2500 |
|
|
|
Time / s |
|
|
||
|
|
|
|
|
|
|
|
3340 |
3350 |
3360 |
|
|
3370 |
||
|
|
B / G |
|
|
|
|
|
Figure 8. LESR spectra of CdSe (pyridine): OC1C10-PPV and CdSe–HDA–TOPO–TOP: OC1C10-PPV nanocomposites. T = 293 K. λexc = 514 nm. Inset: temporal evolution of the LESR signal in the CdSe (pyridine): OC1C10-PPV nanocomposites.
Acknowledgments
The authors gratefully thank E Ehrenfreund (Technion, Israel)
¨
and R Osterbacka (Åbo Akademi University, Finnland) for valuable comments on recombination mechanisms, and J C Hummelen (RUG, The Netherlands) for providing PCBM. Many thanks go to the following persons for their contributions in various discussions and technical assistance: J Wisch, S Boger,¨ J Kolny, Z Chiguvare, I Riedel, E von Hauff, H Koch and J Parisi (University of Oldenburg). DM is a Fellow of Hanse-Wissenschaftskolleg (Delmenhorst, Germany).
References
[1]Alivisatos A P 1996 Science 271 933
[2]Klein D, Roth R, Lim A K L, Alivisatos A P and McEuen P L 1997 Nature 389 699
[3]Klimov V I, Mikhailovsky A A, Xu Su, Hollingworth J A, Leatherdale C A, Eisler H-J and Bawendi M G 2000
Science 290 314
[4]Colvin V L, Schlamp M C and Alivisatos A P 1994 Nature
370 354
[5]Lee J, Sundar V C, Heine J R, Bawendi M G and Jensen K F 2000 Adv. Mater. 12 1102
[6]Gaponik N P, Talapin D V, Rogach A L and
Eychmuller¨ A 2000 J. Mater. Chem. 10 2163
[7]Greenham N C, Peng X and Alivisatos A P 1996 Phys. Rev. B 54 17628
[8]Huynh W U, Dittmer J J and Alivisatos A P 2002 Science 295 2425
[9]Huynh W U, Dittmer J J, Teclemariam N, Milliron D J, Alivisatos A P and Barnham K W J 2003 Phys. Rev. B 67 115326
[10]Shaheen S E, Brabec C J, Padinger F, Fromherz T, Hummelen J C and Sariciftci N S 2001 Appl. Phys. Lett. 78
841
Brabec C J, Sariciftci N S and Hummelen J C 2001 Adv. Funct. Mater. 11 15
[11] Sariciftci N S, Smilowitz L, Heeger A J and Wudl F 1992
Science 258 1474
Brabec J, Zerza G, Cerullo G, De Silvestri S, Luzatti S, Hummelen J C and Sariciftci N S 2001 Chem. Phys. Lett.
340232
[12]Padinger F, Rittberger R and Sariciftci N S 2003 Adv. Funct. Mater. 13 85
[13]Weller H 1993 Angew. Chem. 105 43 Eychmuller¨ A 2000 J. Phys. Chem. B 104 6514
Kershaw S V, Harrison M, Rogach A L and Kornowski A 2000 IEEE 6 3
[14]Ginger D S and Greenham N C 1999 Phys. Rev. B 59 10622
[15]Dyakonov V, Zoriniants G, Scharber M, Brabec C J,
Janssen R A J, Hummelen J C and Sariciftci N S 1999 Phys. Rev. B 59 8019
[16]De Ceuster J, Goovaerts E, Bouwen A, Hummelen J C and Dyakonov V 2001 Phys. Rev. B 64 195206
[17]Lutsen L J, Van Breemen A J, Kreuder W, Vanderzande D J M
and Gelan J M J V 2000 Helv. Chim. Acta 83 3113
Lutsen L J, Adriaensens P, Becker H, Van Breemen A J, Vanderzande D and Gelan J 1999 Macromolecules 32 6517
[18] Talapin D V, Rogach A L, Kornowski A, Haase M and Weller H 2001 Nano Lett. 1 207
Talapin D V, Gaponik N, Borchert H, Rogach A L,
Haase M and Weller H 2002 J. Phys. Chem. B 106 12659
[19]Micic O I, Sprague J R, Curtis C J, Jones K M, Machol J L, Nozik A J, Giessen H, Fluegel B, Mohs G and Peyghambarian N J 1995 J. Phys. Chem. 99 7754
[20]Murray C B, Norris D J and Bawendi M G 1993 J. Am. Chem. Soc. 115 8706
[21]Gomes Da Costa P and Conwell E M 1993 Phys. Rev. B 48 1993
[22]Barth S and Bassler¨ H 1997 Phys. Rev. Lett. 79 4445
[23]Wei X, Vardeny Z V, Sariciftci N S and Heeger A J 1996 Phys. Rev. B 53 2187
[24]Dellepiane G, Cuniberti C, Comoretto D, Musso G F, Figari G, Piaggi A and Borghesi A 1993 Phys. Rev. B 48 7850
[25]Epshtein O, Eichen Y, Ehrenfreund E, Wohlgenannt M and Vardeny Z V 2003 Phys. Rev. Lett. 90 046804
[26]Cole K S and Cole R H 1941 J. Chem. Phys. 9 341
[27]Epshtein O, Nakhmanovich G, Eichen Y and
Ehrenfreund E 2001 Phys. Rev. B 63 125206
[28] Micic O I, Nozik A J, Lifshitz E, Raijh T, Poluektov O G and
Thurnauer M C 2002 J. Phys. Chem. B 106 4390
170