

TPA Dc. 2014 BOOK 3_CLIMATE CHANGE
.pdfThe main issue: Constraints on CO2 and CH4 Emissions
The main culprits for global warming:
Water in the atmosphere (vapor or dropplets)
CO2: the focus of last 10 years
CH4: an underestimated culprit (methodology issues)
The potentiel constraint on emissions:
Taxation systems
Emission prices (CO2 markets)
Emission Trading System (ETS) established by UE in 2003, but CO2 price at 6 €/t at end 2012!
The major issue:
What marginal and average costs in 2010 – 2020 – 2050 for CO2 and CH4 emissions ?
20 to 50 S/tCO2 or 200 to 500 $/t ? Are CCS estimated costs relevant ?
61 |
Book 3 - GHG |

Agenda for Climate Change negotiations
11 December 1997: Kyoto Protocol Signature
16 February 2005: Kyoto Protocol Effective
2008-2012 : Kyoto Protocol 1st commitments period
2013-2020 : Kyoto Protocol 2nd commitments period
December 2010: Cancun Agreement (COP 16)
2012: Doha (Amendments)
2015: Paris (COP 21, Agreement to be in force as of 2020, based on 5th GIEC report)
Nota: COP : Conference Of the Parties |
62 |
Book 3 - GHG |
|

International/UE CO2 markets
2005-2007 (EU-ETS Phase 1): Pilot phase/Definition of quotas
2008-2012 (EU-ETS Phase 2) : 79 GT AAU’s allocated worlwide, surplus of 13 GT. 2,1 GT allocated yearly to EU.
In Europe, Establisment of ETS (EU-Emission Trading System)
During Kyoto 1, 8 markets have been created: Korea-China, EU-Switzerland, Australia-New-Zeland, California-Quebec, Kazakhstan, South America.
EU: Inclusion of civil aviation in quotas allocations as from 2012
2013-2020 (EU-ETS Phase 3) : 2,0 GT allocated yearly to EU
1,2 GT allocated yearly to other countries
Price of CO2:
2005: 30 €/T
2008: 15 €/T, maximum 27 €/T
2011: 8 €/T, maximum 23 €/T 2012: 8 €/T, maximum 22 €/T 2013: 5 €/T
AAU: Assigned Amount Unit |
63 |
Book 3 - GHG |
|
|

CO2 UE-ETS price evolution since 2008
EUA: European Union Allowances
CER: Certified Emissions Reduction
64 |
Book 3 - GHG |

International CO2 markets Present situation & projects
Source: IEA WEO 2013 |
65 |
Book 3 - GHG |
|
|
|

Lack of confidence in the collective objective to reduce the GHG emissions and lack of credibility on the « price » of CO2 discourage large investments to mitigate emissions
66 |
Book 3 - GHG |
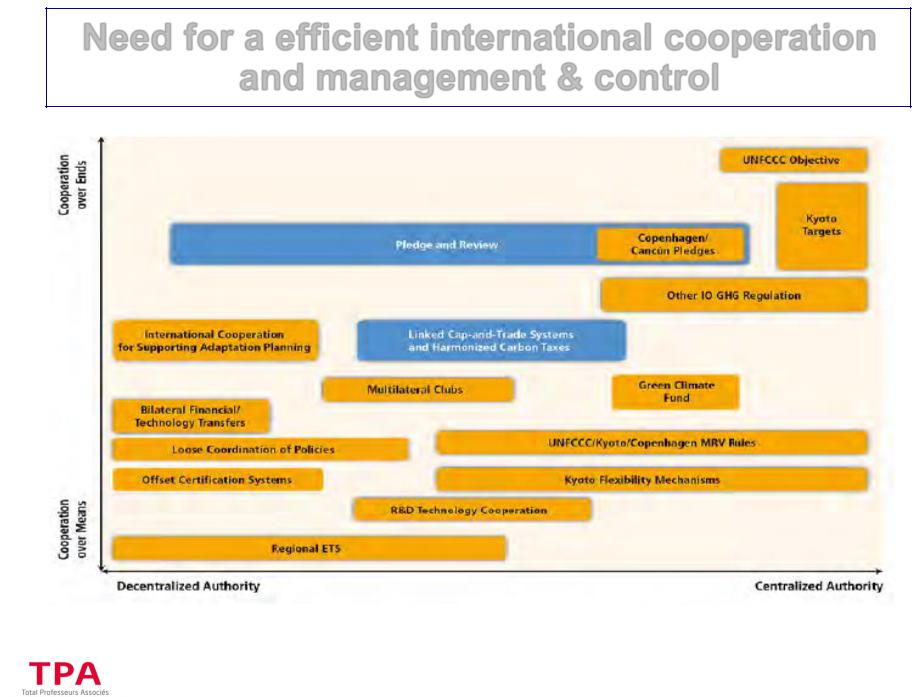
Need for a efficient international cooperation and management & control
Source: IPCC 5th Assessment Synthesis Report November 2014 |
|
67 |
Book 3 - GHG |

Need for a efficient international cooperation and management & control
Source: IPCC 5th Assessment Synthesis Report November 2014 |
|
68 |
Book 3 - GHG |

Levelized Cost of Electricity the Impact of a CO2 penalty pricing
69 |
Book 3 - GHG |

Cost price of Electricity produced by the various types of Power Plants (Reference: European sites, mean values)
(€/MWh) 2012 |
|
Nuclear |
|
Nuclear |
|
Natur. Gas |
Heavyfuel |
Coal |
Coal |
|
Coal |
|
Wind |
|
Wind |
Solar |
|
|
Gener. 2 |
|
NewEPR |
|
CCGT |
|
Convent. |
IGCC |
|
IGCC & CCSOnshore |
|
Offshore |
PV |
||
Capex |
|
|
34 |
|
56 |
10 |
16 |
28 |
|
33 |
|
47 |
|
62 |
99 |
153 |
Fuel cost |
|
|
8 |
|
7 |
63 |
95 |
33 |
|
35 |
|
37 |
|
0 |
0 |
0 |
Opex (including maintenance) |
|
13 |
|
13 |
3 |
3 |
7 |
|
10 |
|
12 |
|
18 |
35 |
29 |
|
Total cost excl.CO2cost |
|
55 |
|
75 |
75 |
113 |
68 |
|
77 |
|
96 |
|
80 |
134 |
182 |
|
CO2price 25$/t |
|
|
0 |
|
0 |
8 |
14 |
17 |
|
13 |
|
12 |
|
0 |
0 |
1 |
CO2price 100$/t |
|
|
1 |
|
1 |
25 |
42 |
50 |
|
39 |
|
6 |
|
0 |
0 |
3 |
Total cost CO2cost |
25$/t |
|
55 |
|
76 |
84 |
127 |
84 |
|
90 |
|
108 |
|
80 |
134 |
183 |
Total cost CO2cost 100$/t |
|
57 |
|
77 |
109 |
169 |
134 |
|
129 |
|
113 |
|
80 |
135 |
185 |
|
CCGT: Combined-Cycle Gas Turbine |
|
|
|
|
|
|
|
|
|
|
|
|
||||
IGCC: Integrated Gasification Combined-Cycle |
|
|
|
|
|
|
|
|
|
|
||||||
CCS: Carbon Capture & Storage |
|
|
|
|
|
|
|
|
|
|
|
|
||||
Note: Coal IGCC & CCS includes 10€/MWh for CO2 transport & storage |
|
|
|
|
|
|
|
|||||||||
|
|
|
|
|
|
|
70 |
|
|
|
|
|
Book 3 - GHG |
|||