

TPA Dc. 2014 BOOK 3_CLIMATE CHANGE
.pdfCO2 Emissions per capita & per country
Note: Areas in figures are equal to total emissions
Source: IEA WEO 2012
41 |
Book 3 - GHG |
2
Economic consequence for energy and industries
42 |
Book 3 - GHG |
IEA 2014 World Energy Outlook
The three Scenarios
«Current Policies Scenario (CPS) » = Implementation, without changes of policies and measures enacted or adopted by mid-2014.
«New Policies Scenario (NPS) » = IEA Central Scenario:
Existing policies maintained. Recently announced commitments and plans implemented in a cautious manner.
« 450 Scenario (450S) » = Consistent with the long term 2° C limit goal through limitation of GHG concentration at 450 ppm, with 50% probability. Means agressive plans to limit CO2 emissions. For the period to 2020, more vigourous policies must be put in place in accordance with the Cancun agreements. As from 2020, CO2 pricing is assumed to be effective and subsidies on fossil fuels to disappear.
43 |
Book 3 - GHG |
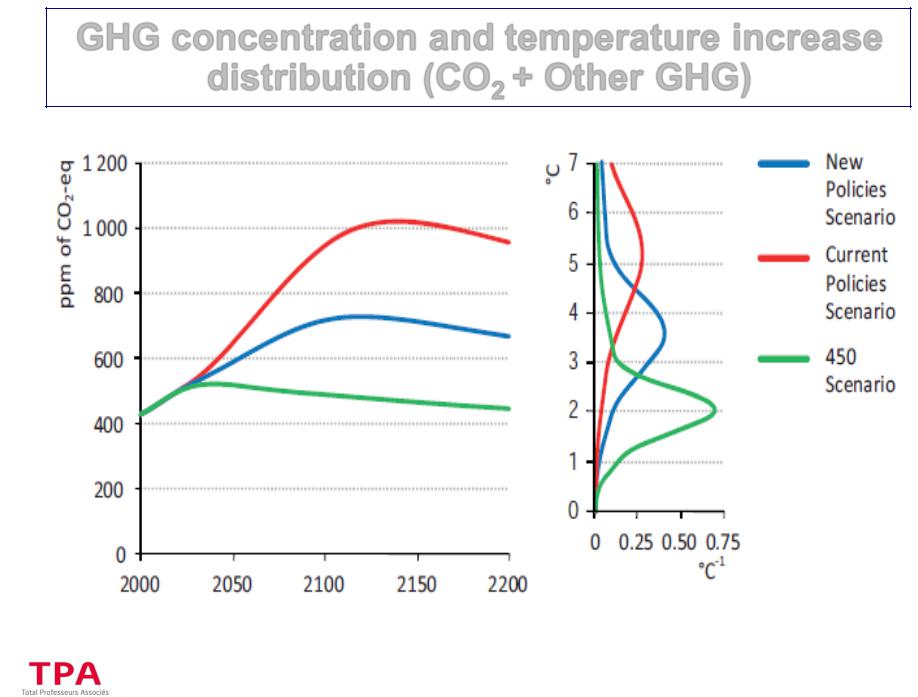
GHG concentration and temperature increase distribution (CO2 + Other GHG)
Source; IEA WEO 2012, Model from Rogelj, Meinshausen & Knutti
44 |
Book 3 - GHG |
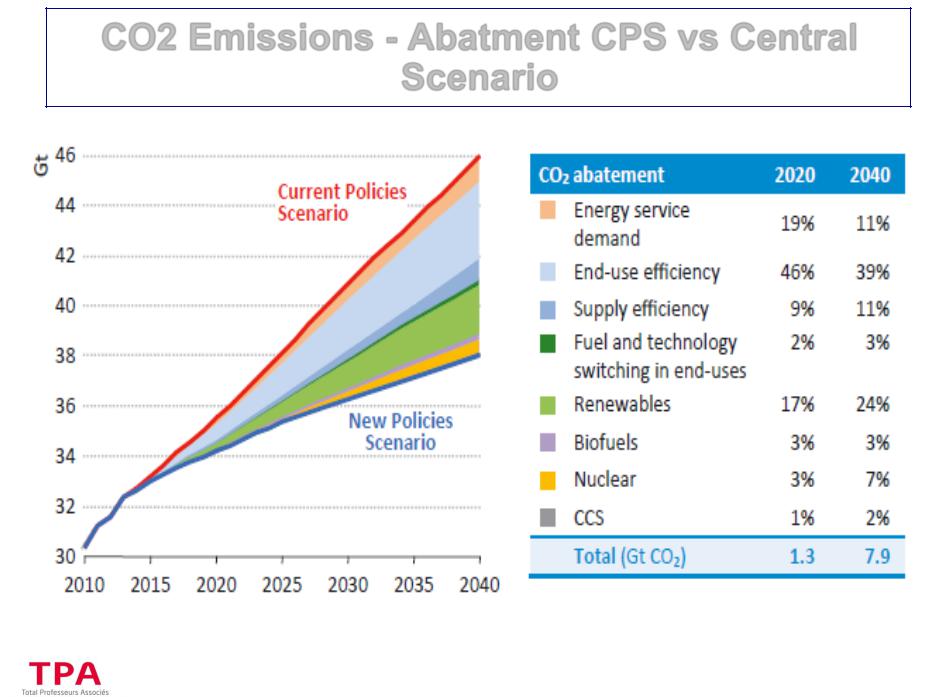
CO2 Emissions - Abatment CPS vs Central Scenario
Source: IEA WEO 2014 |
45 |
Book 3 - GHG |
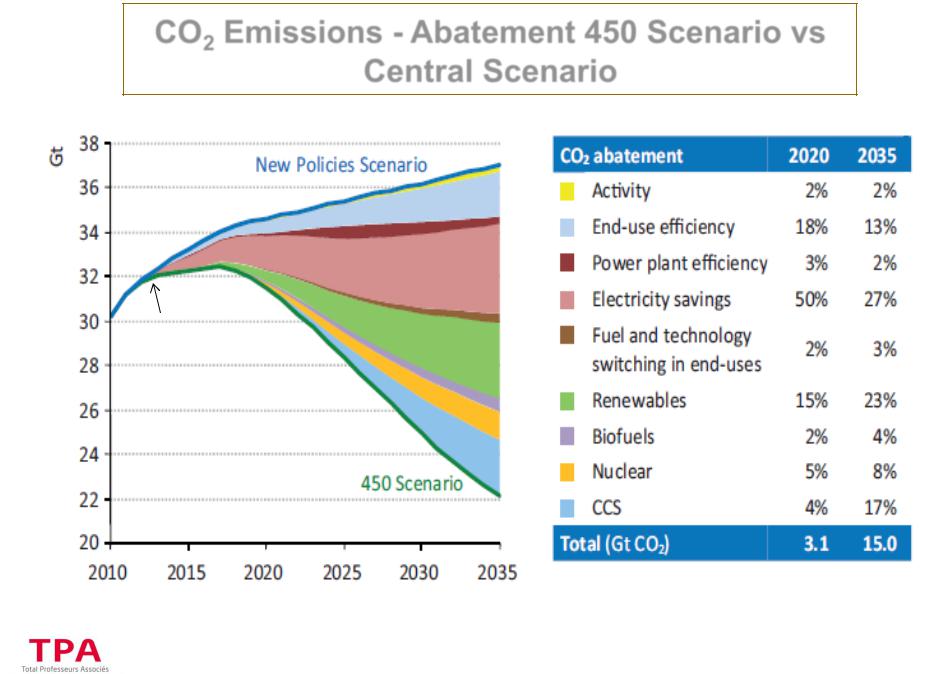
CO2 Emissions - Abatement 450 Scenario vs Central Scenario
660 ppm, +3,6°C
400 ppm
31,6 GtCO2 in 2014
450 ppm, +2°C
Source: IEA 2012 World Energy Outlook
46 |
Book 3 - GHG |
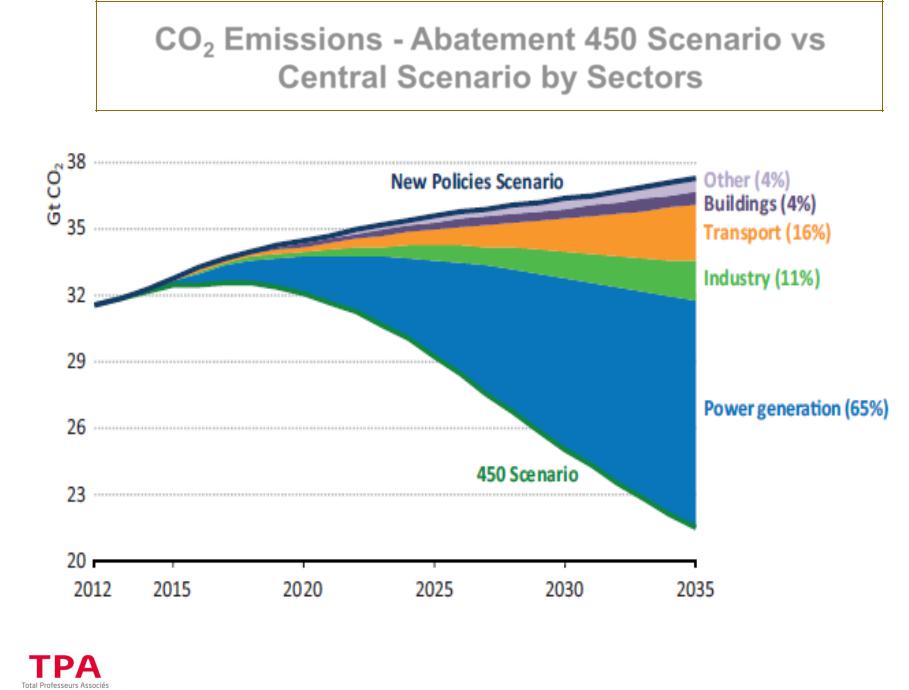
CO2 Emissions - Abatement 450 Scenario vs Central Scenario by Sectors
Source: IEA WEO 2014 |
47 |
Book 3 - GHG |
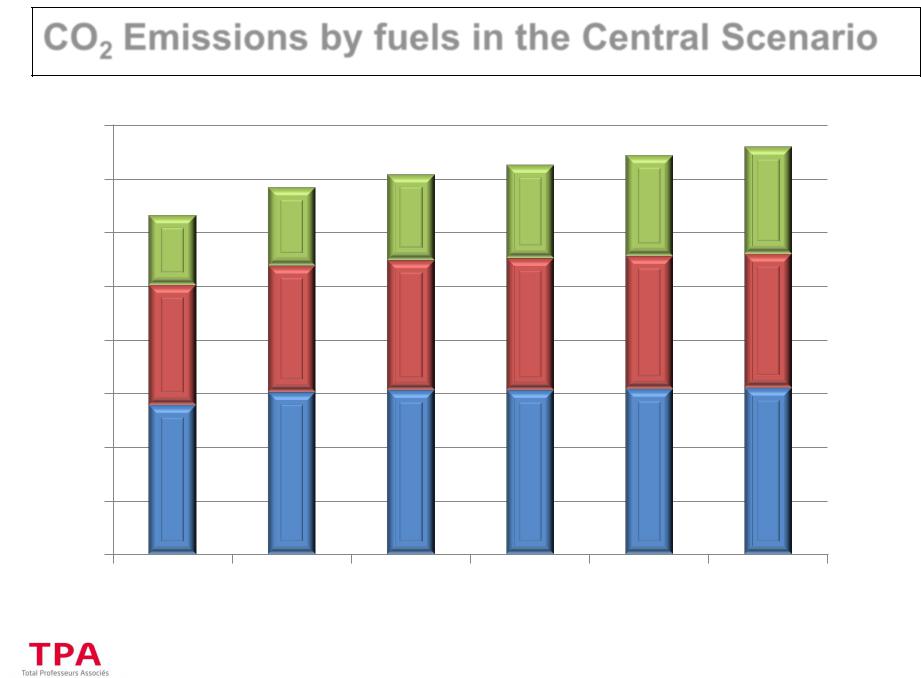
CO2 Emissions by fuels in the Central Scenario
(Gt CO2)
40,0
35,0
30,0
25,0
20,0
15,0
10,0
5,0
0,0
2012 |
2020 |
2025 |
2030 |
2035 |
2040 |
 Gas
Gas
 Oil
Oil
 Coal
Coal
Source: Data from IEA 2014 |
48 |
Book 3 - GHG |
|
|
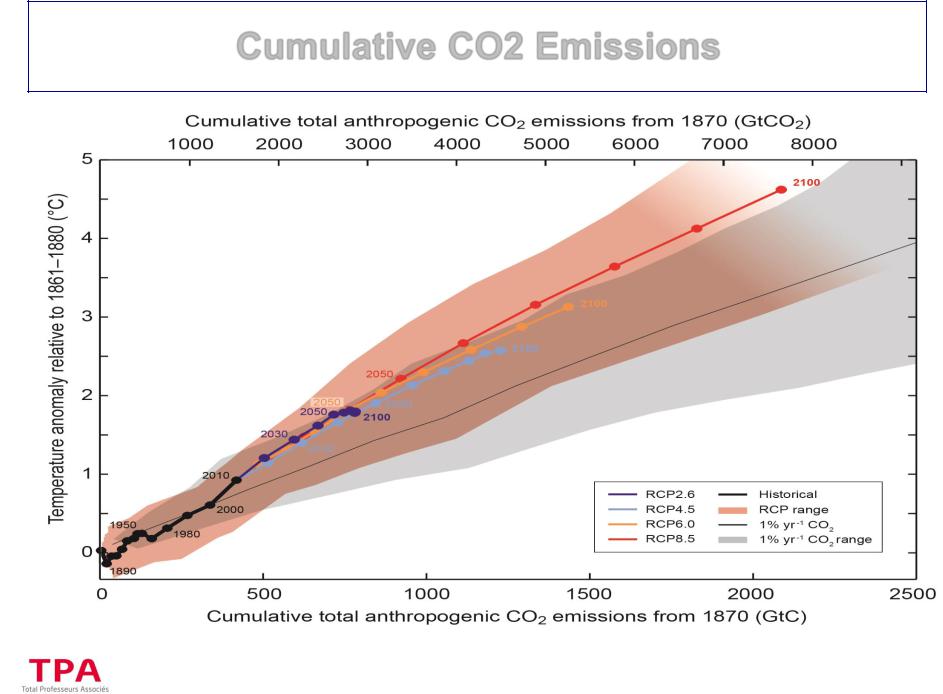
Cumulative CO2 Emissions
49 |
Book 3 - GHG |
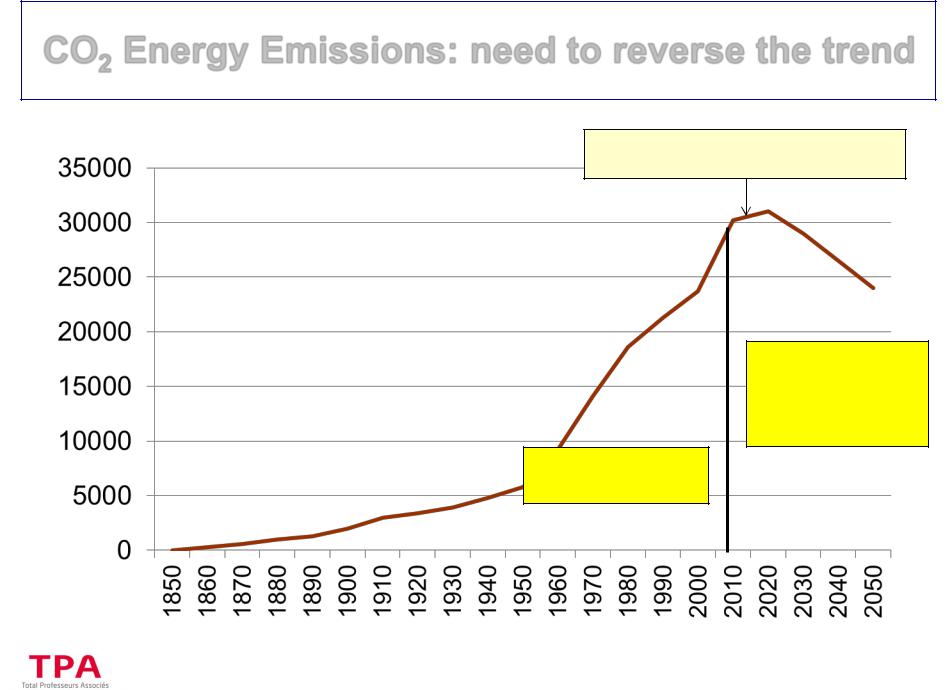
CO2 Energy Emissions: need to reverse the trend
(MtCO2)
New protocol on climate in 2015, involving all countries, effective 2020?
1 900 GtCO2 from 1850 to 2011
?
Carbon budget to respect +2°C = 1000 GtCO2 from 2011 to 2050
50 |
Book 3 - GHG |