

Global Gas Security Review 2019 |
1. Update on LNG market flexibility metrics |
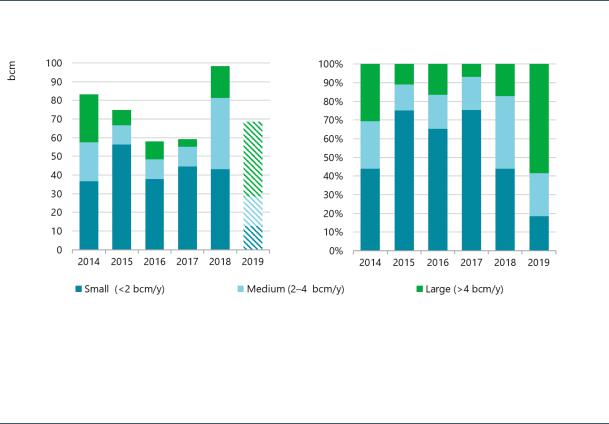
Figure 20. Contracts signed each year by volume (2014–19)
IEA, 2019. All rights reserved.
Note: Contracts concluded and linked to projects that have already taken FID. Sales from portfolios are also included. 2019 data include only the information available at the time of writing.
Source: IEA analysis based on ICIS (2019), ICIS LNG Edge, https://lngedge.icis.com/ (subscription required).
Medium-sized and large contracts rebounded in 2018 thanks to new projects, although small contracts still play a significant role in contracting activity, accounting for over 56% of contracted volumes.
Portfolio players and flexibility
While long-term contracts are still crucial for securing the funding for new liquefaction facilities (and even for exploration and production), customers increasingly require greater flexibility in volumes and destinations. Portfolio players procure a mix of LNG supplies from various projects and sellers, and resell to customers according to their requirements. They sell much of this via term contracts, but are also active in selling spot cargoes. Therefore, they have both sell (export) and buy (import) contracts available to manage their own cargoes and optimise their return, thereby providing a wide range of flexibility for their customers. Such flexibility is often valued at a premium, as the LNG projects themselves typically have limited uncontracted or excess capacity volumes to provide flexibility (IEA, 2018). This kind of market player has become increasingly important as the number of LNG buyers has grown significantly in recent years. Some of the new buyers experiencing significant growth have a different profile than traditional buyers such as Japan and Korea. Thanks to their reselling activity, portfolio players are able to tailor deals that meet the requirements that these new consumers require.
The number of companies selling LNG from their portfolios has grown substantially since 2010, with progressively more traditional companies creating their own portfolio and becoming portfolio players. National companies that have traditionally sold their gas production through long-term agreements tied to specific projects, for example Gazprom, signed export contracts for LNG sourced from their portfolio of projects in 2018 and 2019, i.e. with no fixed source.
This section analyses portfolio player contract trends. For the purpose of this analysis, the only contracts considered are those that have been sourced for or from portfolios, i.e. excluding contracts that have been sourced directly from named projects.
PAGE | 25
IEA. All rights reserved.
Global Gas Security Review 2019 |
1. Update on LNG market flexibility metrics |
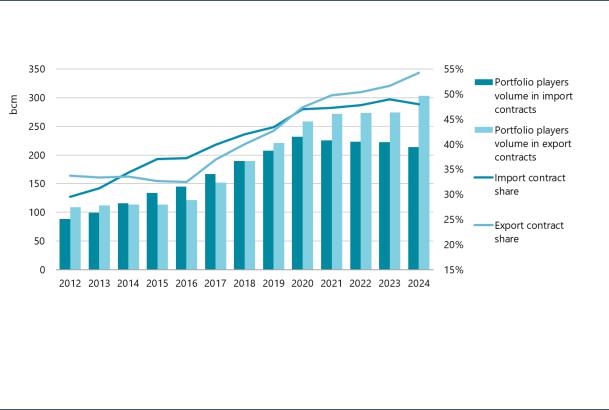
In 2018, export volumes supplied by portfolio players represented 40% of total export volumes. Based on current contracts, this share is expected to grow to over 54% of total export volumes by 2024 (Figure 21). Import volumes attributable to portfolio players are also projected to continue growing, increasing from 42% in 2018 to 48% in 2024.
Figure 21. Portfolio players’ volumes and market share of import and export contracts (2012–24)
Note: It is assumed that expiring contracts are not renewed, with no specific assumption on any contract yet to be signed. Source: IEA analysis based on ICIS (2019), ICIS LNG Edge, https://lngedge.icis.com/ (subscription required).
Portfolio player contracted volumes account for an increasing share of the market due to their contracting activity associated with the higher pace of FIDs being taken, as reflected in their share of export contracts increasing to 54% by 2024.
Contract data show that from 2018 portfolio players have contracted to sell more LNG than they have contracted to secure for their own portfolios (i.e. the volume of export contracts exceeds that of import contracts). Portfolio players have reduced their total export volumes via new contracts from 2015 levels. During 2018 volumes associated with newly concluded contracts for LNG exports from portfolio players decreased by 17% compared with the previous year (Figure 22). This reduction was even more dramatic when analysing the number of contracts in 2018. The number of concluded contracts for LNG sourced from portfolio players fell by more than 50% compared to 2017 levels, mainly because of a 90% reduction in short-term agreements. Despite this important decrease, portfolio players’ concluded export contracts still represent 33% of all contracts linked to projects that have already taken FID.
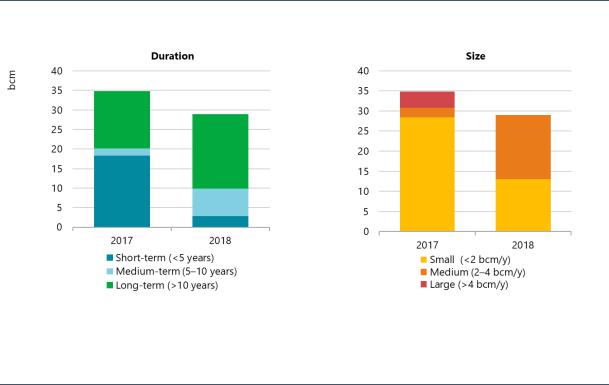
Concluded contracts for LNG to be supplied by portfolio players have increased in length and contract volume. During 2017, low-volume contracts (less than 2 bcm/y) represented 82% of the concluded contracts for LNG to be provided by portfolio players. In 2018, this share was only 45%. Contrary to expectations, portfolio players’ activity and increased participation have not meant the end of long-term contracts. Long-term contracts (more than ten years) for LNG to be supplied by portfolio players increased by almost 30% compared to 2017 levels, representing 66% of new contracts in 2018 (Figure 22).
PAGE | 26
IEA. All rights reserved.
Global Gas Security Review 2019 |
1. Update on LNG market flexibility metrics |
Figure 22. Duration and size of contracts signed for LNG to be supplied by portfolio players (2017 and 2018)
Source: IEA analysis based on ICIS (2019), ICIS LNG Edge, https://lngedge.icis.com/ (subscription required).
The volume of long-term portfolio player export contracts increased by almost 35% in 2018, representing 66% of contracts they signed that year despite a year-on-year decrease of 17% in overall portfolio player export contracts.
During 2018 and 2019 so far, portfolio players have been focusing on rebuilding their portfolios by increasing the total volume of import contracts signed, in order to compensate for the gap between volumes committed and the volumes available in their portfolios in the long term. These contracts alone accounted for the 45% of new contracts linked to projects that have already taken FID. In lieu of signing SPAs, portfolio players have taken equity stakes in projects, having been offered equity-lifting schemes such as the one used by LNG Canada. In one way or another, at least one portfolio player participated in all liquefaction projects that have taken FID during 2018 and the year to date.
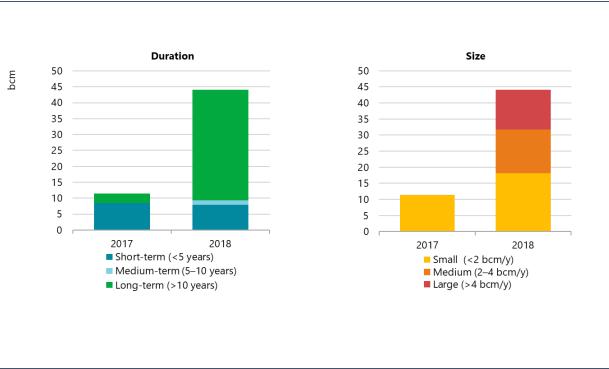
This rebuilding process clearly reflects features of the import contracting activity conducted by portfolio players. In 2018, most of the new contracts for LNG to be supplied to portfolio players were long-term agreements (more than ten years) (Figure 23). Regarding volume, contracts larger than 2 bcm/y represented almost 59% of the total volume signed by portfolio players and linked to projects that have already taken FID. This is a large and rapid change from the past – during 2017, 100% of the contracts concluded were for less than 2 bcm/year.
Most contracted volumes sourced for portfolio players came from North America (53%), followed by the Middle East (13%), Africa (8%), and Russia (6%). These longer and larger contracts are intended to provide available volumes for portfolio players to use in the coming years, when many of the projects with which they are connected come online.
PAGE | 27
IEA. All rights reserved.
Global Gas Security Review 2019 |
1. Update on LNG market flexibility metrics |
Figure 23. Duration and size of contracts signed for LNG to be supplied to portfolio players, 2017 and 2018
Source: IEA analysis based on ICIS (2019), ICIS LNG Edge, https://lngedge.icis.com/ (subscription required).
The almost fourfold increase in the volume of portfolio player import contracts is nearly all in respect of longterm contracts, pursued for the rebuilding of portfolios.
Analysis of contract flexibility
One way to assess flexibility on the LNG market is by analysing the share of contracts with destination clauses. Destination restrictions have an important impact on market liquidity, limiting demand response to price signals.
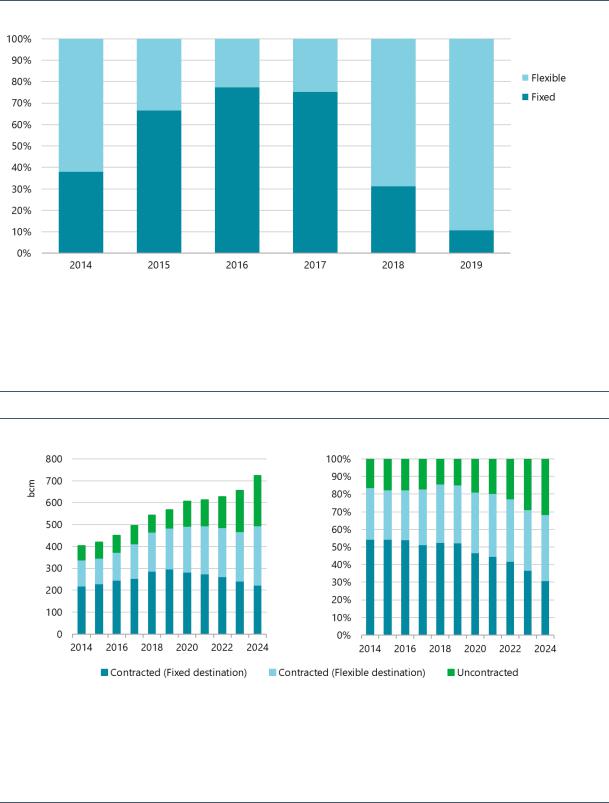
Unlike the current process of rebuilding portfolios, 2016 and 2017 exemplified how a period of low FID activity can affect the flexibility of contracts signed. In these two years, most contracting activity by portfolio players involved reselling the volumes in their portfolios through fixeddestination contracts. As highlighted in previous sections, 2018–19’s new wave of liquefaction investment is accompanied by flexible contracts with greater volumes and longer terms. The share of contracts signed with a flexible destination increased to 69% last year, becoming the majority of all deals signed (Figure 24). That share has increased to 89% of volumes so far in 2019.
Volumes flowing into the market under flexible conditions are increasing. This results from the increasing role of portfolio players and new capacity coming online, contracted with terms and conditions that differ from legacy projects.
Figure 25 presents an analysis that assumes expiring contracts are not renewed and with no specific assumption on contracts yet to be signed (only including SPA and equity offtake contracts). Even though new contracts were mostly signed under flexible conditions, fixed destination contracts still accounted for the majority of the volumes in the market during 2018, representing 53% of the total volumes. Flexible destination volumes represented 33% of the total volumes traded in the market, while uncontracted capacity represented 14%. It is important to highlight that those uncontracted LNG volumes – coming either from new projects or from the expiry of existing contracts – could be available to be contracted under fixed or flexible terms.
PAGE | 28
IEA. All rights reserved.
Global Gas Security Review 2019 |
1. Update on LNG market flexibility metrics |
Figure 24. Contracts signed each year by destination clause (2014–19)
Notes: Based on the volumes of contracts concluded and linked to projects that have already taken FID. Sales from portfolios are also included. 2019 data include only the information available at the time of writing. Destination flexibility is determined using proprietary data based on ICIS LNG Edge supplemented with public data. Where data is unavailable, destination flexibility is interpreted from contract sales basis, agent profile, and market situation.
Source: IEA analysis based on ICIS (2019), ICIS LNG Edge, https://lngedge.icis.com/ (subscription required).
Almost 70% of all contracts signed in 2018 have destination flexibility.
Figure 25. LNG export capacity by destination flexibility (2014–24)
Note: It is assumed that expiring contracts are not renewed, with no specific assumption on any contract yet to be signed. SPA and equity entitlement contracts only.
Source: IEA analysis based on ICIS (2019), ICIS LNG Edge, https://lngedge.icis.com/ (subscription required).
Fixed destinations continue to account for the majority of volumes in the market, although this is forecast to fall as new contracting activity reflects increased destination flexibility until 2024, when flexible volumes represent the largest share of the market.
On the basis described above for Figure 25, the period 2018–24 would show a total reduction in fixed destination volumes of 63 bcm due to the expiry of legacy contracts. Over the same period, LNG export contracts with flexible destination would add about 92 bcm, mostly from the United States. At the time of writing, the currently uncontracted volume would reach around 229 bcm by 2024, or
PAGE | 29
IEA. All rights reserved.