


Global Gas Security Review 2019 |
General annex |
For the month of January, spare import capacity in both Russian and Norwegian pipelines has been significantly decreasing since 2012, by over 80% by 2017. Norwegian export flows show a strong response to the seasonality of north-western European demand, with January’s spare import capacity significantly lower compared with the annual monthly average. Significantly, since 2015 spare import capacity from Norway directly to north-western Europe has virtually disappeared for the month of January, partly driven by the higher natural gas import requirements of the Netherlands. Moreover, in both 2017 and 2018 Norwegian spare capacity available to the United Kingdom in January fell to below 0.2 bcm.
Russian export flows appear to show less sensitivity to demand seasonality. This can be explained by a number of factors, including:
Gazprom’s large underground storage facilities located in north-western Europe, which allow the company to optimise its export flows.
The regulatory access issues surrounding the OPAL pipeline (which connects Nord Stream to the Central and Eastern European markets) until 2017.
Oil indexation, which prevailed until recently in some of Gazprom’s contracts (altering buyers’ nominations).
Nonetheless, the spare capacity in Russian pipelines fell below 1 bcm in January 2017, with no spare capacity left in the pipelines directly servicing north-western Europe, i.e. Nord Stream and Yamal.
This leaves LNG regasification facilities as the main holders of spare import capacity, ranging between 6 bcm and 7 bcm in January during 2013–18. In January 2019, spare regasification capacity fell below 4 bcm due to a large LNG influx into Europe, as incremental LNG supply could not be absorbed by other regions. This in turn drove up the utilisation rates of European regasification terminals.23 Nevertheless, 4 bcm per month (accounting for over 10% of gas demand) still represents, in principle, a considerable safety net in case of supply or demand shocks.
As highlighted in Global Gas Security 2018, timeliness remains a key issue when considering LNG imports. Last year’s analysis showed that in a best-case scenario it would take several days to import an additional cargo of LNG. This also means that LNG cannot be considered as a sole and immediate remedy for short-term system balancing in case of supply disruptions or demand shocks.
More immediate solutions for short-term balancing require either spare import pipeline capacity or midstream interconnectivity and storage flexibility, or a combination of them.
Midstream interconnectivity
Given the limited spare import pipeline capacity that north-western Europe has available, it is important to assess the current state of interconnectivity between country-level markets. Spare capacity in interconnectors can mitigate the impact of supply/demand shocks by the internal redistribution of gas flows and the optimisation of gas storage usage.
The evolving supply dynamics in the Netherlands and the United Kingdom have not only increased the overall import requirements of north-western Europe, but have also affected the volume and the pattern of flows within the region itself.
23 For a more detailed discussion of recent LNG market trends, refer to IEA (2019c).
PAGE | 56
IEA. All rights reserved.
Global Gas Security Review 2019 |
General annex |
The most significant impact has been on the Netherlands, which became a net importer of natural gas in 2018. The Dutch “gas roundabout” remains at the heart of the north-western European gas system, with interconnections built to all its surrounding markets (Belgium, Germany and the United Kingdom).
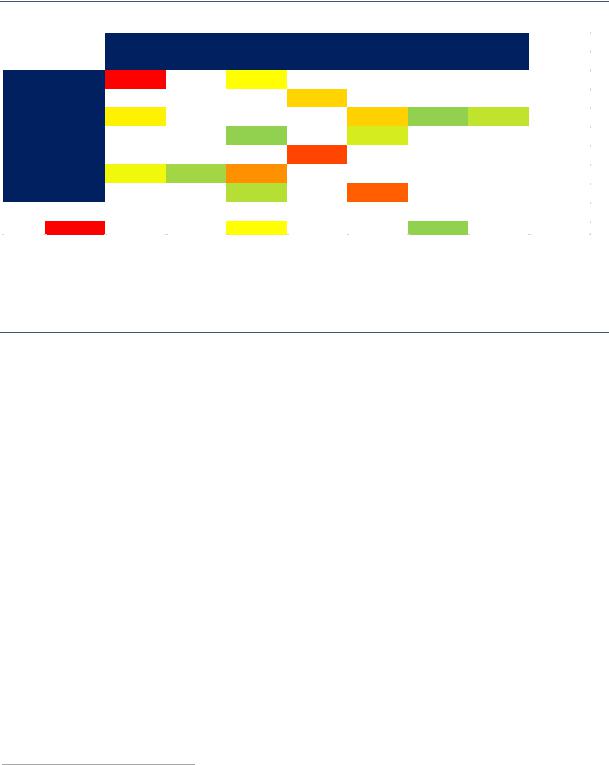
Figure 41 provides a matrix of the utilisation rates for the interconnections in north-western Europe in January 2019.
Figure 41. Utilisation of interconnections in north-western Europe, January 2019
|
|
|
|
|
From |
|
|
|
|
|
DE (H) |
BE (L) |
BE (H) |
NL (L) |
NL (H) |
FR (H) |
UK |
|
NL (H) |
91% |
|
36% |
|
|
|
|
|
BE (L) |
|
|
|
45% |
|
|
|
|
BE (H) |
39% |
|
|
|
46% |
0% |
15% |
To |
DE (H) |
|
|
0% |
|
22% |
|
|
|
DE (L) |
|
|
|
77% |
|
|
|
|
FR (H) |
31% |
5% |
60% |
|
|
|
|
|
UK |
|
|
12% |
|
71% |
|
|
High utilisation |
Medium utilisation |
Low utilisation |
Notes: BE = Belgium; DE = Germany; FR = France; NL = The Netherlands; UK = United Kingdom; (H) = H-gas; (L) = L-gas.
Sources: IEA (2019b), Gas Trade Flows, www.iea.org/gtf/; ENTSOG (2019), ENTSOG Transparency Platform, https://transparency.entsog.eu/.
The utilisation rates of north-western Europe’s interconnection show in most cases few capacity constraints even during periods of high natural gas demand.
The matrix indicates that most of the interconnectors do not have capacity constraints, with the notable exception of the major exit/entry points between Germany and the Netherlands, where the 91% utilisation rate suggests low spare capacity available during the peak month of the heating season, while import needs are rising in the near future.
The Netherlands has three main entry points. Norwegian natural gas is imported via the Emden terminal in Germany, feeding into the Dutch gas grid via an interconnector. Russian imports to the Netherlands need to transit via Germany through the Bunde/Oude Statenzijl interconnection. The Dutch gas grid is also connected to a number of German gas storage facilities used to balance the gas market in the Netherlands. There are two import interconnectors with Belgium; however, one of them (Zelzate) is used by Belgian shippers to access storage sites located in the Netherlands. This is likely to remain the case in the medium term because, for geological reasons, Belgium is unlikely to develop any significant gas storage facilities. The second interconnector (Zebra) allows actual import flows from Belgium, but has a rather limited capacity of 4 bcm/y.
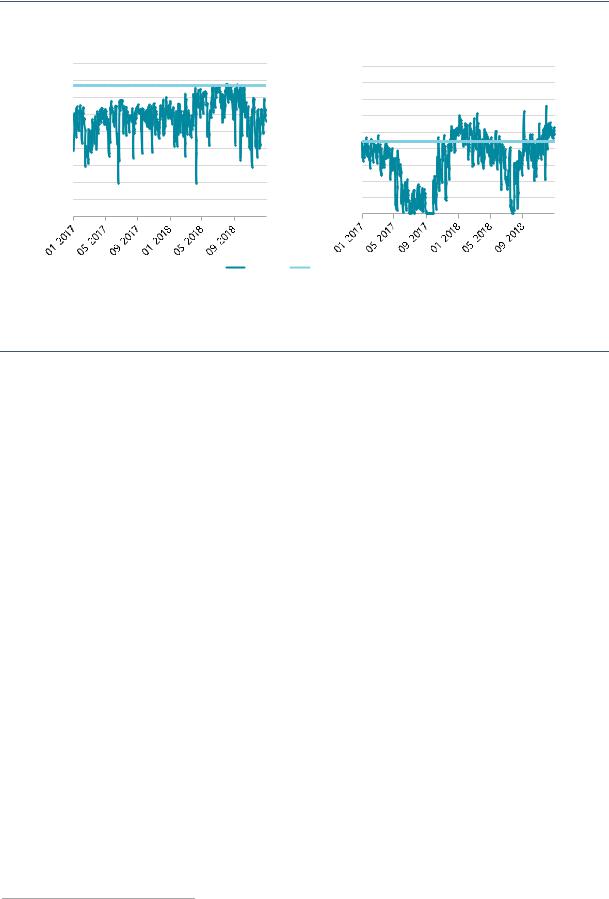
Altogether, the Netherlands has an import capacity of almost 50 bcm/y via these interconnections. Based on import flows24 in 2018, their estimated annual spare capacity was over 10 bcm (equal to almost one-quarter of annual Dutch gas consumption). However, when considering the distribution of these import flows, the abundance of spare capacity becomes less apparent. As shown in Figure 42, both the Emden and Bunde/Oude interconnections have been running close to and even above their firm technical capacities, particularly during the heating season. This also means that spare capacity in interconnections cannot be taken for granted, especially during periods of high demand.
24 Note that not all of these import flows are destined for the Dutch market. Some of them transit onto Belgium and France and others are converted into L-gas and then re-exported to meet the Netherlands’ L-gas export commitments to Belgium, France and Germany.
PAGE | 57
IEA. All rights reserved.
Global Gas Security Review 2019 General annex
Figure 42. Interconnector flows to the Netherlands, 2017–18
mcm/d |
90 |
90 |
|
Emden interconnector |
Bunde/Oude interconnector |
|
80 |
80 |
|
70 |
70 |
|
60 |
60 |
|
50 |
50 |
|
40 |
40 |
|
30 |
30 |
|
20 |
20 |
|
10 |
10 |
|
0 |
0 |
|
Flows |
Firm capacity |
Source: ENTSOG (2019), ENTSOG Transparency Platform, https://transparency.entsog.eu/.
The utilisation of interconnections feeding into the Dutch natural gas grid from Germany is saturated during periods of high demand, hence limiting the availability of spare capacity.
Considering the evolving natural gas production outlook in the Netherlands, as discussed in previous parts of this chapter, the country’s import requirements are set to increase in the medium term and potentially drive up the utilisation rates of these interconnectors. This indicates a need to increase the capacity of certain entry points to the Dutch natural gas network.
The BBL pipeline – connecting the Netherlands and the United Kingdom – became bidirectional on 1 July 2019, enabling natural gas imports into the Netherlands with an annual capacity of 5 bcm/y. However, it is important to note that during the heating season the pipeline is unlikely to provide additional import flexibility to the Netherlands, as the BBL is expected to continue to work in a “Netherlands-to-United Kingdom” mode. This is primarily due to the fact that the United Kingdom has been increasingly relying on the gas storage capabilities of continental Europe since the closure of the Rough storage facility (which accounted for 70% of UK working gas storage capacity), explaining the relatively high utilisation rate of the pipeline during the heating season (71% in January 2019).
The interconnectors relaying Dutch L-gas to Germany also show a relatively high utilisation level (77% in January 2019), which is due to the high seasonality of L-gas demand, consumed primarily in the residential and commercial sectors. It is important to note that L-gas consumption is expected to decrease in Germany, due to the ongoing conversion of end-consumers to H-gas.25 Consequently, the German TSO association (FNB Gas) foresees L-gas import requirements from the Netherlands halving by gas year 2024/25 and falling to zero by 2029/30 (FNB, 2019).
The evolution of the domestic production outlook in the Netherlands, and consequently the changing natural gas flow patterns, indicate the need to optimise the country’s entry/exit capacity, primarily alongside the Dutch “gas roundabout”, which is set to remain at the heart of north-western Europe’s gas system.
25 According to FNB, over 150 000 L-gas devices were adapted to H-gas in 2018, with over 300 000 devices to be converted by the end of 2019. The target is to convert all the 5.1 million L-gas devices to H-gas by 2030 (FNB, 2019).
PAGE | 58
IEA. All rights reserved.
Global Gas Security Review 2019 |
General annex |
Storage capacity
Because of the declining production swing and gradually eroding spare import pipeline capacity, since 2012 natural gas storage has become increasingly important to meeting north-western Europe’s seasonal gas requirements.
North-western Europe has natural gas storage capacity of 50 bcm, equating to about one-fifth of the region’s gas consumption in 2018. This is substantially lower compared to Italy or Central and Eastern Europe, where gas storage capacity accounted for 25% and 30% of gas consumption in 2018, respectively. About half of north-western Europe’s storage is located in Germany (24 bcm), with France and the Netherlands both having 12 bcm. In the United Kingdom only 1.5 bcm of capacity has been left since the closure of the Rough storage facility in 2017 and Belgium has less then 1 bcm capacity. Hence, both countries rely on storage capacity located in neighbouring markets via interconnections.
About 60% of north-western Europe’s underground storage sites are either aquifers or depleted fields, which are best suited for seasonal storage purposes. Almost 40% of all storage space is located in salt caverns, which offer much higher frequency cycling and hence are better positioned to respond to short-term market volatility.
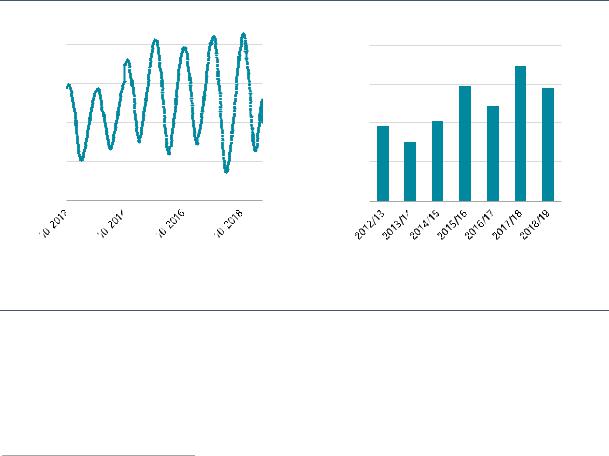
The proportion of north-western Europe’s gas demand that was met by gas storage during the heating season rose from an average of 14% between the gas years 2010/11 and 2013/14 to above 20% during the 2014/15–2017/18 period. This in turn increased the utilisation rate of natural gas storage facilities in north-western Europe, resulting in a widening storage swing.26
Figure 43. Storage swing in north-western Europe (2012–19)
bcm
40
30
20
10
0
40
30
20
10
0
Source: GIE (2019), “AGSI+ Storage data”, https://agsi.gie.eu/#/.
The utilisation rate of natural gas storage facilities in north-western Europe has been increasing amidst declining domestic production and shrinking spare import pipeline capacity.
Figure 43 illustrates that storage utilisation reached its peak in March 2018, when north-western Europe was hit by a late and particularly brisk cold spell baptised the “Beast from the East”. Storage facilities were depleted to an average level of 15% (or below 8 bcm). Storage stocks decreased below 5% in France, whilst in Belgium they fell below 1%. The availability of natural gas storage located in the Netherlands and Germany27 was therefore crucial to meeting the overall demand requirements of the region, whilst pushing the deliverability of storage sites to the limit (see Box 4).
26Storage swing refers to the difference in the quantity of natural gas in storage at the beginning of the gas year (1 October) and the end (31 March) when the heating season officially ends.
27Both Germany and the Netherlands had storage full at 25% at the beginning of March.
PAGE | 59
IEA. All rights reserved.
Global Gas Security Review 2019 |
General annex |
Box 4. Storage deliverability
Episodes similar to the “Beast from the East” demonstrate not only the security value of natural gas storage, but also its apparent abundance relative to other flexibility tools in the north-western European gas system, such as spare import pipeline capacity and production swing.
The withdrawal rates of gas storage sites tend to decline with the decreasing level of working gas in stock, given the lowering pressure level within the storage space. The deliverability of storage sites starts to decline once the volume of working gas volume falls below 50%.
This means that storage sites become less reactive (both in time and volume) to variations in demand by the end of the heating season, making the gas system particularly vulnerable to late cold snaps.
Storage deliverability in north-western Europe
Working gas versus withdrawal rates |
|
|
|
Storage delivered (1st March 2018) |
||||
|
|
|
|
1 |
rates |
2 |
|
bcm/day |
|
|
|
|
0.9 |
|
|
||
|
|
|
|
|
|
|
|
|
|
|
|
|
0.8 |
|
|
|
|
|
|
|
|
0.7 |
withdrawal |
1 |
|
|
|
|
|
|
0.6 |
|
|
||
|
|
|
|
|
|
|
||
|
|
|
|
|
|
|
|
|
|
|
|
|
0.5 |
|
|
|
|
|
|
|
|
0.4 |
|
|
|
|
|
|
|
|
0.3 |
|
0 |
|
|
90% |
70% |
50% |
30% |
10% |
|
Demand |
Storage |
|
|
|
|||||||
|
working gas |
|
|
|
|
|
deliverability |
|
Germany |
United Kingdom |
France |
the Netherlands |
|
Belgium |
Reduction in withdrawal capacity |
||
Sources: Gaspool (2019), “Consumption data”, www.gaspool.de/en/services/balancing-group-manager/consumption-data/slpsyn/; ENTSOG (2018), “Winter Supply Outlook 2018/2019”, www.entsog.eu/sites/default/files/2018-10/SO0021- Winter%20Supply%20Outlook%2018-19_0.pdf; GIE (2019), ), “AGSI+ Storage data”, https://agsi.gie.eu/#/; ENTSOG (2019), Transparency Platform, https://transparency.entsog.eu/; National Grid (2019), “Data Item Explorer”, http://mip-prod- web.azurewebsites.net/DataItemExplorer/Index; NCG (2019), “Aggregated consumption data”, www.net-connect-germany.de/en- gb/Transparency-information/Aggregated-Consumption-Data.
The practical consequences of this phenomenon were clearly demonstrated during the visit of the Beast from the East. North-western European daily natural gas demand spiked at almost 1.5 bcm on 1 March 2018, whilst the depleted storage sites were able to operate only at about half of their total withdrawal capacity, falling from ~1.25 bcm/day to below 0.65 bcm/day. Nevertheless, storage facilities were still able to meet almost half of north-western Europe’s gas demand, demonstrating their value in security of supply during shock demand/supply events.
The low volumes of working gas eroded their capability to provide further gas supplies, which would have served as a security buffer through the stressed market conditions – during the same period, spare capacity in import pipelines servicing Germany was limited and outages in North Sea pipelines affected supplies to the United Kingdom. This led to a stressed market situation, with prices rallying on both the NBP and TTF to above USD 50/MBtu during 1 March 2018. A more detailed analysis of the Beast from the East and its consequences for the north-western Europe’s gas markets is provided in the Global Gas Security Review 2018 (IEA, 2018).
IEA (2018), Global Gas Security Review 2018, https://webstore.iea.org/global-gas-security-review-2018.
PAGE | 60
IEA. All rights reserved.
Global Gas Security Review 2019 |
General annex |
Despite the crucial role played by storage, almost 7 bcm of gas storage capacity has been either closed or mothballed in north-western Europe since 2011. This is primarily due to the deterioration of the market value of natural gas storage, which derives from the combination of seasonal spreads (the price difference between winter and summer contracts for gas deliveries) and short-term price volatility (the realised price variations of a given gas delivery contract over a given period). Storage operators in north-western Europe rely primarily on revenue streams from capacity auctioning, with bids usually mirroring the evolution of seasonal spreads.
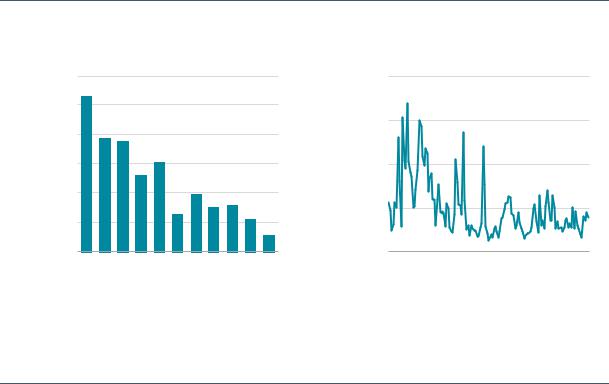
As shown in Figure 44, summer–winter spreads on the TTF more than halved from an average of almost EUR 4 per megawatt hour (MWh) between 2008 and 2012, to an average below EUR 1.5/MWh since 2013, insufficient to cover the operating costs of some storage facilities. Moreover, during the same period short-term volatility has fallen from an average of 63% to 43%. If February and March 2018 are excluded (which had an unusually high volatility due to a late cold snap), average volatility over the period would be 36%.
Figure 44. Spread between summer and winter gas prices on TTF (2008–18) and gas storage closures in north-western Europe (2013–17)
EUR/MWh
|
Summer-winter spreads* on TTF |
Monthly historical volatility** on TTF |
|||||||||
6 |
|
|
|
|
|
200% |
|
|
|
|
|
5 |
|
|
|
|
|
|
|
|
|
|
|
4 |
|
|
|
|
|
150% |
|
|
|
|
|
|
|
|
|
|
|
|
|
|
|
|
|
3 |
|
|
|
|
|
100% |
|
|
|
|
|
2 |
|
|
|
|
|
|
|
|
|
|
|
|
|
|
|
|
|
50% |
|
|
|
|
|
1 |
|
|
|
|
|
|
|
|
|
|
|
0 |
|
|
|
|
|
0% |
|
|
|
|
|
2008 |
2010 |
2012 |
2014 |
2016 |
2018 |
2008 |
2010 |
2012 |
2014 |
2016 |
2018 |
*Annual average of rolling summer–winter spreads, based on TTF SUM1 contract and TTF WIN2 contract.
**Excludes February and March 2018 when volatility spiked at unusually high levels.
Source: Bloomberg Finance LP (2019), Bloomberg Terminal (subscription required).
Declining summer–winter spreads and short-term price volatility are eroding the market value of natural gas storage, weighing on the revenue streams of storage operators.
A number of factors explain why both summer–winter spreads and short-term volatility have been declining over the last decade, particularly:
Decreasing demand: Natural gas consumption in north-western Europe fell by over 50 bcm/y between 2008 and 2015, with the power sector accounting for over half the decline.
Improving network access: The implementation of regulations and network codes deriving from the Third Energy Package (including capacity auctioning, effective congestion management mechanisms, transparency requirements and obligations on reverse capacity) has improved the functioning of the gas network.
The development of trading: North-western European hubs have rapidly evolved over the past decade, both in terms of traded volumes and liquidity. The larger number of market participants, with increasingly sophisticated trading capabilities, has slowly eroded the market rigidities from which seasonal spreads and volatility derive.
PAGE | 61
IEA. All rights reserved.