

Global Gas Security Review 2019 |
1. Update on LNG market flexibility metrics |
maximising the business opportunities available to them. Additionally, LNG offers them the possibility of diversifying away from mature and low-growth markets, such as crude oil (Bloomberg, 2019a).
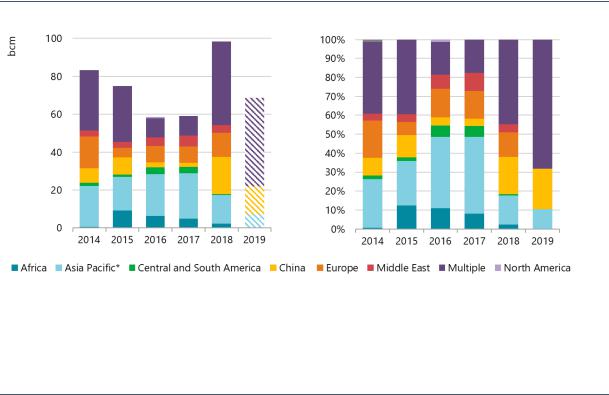
Among contracts with a specific destination, the People’s Republic of China (hereafter, “China”) was the most popular destination in 2018 and has been so far during 2019, surpassing other traditional buyers. In 2018, China accounted for 20% of all contract volumes signed and linked to a project that had already taken FID and 21% in the year to date. Environmental policies in China aimed at reducing air pollution have driven substantial growth in gas demand since 2017, mainly forcing coal- to-gas switching in the residential and industrial sectors. After the gas shortages in the winter of 2017/18 (IEA, 2018), Chinese buyers have signed long-term contracts for 34 bcm/y to reduce their exposure to supply risk and the high spot LNG prices in winter. Chinese buyers signing equity-lifting arrangements during 2018–19 is a clear reflection of a readiness for the protection provided by longterm contracts. In 2018-19, portfolio players were the main source of these new contracts, accounting for more the 45% of the concluded Chinese contracts, followed by Russia (17%), Qatar (14%), Canada (9%), Mozambique (6%), the United States (5%) and Papua New Guinea (4%).
Figure 18. Contracts signed each year by contract importing region (2014–19)
Notes: Contracts concluded and linked to projects that have already taken FID; sales from portfolios are also included; multiple category stands for agreements without a specific destination;.2019 data only include the information available at the time of writing; Asia Pacific* does not include China.
Source: IEA analysis based on ICIS (2019), ICIS LNG Edge, https://lngedge.icis.com/ (subscription required).
Import contracts signed by China outpaced those of other direct destinations in 2018, representing 20% of all contract volumes signed.
Longer and larger contracts do not mean less flexibility
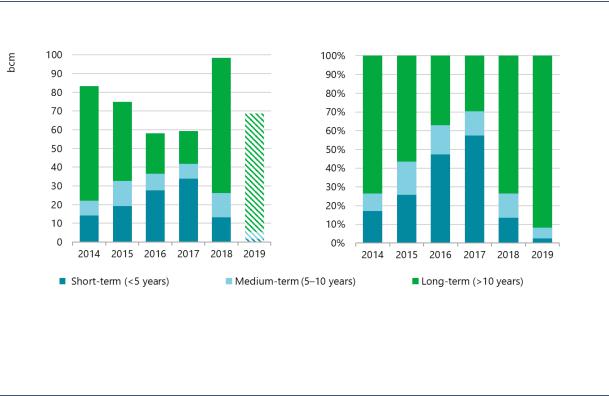
The number of long-term contracts (concluded contracts of more than ten years linked to projects that have already taken FID), which had fallen to very low levels in 2017, grew substantially in 2018 to more than 72 bcm. As a result, long-term deals have dominated recent LNG contracting, reaching a share of 74% in 2018 and 92% in 2019 so far (Figure 19). Developers of new projects have made more long-term LNG available to the market. Seeing strong demand growth (global LNG trade is forecast to grow by 26% during 2018–24) and the need to secure their own long-term supply (together with the impacts associated with an increase in spot market exposure and LNG spot price volatility during the winter heating season), buyers have the appetite for longer-term contracts. Both portfolio players and emerging Asian buyers have been
PAGE | 23
IEA. All rights reserved.
Global Gas Security Review 2019 |
1. Update on LNG market flexibility metrics |
very active in the long-term market. Long-term contracting by trading houses represents a shift in their strategy, which had relied primarily on short-term and spot deals.
Apart from this increased interest in long-term contracts, medium-term contracting activity has increased due to legacy contracts being renewed on different terms and new projects signing shorter SPAs to increase interest among potential offtakers and therefore accelerate FID timelines. By contrast, short-term contract volumes fell last year and have been very low to date in 2019.
Figure 19. Contracts signed each year by duration (2014–19)
Notes: Contracts concluded and linked to projects that have already taken FID. Sales from portfolios are also included. Data from 2019 include only the information available at the time of writing.
Source: IEA analysis based on ICIS (2019), ICIS LNG Edge, https://lngedge.icis.com/ (subscription required).
Long-term contracts became the dominant form of LNG contracting in 2018, as new FIDs found willing customers wishing to secure supply and avoid price risks.
New liquefaction investments also influenced the LNG volumes in contracts signed during 2018 (Figure 20). Large contracts (more than 4 bcm/y) and medium-sized contracts (2–4 bcm/y) increased significantly (by almost 41 bcm), representing 56% of the total volumes signed in 2018, in contrast with the previous three years when the majority of deals were for volumes under 2 bcm/y. Large contracts were mostly signed at year-end when liquefaction projects took FID. During 2019 so far, large contracts alone represent around 58% of contracted volumes. In 2018, the volumes sold through small contracts decreased slightly by 1 bcm/y compared to 2017, showing that there is still market interest in signing small contracts.
2018 LNG contract data show a positive correlation between size and duration. There is no single short-term contract larger than 2 bcm/y. Approximately 70% of the 2018 long-term LNG contracts are greater than 2 bcm/y. Despite this correlation, it is also remarkable that 30% of long-term contracts are smaller than 2 bcm/y, reflecting portfolio players reselling activity.
PAGE | 24
IEA. All rights reserved.