

Global Gas Security Review 2019 |
Findings and recommendations |
North-western Europe’s gas flex: Still fit for purpose?
The inherent flexibility of the north-western European natural gas system has played a crucial role in the development of a liquid, tradable and well-integrated regional gas market, where security of supply is ensured by adherence to market rules and the strong seasonality of demand is satisfied with adequate physical natural gas supply.
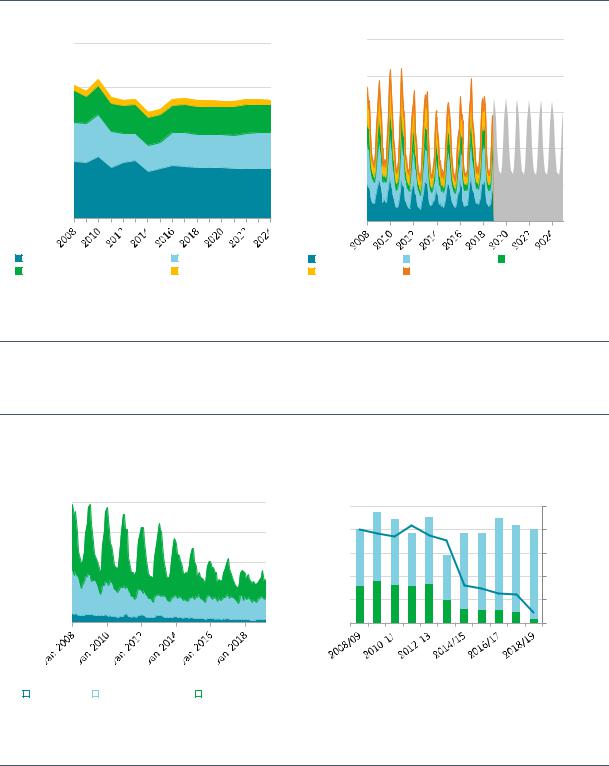
Figure 8. North-western Europe’s gas demand by sector (2005–24) and by month (2005–18)
bcm
400
300
200
50
40
30
20
100 |
|
10 |
|
|
|
|
|
|
|
0 |
|
0 |
|
|
Residential and commercial |
Power generation |
Germany |
United Kingdom |
France |
Industry |
Others |
the Netherlands |
Belgium |
|
Source: IEA (2019b), Natural Gas Monthly Statistics, www.iea.org/statistics/monthly/#gas.
North-western European natural gas demand is characterised by a pronounced seasonal pattern, driven by the heating needs of the residential and commercial sectors.
However, rapidly declining domestic production and increasing import requirements have gradually eroded this flexibility in the past five years. The proportion of winter gas requirements met by production swing has fallen from 40% to below 5%.
Figure 9. Natural gas production and flexibility requirement in north-western Europe (2008/09– 2018/19)
bcm
Natural gas production by month
(2008-19)
20
15
10
5
0
Production swing vs consumption seasonality (gas years 2008/09-2018/19)
bcm |
100 |
50% |
|
|
|
|
80 |
40% |
|
60 |
30% |
|
40 |
20% |
|
20 |
10% |
|
0 |
0% |
|
|
|
|
|
|
|
|
Other seasonal flex requirements |
|
|
|
|
|
|
|
||
|
|
|
|
|
|
|
||
|
Germany |
|
United Kingdom |
|
the Netherlands |
|
|
Production swing |
|
|
|
|
|||||
|
|
|
|
|||||
|
|
|
|
|
Production swing as share of flex requirement |
|||
|
|
|
||||||
|
|
|
|
|
Source: IEA (2019b), Natural Gas Monthly Statistics, www.iea.org/statistics/monthly/#gas.
European natural gas production has halved over the past decade, while its seasonal production swing fell by 90% during the same period, increasing the call on other sources of flexibility.
PAGE | 14
IEA. All rights reserved.
Global Gas Security Review 2019 |
Findings and recommendations |
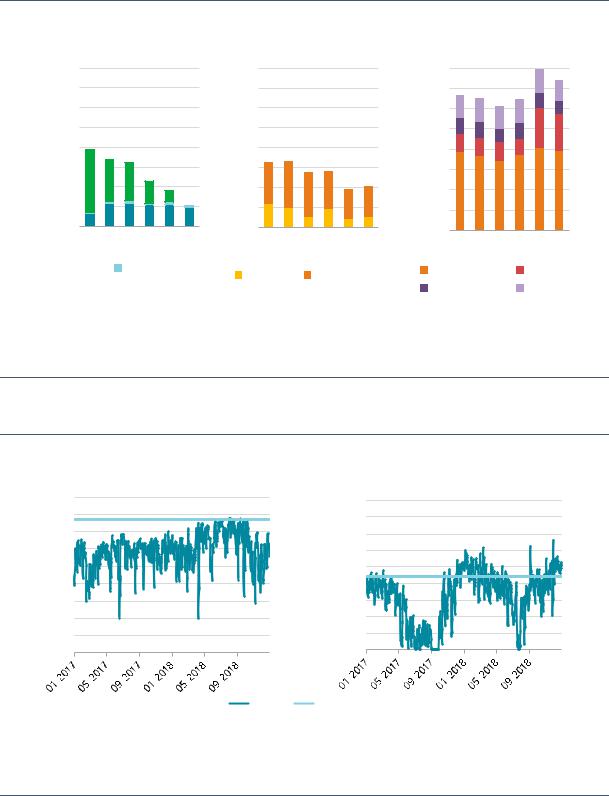
Spare import capacity via Norwegian and Russian pipelines directly servicing north-western Europe fell to close to zero during the past two heating seasons.
Figure 10. Annual spare import capacity into north-western Europe by origin of imports (2012–18)
Russian imports (German entry points) |
Norwegian imports |
bcm |
80 |
|
|
|
|
70 |
|
|
|
|
|
|
|
|
|
|
|
|
60 |
|
|
|
|
|
50 |
|
|
|
|
|
40 |
|
|
|
|
|
|
|
|
|
|
|
30 |
|
|
|
|
|
|
|
|
|
|
|
|
|
|
|
|
|
20 |
|
|
|
|
|
|
|
|
|
|
|
10 |
|
|
|
|
|
|
|
|
|
|
|
0 |
|
|
|
|
|
|
|
|
|
|
|
2013 |
2014 |
|||
 Ukrainian transit
 Nord Stream
2015 |
2016 |
Belarus
2017 |
2018 |
transit
80
70
60
50
40 |
|
|
|
|
|
30 |
|
|
|
|
|
20 |
|
|
|
|
|
10 |
|
|
|
|
|
0 |
|
|
|
|
|
2013 |
2014 |
2015 |
2016 |
2017 |
2018 |
Continent |
|
United Kingdom |
|||
Source: IEA (2019c), Gas Trade Flows, www.iea.org/gtf/.
LNG imports
80 |
|
|
|
|
|
70 |
|
|
|
|
|
60 |
|
|
|
|
|
50 |
|
|
|
|
|
40 |
|
|
|
|
|
30 |
|
|
|
|
|
20 |
|
|
|
|
|
10 |
|
|
|
|
|
0 |
|
|
|
|
|
2013 |
2014 |
2015 |
2016 |
2017 |
2018 |
United Kingdom |
|
France |
|||
Belgium |
|
|
|
the Netherlands |
|
Spare pipeline import capacity to north-western Europe has more than halved since 2013, falling from 70 bcm/y to just above 30 bcm/y, while spare regasification capacity has risen by 10% to above 70 bcm/y.
Gas interconnectors from Germany to the Netherlands are becoming saturated as a result of the evolving supply outlook in the Netherlands.
Figure 11. Interconnector flows to the Netherlands (2017–18)
mcm/d |
90 |
90 |
|
Emden interconnector |
Bunde/Oude interconnector |
|
80 |
80 |
|
70 |
70 |
|
60 |
60 |
|
50 |
50 |
|
40 |
40 |
|
30 |
30 |
|
20 |
20 |
|
10 |
10 |
|
0 |
0 |
|
Flows |
Firm capacity |
Note: mcm/d = million cubic metres per day.
Source: ENTSOG (2019), Transparency Platform, https://transparency.entsog.eu/.
The utilisation of interconnectors feeding into the Dutch natural gas grid is saturated during periods of high demand, hence limiting the availability of spare capacity.
Deteriorating storage economics has led to the closure of 5 bcm of storage capacity since 2013.
PAGE | 15
IEA. All rights reserved.
Global Gas Security Review 2019 |
Findings and recommendations |
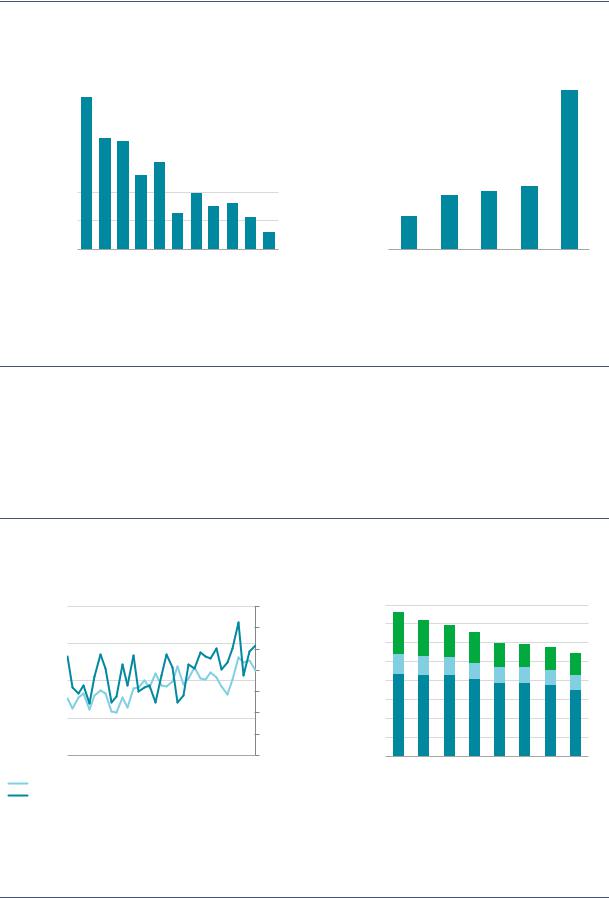
Figure 12. Spread between summer and winter gas prices on TTF (2008–18) and gas storage closures in north-western Europe (2013–17)
|
|
|
|
Summer-winter spreads on TTF |
|||||||
EUR/MWh |
6 |
|
|
|
|
|
|
|
|
|
bcm/y |
|
|
|
|
|
|
|
|
|
|||
5 |
|
|
|
|
|
|
|
|
|
||
|
|
|
|
|
|
|
|
|
|
|
|
|
4 |
|
|
|
|
|
|
|
|
|
|
|
|
|
|
|
|
|
|
|
|
|
|
|
3 |
|
|
|
|
|
|
|
|
|
|
|
|
|
|
|
|
|
|
|
|
|
|
2
1
0
2008 2010 2012 2014 2016 2018
Notes: MWh = megawatt hour; TTF = Title Transfer Facility.
Source: Bloomberg Finance LP (2019), Bloomberg Terminal (subscription required).
|
Cumulative storage closures in |
||||||||||||||
7 |
|
|
|
Northwest Europe |
|
|
|
||||||||
|
|
|
|
|
|
|
|
|
|
|
|
|
|
|
|
6 |
|
|
|
|
|
|
|
|
|
|
|
|
|
|
|
|
|
|
|
|
|
|
|
|
|
|
|
|
|
|
|
5 |
|
|
|
|
|
|
|
|
|
|
|
|
|
|
|
|
|
|
|
|
|
|
|
|
|
|
|
|
|
|
|
4 |
|
|
|
|
|
|
|
|
|
|
|
|
|
|
|
|
|
|
|
|
|
|
|
|
|
|
|
|
|
|
|
3 |
|
|
|
|
|
|
|
|
|
|
|
|
|
|
|
|
|
|
|
|
|
|
|
|
|
|
|
|
|
|
|
2 |
|
|
|
|
|
|
|
|
|
|
|
|
|
|
|
|
|
|
|
|
|
|
|
|
|
|
|
|
|
|
|
|
|
|
|
|
|
|
|
|
|
|
|
|
|
|
|
1 |
|
|
|
|
|
|
|
|
|
|
|
|
|
|
|
|
|
|
|
|
|
|
|
|
|
|
|
|
|
|
|
|
|
|
|
|
|
|
|
|
|
|
|
|
|
|
|
0 |
|
|
|
|
|
|
|
|
|
|
|
|
|
|
|
|
|
|
|
|
|
|
|
|
|
|
|
|
|
|
|
2013 |
2014 |
2015 |
2016 |
2017 |
|||||||||||
Seasonal spreads on the TTF have more than halved since 2012 to an average below EUR 1.5/MWh, insufficient to cover the operating costs of some storage sites and leading to the closure of over 5 bcm of storage capacity since 2013.
The flexibility of the north-western European gas system could further decline amidst the increasing import requirements of the region, expected to grow by 40 bcm/y by 2024, primarily due to declining domestic production. Moreover, the challenging storage economics coupled with the expiry of long-term storage contracts could lead to the retirement of further storage capacity in the region.
In the medium term, the north-western European power system is expected to undergo a profound transformation, with an increasing share of intermittent renewables in the electricity mix and the announced retirement of 45 GW of nuclear and coal-fired power generation in the next five to six years.
Figure 13. UK volatility in gas-fired power generation (2015–17) and announced power plant closures in north-western Europe (2018–25)
Volatility of gas-fired power generation in the United Kingdom
Nuclear and coal-fired power plant closures in Northwest Europe*
|
40% |
|
700% |
|
|
160 |
|
|
|
600% |
|
|
140 |
|
|
|
|
|
|
|
|
30% |
|
500% |
|
|
120 |
|
|
|
|
|
100 |
|
|
|
|
400% |
|
|
|
|
20% |
|
|
|
80 |
|
|
|
300% |
|
|
||
|
|
|
|
|
60 |
|
renewablesIntermittent |
|
|
200%powergenerationvolatility |
GW |
||
10% |
|
40 |
||||
|
|
|
100% |
-fired |
|
20 |
|
|
|
|
|
||
|
0% |
|
0% |
|
0 |
|
|
|
Gas |
|
|||
|
02-2015 |
02-2017 |
|
|
|
|
|
|
|
|
|
||
Intermittent renewables as a proportion of total generation Volatility
2018 |
2019 |
2020 |
2021 |
2022 |
2023 |
2024 |
2025 |
||||
|
Nuclear |
|
Lignite |
|
|
Hard coal |
|
||||
|
|
|
|
||||||||
|
|
|
|
||||||||
* Based on announcements by governments and companies.
Sources: Share of renewables: IEA (2019), Monthly Statistics, www.iea.org/statistics/monthly/; gas-fired power generation: ENTSO-E (2019), Transparency Platform, https://transparency.entsoe.eu/.
The growing share of intermittent renewables, coupled with declining coal-fired and nuclear power generation, is set to increase the volatility of gas-fired power generation.
PAGE | 16
IEA. All rights reserved.
Global Gas Security Review 2019 |
Findings and recommendations |
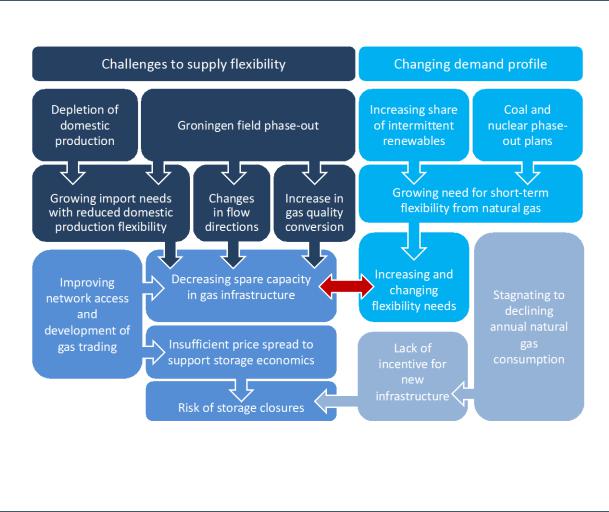
As a consequence, gas-fired power generation will play an increasingly important role in the balancing of the power system, i.e. as a backup to variable renewables and to meet peak demand. This in turn could drive up the volatility of gas-to-power demand and hence the overall short-term flexibility requirements of the gas system.
Figure 14. North-western Europe’s changing gas flexibility landscape
IEA, 2019. All rights reserved.
While the flexibility of gas supply is decreasing, the call for flexibility in north-western Europe’s gas system might increase over the medium term when considering the broader energy complex.
In this context, the need to enhance the systemic flexibility of north-western Europe’s gas infrastructure should be considered using a regional approach and include:
Development of additional import capacity to meet both incremental import requirements (pipeline and LNG) and the need to further diversify supplies (via LNG).
Improvement of midstream interconnectivity, in particular on the border between Germany and the Netherlands, via either new interconnectors or the reconfiguration of existing exit/entry capacities.
Harmonisation of gas storage regulation, with the eventual development of support mechanisms to prevent further storage site closures.
Strengthening the flexibility of the north-western European gas system would also reinforce the position of the region within the global gas market, as internal flexibility tools allow a timely and cost-efficient response to changing global supply–demand dynamics.
This has been clearly demonstrated during the first half of 2019, when north-western Europe has been able to profit from a loose global LNG market by increasing LNG imports in a counterseasonal
PAGE | 17
IEA. All rights reserved.
Global Gas Security Review 2019 |
Findings and recommendations |
fashion, exploiting existing synergies between spare regasification and storage capacity. Consequently, trading on the TTF soared to record levels, with an increasing number of market players hedging their LNG positions on the Dutch hub.
This indicates that if TTF continues to be supported by a strong and flexible natural gas grid, it could further reinforce its position as a global gas price benchmark and hence the role of north-western Europe in the global LNG trade.
PAGE | 18
IEA. All rights reserved.