

Global Gas Security Review 2019 |
General annex |
crucial so that gas flows can be redistributed efficiently and gas storage used to its optimum under stressed market conditions. In addition, linepack flexibility services, LNG storage and demand-side response can contribute to shorter-term variations in natural gas demand.
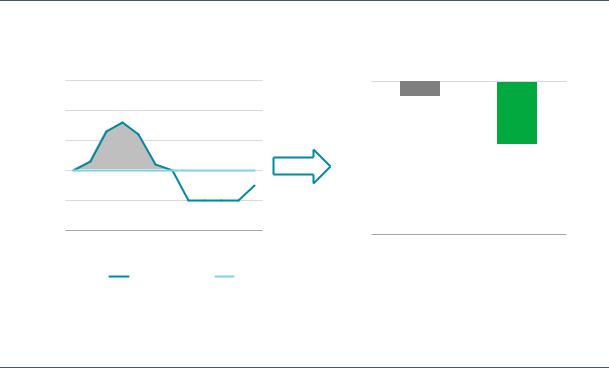
Figure 36. Simplified schematic of seasonal gas flexibility needs and supply balance in the northern hemisphere
bcm |
5 |
|
|
|
4 |
|
3 |
|
2 |
|
1 |
|
0 |
|
Oct Nov Dec |
 Flexibility needs
Jan
Feb March April May June Monthly demand
Sep
Aug
July
Average demand
5
4 |
|
|
|
|
Storage |
|
||
|
|
|
|
flexibility |
||||
|
|
|
|
|
||||
3 |
|
Seasonal |
|
|
|
|
|
|
|
|
|
Spare |
|
||||
|
|
flexibility |
|
|
|
|||
|
|
|
|
import |
|
|||
|
|
needs |
|
|
|
|||
2 |
|
|
|
capacity |
|
|||
|
|
|
|
|
||||
|
|
|
|
Production |
|
|
||
1 |
|
|
|
|
|
|||
|
|
|
|
swing |
|
|
||
|
|
|
|
|
|
|||
0 |
|
|
|
|
|
|
|
|
Flexibility needs |
Flexibility supply |
|||||||
|
||||||||
IEA. All rights reserved.
The seasonal flexibility needs of natural gas demand are met through a combination of upstream and downstream supply flexibility, including production swing, spare import capacity and storage.
After initially analysing the evolving need for flexibility to meet north-western European natural gas demand, this chapter assesses the current state of the flexibility tools available to the system, including:
Upstream deliverability: the evolution of indigenous gas production, addressing both volume changes and seasonal patterns.
Import capacity: the position on annual and peak import capacity, seasonal swings and the timeliness of additional import volumes.
Midstream interconnectivity: the evolution of utilisation rates, considering both annual averages and during peak demand.
Storage flexibility: the evolving storage space in north-western Europe and its utilisation rates.
The assessment of these flexibility tools is crucial given the growing role that natural gas is expected to play in north-western Europe’s energy system.
North-western Europe’s gas demand: Seasonality and volatility
North-western European gas consumption stood at 271 bcm in 2018, just above half of total European gas demand. One characteristic of the north-western European natural gas system is the co-existence of a combined high-calorific gas (H-gas) and low-calorific gas (L-gas) market zones. L-gas has been produced since the early 1960s from the giant Groningen field in the Netherlands and a number of much smaller fields in Germany, and today has a market of around 55–60 bcm/y, concentrated in the Netherlands (25 bcm/y), north-western Germany (20 bcm/y),
PAGE | 48
IEA. All rights reserved.
Global Gas Security Review 2019 |
General annex |
Belgium and France (each 5 bcm/y). L-gas supply is supplemented by conversion of H-gas via conversion facilities (Figure 37). Production of L-gas is declining rapidly, and the consequences of this for the north-western European gas market is analysed below in detail.
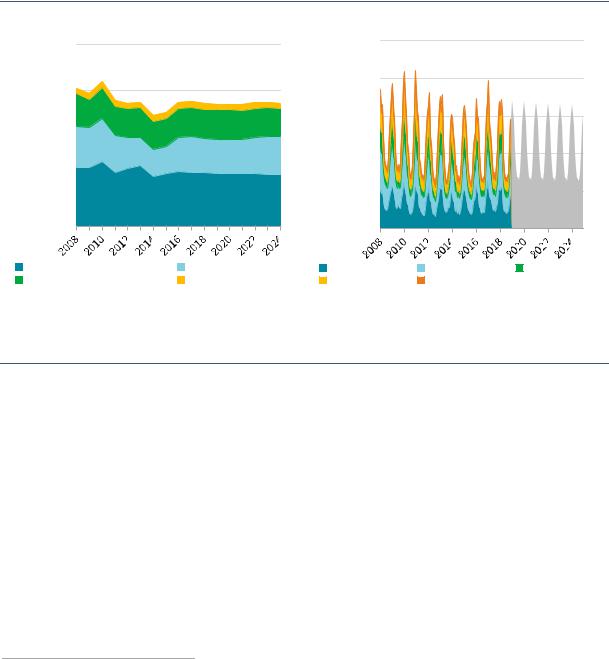
The residential and commercial sectors accounted for 44% of north-western European gas consumption on average between 2005 and 2018, followed by power generation (27%) and industry (24%) (Figure 37). Each sector is characterised by different demand patterns and hence flexibility requirements.
The high share of the residential and commercial and the power sectors results in a strong seasonal pattern of natural gas demand, with almost two-thirds of total gas consumption occurring during the heating season.15
Figure 37. North-western Europe’s gas demand by sector (2008–24) and by month (2008-24)
bcm
400
300
200
50
40
30
20
100 |
|
10 |
|
|
|
|
|
|
|
0 |
|
0 |
|
|
Residential and commercial |
Power generation |
Germany |
United Kingdom |
France |
Industry |
Others |
the Netherlands |
Belgium |
|
Source: IEA (2019a), Natural Gas Monthly Statistics, www.iea.org/statistics/monthly/#gas.
North-western European natural gas demand is characterised by a pronounced seasonal pattern, driven by the heating needs of the residential and commercial sectors.
The seasonal swing16 varies according to weather conditions and resulting temperatures (their impact on energy consumption being reflected in terms of heating-degree days). However, it averaged 80 bcm over the last decade, driving the flexibility requirements of the north-western European gas system. Residential and commercial gas demand is expected to decline only slightly over the medium term (at a rate of 0.6% per year to 2024), meaning that seasonality will remain a key characteristic of the region’s gas consumption pattern.
In the power generation sector, natural gas is playing an increasingly important balancing role in the power system by supporting intermittent renewables and meeting peak demand. In 2018, gas-fired power generation accounted for almost one-fifth of total electricity production in north-western Europe. Over the medium term, the rapidly expanding renewable power fleet and the gradual retirement of 45 GW of nuclear and coal-fired power generation capacity by 2025 are expected to drive up the volatility of gas-to-power demand in north-western Europe.
15In a gas year, the heating season refers to the period between 1 October and 31 March, whilst the summer (or injection) season refers to the period between 1 April and 30 September.
16The difference in natural gas consumption between the heating season and the summer season of the gas year.
PAGE | 49
IEA. All rights reserved.