


Global Gas Security Review 2019 |
1. Update on LNG market flexibility metrics |
Technical analysis
1. Update on LNG market flexibility metrics
Introduction
Each year the Global Gas Security Review has been assessing the growth in flexibility of the liquefied natural gas (LNG) market by analysing LNG supply availability, seller and buyer behaviour, and the evolution of destination flexibility in LNG contracts. This chapter focuses on the most recent LNG contracting trends, analysing the implications of a new wave of liquefaction investment for future flows and pricing methods. It also updates previous years’ analysis of the growing role of portfolio players and implementation of LNG contracts with flexibility in the market, as well as examining the changing contract strategy of trading houses.
Similar to previous years’ reports, the analysis conducted here is based on the detailed contractual positions of importers and exporters and their actual traded volumes, using the International Energy Agency (IEA) internal LNG contract database. No specific assumptions are made on existing contract renewals unless publicly and explicitly stated by the contracting parties. Hence, such volumes are considered to be “uncontracted” upon expiry.
Update on LNG contract trends
LNG contracting activity rebounded in 2018, reaching its highest level (in terms of total volume) in five years. Contracts totalling 123 billion cubic metres (bcm) were concluded, with around 57% of them signed as firm.1 For the purpose of analysis, this chapter focuses on concluded contracts linked to projects that have already taken FID.2 These contracts also grew in 2018, reaching 98 bcm, an increase of more than 39 bcm over the previous year. Much of this contracting activity relates to the development and financing of new liquefaction projects. Different deal structures, such as the equity-lifting model used by LNG Canada, are being exercised to facilitate the process of reaching FID. In the equity-lifting model, offtakers/partners have access to marketable LNG volumes according to their equity stake. Such structures reduce the need for long-term SPAs to secure the project’s financing.
1Defined as concluded sale and purchase agreements (SPAs) and entitlement equity operations associated with a project that has taken final investment decision (FID) during the year.
2Sales from portfolios are also included.
PAGE | 19
IEA. All rights reserved.
Global Gas Security Review 2019 |
1. Update on LNG market flexibility metrics |
Liquefaction activity: New wave of investment gaining momentum
Liquefaction investment activity also rebounded in 2018 (Figure 15), with several new projects taking FID, after two years of low investment activity. The LNG Canada project alone, with its 19 bcm capacity, surpassed all the capacity sanctioned in 2016 and 2017 combined. During 2018 approximately 30 bcm of new capacity was sanctioned (Corpus Christi LNG train 3, LNG Canada, Greater Tortue FLNG 1, Tango FLNG), with North American projects representing 86% of the total. At the time of writing, projects amounting to 85 bcm (Sabine Pass LNG train 6, Golden Pass LNG trains 1–3, Calcasieu Pass, Mozambique LNG trains 1 and 2, Arctic LNG 2) have already taken FID in 2019, the most capacity ever sanctioned in a single year.
Figure 15. Additions to global liquefaction capacity (2014–24) and FID volume (2014–19)
Note: Capacity additions based on developers’ announcements and include only the capacity of the projects that have taken FID at the time of writing this report.
Source: IEA analysis based on ICIS (2019), ICIS LNG Edge, https://lngedge.icis.com/ (subscription required).
A record-setting capacity of over 170 bcm of natural gas liquefaction is due to take FID in 2019, far surpassing 2005’s previous record of 70 bcm.
Much more could be coming. If only considering the projects most likely to announce FID during 2019 (those projects that have already completed front-end engineering and design [FEED] and are expected to come online before the end of 2024), 2019 FID volumes could exceed 160 bcm (IEA, 2019). Even if most do not proceed, the total has already surpassed the 2005 peak of almost 70 bcm. US sellers continue to push for additional capacity to enable them to bring extra volumes into Asian and European markets. Alongside the United States (Driftwood LNG), countries such as Mozambique (Rovuma LNG) and especially Qatar (Qatargas V–VIII) have ambitious plans to develop new liquefaction facilities (IEA, 2019).
Between 2020 and 2022, annual LNG capacity additions are expected to decrease from 2018 levels based on the current status of investment decisions (Figure 15). Despite this reduction, capacity additions between 2020 and 2024 are set to be over 17 bcm higher than during 2012–17. Considering all FIDs taken in 2018 and 2019, by the end of 2024 the LNG market is expected to see a wave of new liquefaction capacity coming online. These confirmed projects could represent capacity additions of more than 105 bcm by 2024.
PAGE | 20
IEA. All rights reserved.
Global Gas Security Review 2019 |
1. Update on LNG market flexibility metrics |
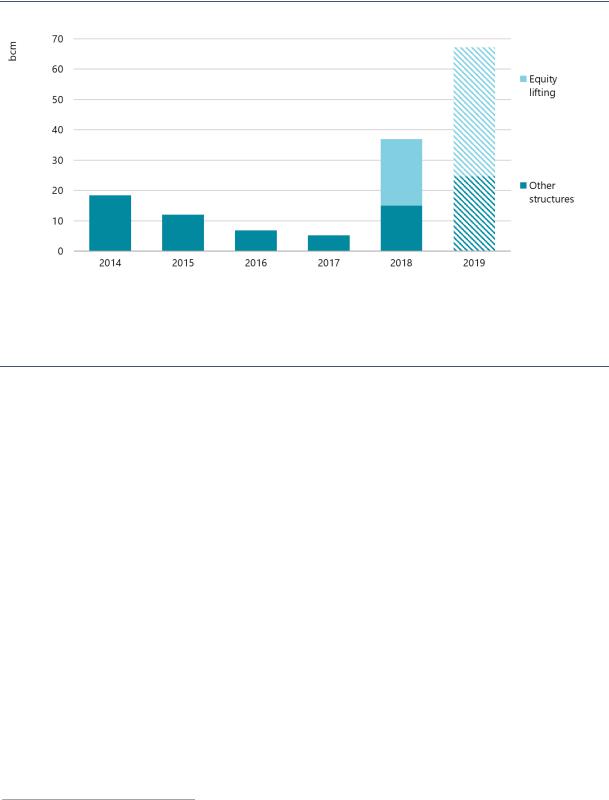
One of the reasons for the boost in contracting activity in 2018 and 2019 has been the implementation of equity-lifting structures (Figure 16). This model has been used in the past (e.g. Snøhvit LNG or Gorgon LNG) with slightly different terms and structuring, but 2018 and 2019 have seen a resurgence with multiple large-capacity projects reaching FID as result of the advantages it offers in current market conditions.
Figure 16. FID-enabling contracts by signing year and structuring model (2014–19)
Note: 2019 data reflect contracts signed up to the time of writing.
Source: IEA analysis based on ICIS (2019), ICIS LNG Edge, https://lngedge.icis.com/ (subscription required).
After 2017, a shift to equity-lifting contracts among FID-enabling deals was seen to accelerate FID timelines with a novel approach to financing.
In the equity-lifting model, offtakers/partners have access to the project’s LNG volumes proportionate to their equity stake (Ledesma and Fulwood, 2019). Under other traditional offtake models, financing is sought once offtake has been secured using long-term contracting with third parties. In contrast, the equity model secures both the economic viability of the project and the volumes contracted under long-term agreement. This accelerates the process and timeline by which projects reach FID. LNG Canada, Greater Tortue (Mauritania and Senegal), Golden Pass LNG (United States), and the Russian Federation’s (hereafter, “Russia”) Arctic LNG 2 have been the first examples of the use of this model. Mozambique’s Rovuma LNG has also announced plans to develop under an equity-marketing model.
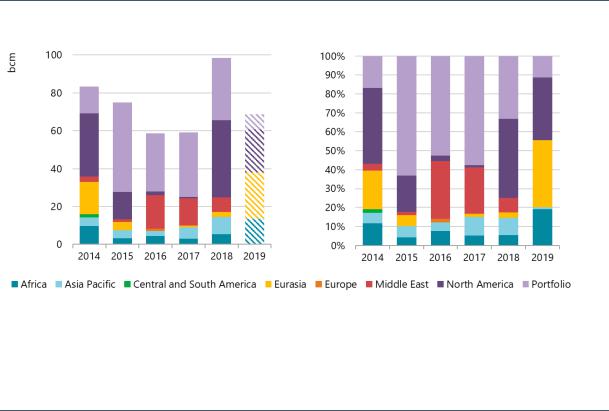
Export source and import destination: Flexible gas gaining ground
North American projects have been the main source of new contracts. In 2018, 42% of newly contracted gas volumes3 involved LNG originating in North America (Figure 17), mostly due to the development of new LNG projects in the United States and Canada. In 2019 to date, Eurasia represents the largest source of newly contracted gas (35%) thanks to the Arctic LNG 2 project in Russia. Africa was also an important source due to the Greater Tortue and Mozambique LNG projects, accounting for 11% of gas contracted in 2018–19 linked to new projects.
Market participants known as “portfolio players” are a major component of the contract data presented in Figure 17, as they concluded contracts in which the exporting region is not specified.
3 Sales from portfolios are also included.
PAGE | 21
IEA. All rights reserved.
Global Gas Security Review 2019 |
1. Update on LNG market flexibility metrics |
The total volume of sales contracts signed each year by portfolio players has fallen since 2015. This is because most of the volumes in their portfolios have already been sold through term contracts or spot deals, reducing the opportunity to resell and increasing the need to expand their portfolio volumes.
The contracts that portfolio players sign with buyers obligate them to supply incremental volumes for future delivery, meaning that the total market volume supplied via portfolio players is increasing. This trend is analysed in detail later in this section.
During 2018 contracts to supply LNG sourced from a portfolio accounted for 33% of contracted volumes linked to post-FID projects. This market share is well below the level of 2015, when contracts associated with a portfolio represented 63% of volumes. The smaller 2018 share is mostly due to the increased volume from contracts signed to export gas from North American projects (Figure 17), although portfolio contracted volumes also decreased by 2 bcm from 2017 to 2018.
Figure 17. Contracts signed each year by contract exporting region and with no identified region (2014–19)
Notes: Contracts concluded and linked to projects that have already taken FID; sales from portfolios are also included; Portfolio category stands for contracts in which the origin is a portfolio player (i.e. not linked to any specific region); 2019 data only include the information available at the time of writing.
Source: IEA analysis based on ICIS (2019), ICIS LNG Edge, https://lngedge.icis.com/ (subscription required).
Contracting activity by exporting region in 2018 shows growth in North American volumes, while export volumes from portfolio players remain an important contribution to deal activity.
As for the destination of LNG in contracts signed during 2018, agreements without a specific destination represented the largest share, representing 45% of all volumes linked to post-FID projects (Figure 18). During 2019 to date, their share has increased to 68%. Portfolio players are one of main counterparties in multiple-destination contracts, responsible for a large share of deals developed under the equity-lifting model during 2018 and 2019 to date. These contracts provide them with the main source of volumes needed to cover their positions.
Trading houses, such as Trafigura, Vitol and Gunvor, have emerged as a new buyer of multipledestination LNG. The year 2018 exhibited a shift in the strategy of trading companies – they increasingly sign long-term contracts instead of relying exclusively on short-term and spot deals to cover their positions. This change in their strategy is a manifestation of the gradual consolidation of the global LNG market. Following a trend previously set by portfolio players, trading houses are trying to take advantage of all the synergies that ensuring a long-term supply can provide,
PAGE | 22
IEA. All rights reserved.