

3677
.pdfRussian Journal of Building Construction and Architecture
|
1 |
|
a |
a |
||
|
k a |
|||||
m G0 |
|
|
|
|
|
|
|
|
|||||
|
k a |
k |
||||
|
|
|
|
|
|
|
|
|
|
k |
|
|
|
a k a |
|
|||||
. |
(9) |
|||||
|
|
|
||||
|
||||||
k |
|
|
||||
|
|
|
|
|
|
|
The ability of the volume of the ventilated room to accumulate harmful gas reduces the maximum concentration cmax and increases the time it takes to reach max.
Conclusions. Clean room technologies are currently frequently used in various industries to ensure the required parameters of the air environment. In clean rooms, emergency ventilation must be provided as technological processes can use toxic gases.
Based on the differential equation of material balance for harmful gas, a model of emergency air exchange for a clean room has been developed. For a calculated emergency, the release of harmful gases from the equipment under pressure is accepted.
The solution is obtained in the elementary functions of the emergency air exchange model for a clean room. Therefore a new concept of the accumulating capacity of a ventilated room has been introduced. An increase in the storage capacity of a ventilated room causes a decrease in the maximum concentration of harmful substances from the equipment under pressure.
The use of the concept of the accumulating capacity of a ventilated room will simplify the calculations of general exchange and emergency ventilation for rooms with non-stationary sources of hazardous substances.
The results shed more light on the development of an emergency in a clean room and enable one to calculate the parameters of emergency ventilation in clean rooms.
References
1.Mel'kumov V. N., Kuznetsov S. N., Gulak V. V. Modelirovanie zadymlennosti pomeshchenii slozhnoi konfiguratsii v nachal'noi stadii pozhara [Modeling of the smoke content of rooms of complex configuration in the initial stage of a fire]. Nauchnyi vestnik VGASU. Stroitel'stvo i arkhitektura, 2010, no. 3 (19), pp. 131—139.
2.Mel'kumov V. N., Kuznetsov S. N., Pavlyukov S. P., Cheremisin A. V. Nestatsionarnoe pole kontsentratsii prirodnogo gaza v skvazhine pri ego utechke iz podzemnogo gazoprovoda [Non-stationary field of natural gas concentrations in a well when it leaks from an underground gas pipeline]. Privolzhskii nauchnyi zhurnal, 2008, no. 4 (8), pp. 98—103.
3.Mel'kumov V. N., Kuznetsov S. N., Sklyarov K. A., Cheremisin A. V. Nestatsionarnye protsessy formirovaniya sistemami ventilyatsii vozdushnykh potokov v pomeshcheniyakh [Non-stationary processes of formation of air flows by ventilation systems in rooms]. Izvestiya OrelGTU. Ser.: Stroitel'stvo. Transport, 2007, no. 3—15 (537), pp. 36—39.
4.Mel'kumov V. N., Kuznetsov S. N., Lachugin I. G., Sviridov A. A. O metodike rascheta kontsentratsii prirodnogo gaza pri nalichii utechki iz podzemnogo gazoprovoda [On the methodology for calculating natural
80
Issue № 3 (51), 2021 |
ISSN 2542-0526 |
gas concentrations in the presence of a leak from an underground gas pipeline]. Vestnik VGTU, Ser.: Energetika, 2001, vol. 7.1, pp. 72—75.
5.Polosin I. I., Derepasov A. V. Modelirovanie ventilyatsionnykh protsessov v proizvodstvennykh pomeshcheniyakh s proemami v mezhduetazhnykh perekrytiyakh [Modeling of ventilation processes in industrial premises with openings in floor-to-floor ceilings]. Nauchnyi vestnik VGASU. Stroitel'stvo i arkhitektura, 2011, no. 2 (22), pp. 43—51.
6.Polosin I. I., Lobanov D. V. Raschet trebuemogo vozdukhoobmena v ofisnom pomeshchenii pri organizatsii personal'noi sistemy ventilyatsii [Calculation of the required air exchange in an office space when organizing a personal ventilation system]. Privolzhskii nauchnyi zhurnal, 2014, no. 1 (29), pp. 56—60.
7.El'terman V. M. Ventilyatsiya khimicheskikh proizvodstv [Ventilation of chemical production facilities]. Moscow, Khimiya Publ., 1971. 238 p.
8.El'terman, V. M. Teoreticheskie i eksperimental'nye osnovy ventilyatsii proizvodstv s vydeleniem toksichnykh gazov i parov. Diss. d-ra tekh. nauk [Theoretical and experimental bases of industrial ventilation with the release of toxic gases and vapors. Dr. eng. sci. diss.]. Moscow, 1973. 314 p.
9.ANSI/ASHRAE Standard 62.2-2013. Ventilation and Acceptable Indoor Air Quality in Low-Rise Residential Buildings. Atlanta, ASHRAE, 2013.
10.Beggs C. B., Sleigh P. A. A quantitative method for evaluating the germicidal effect of upper room UV fields. Journal of Aerosol Science, 2002, no. 33, pp. 1681—1699.
11.Dijkstra D., Loomans M. G., Hensen J. L. M., Cremers B. E. Ventilation efficiencyin a low-energydwelling setting — a parameter study for larger rooms. Proceedings of the 14th International Conference on Indoor Air Qualityand Climate (Indoor Air — 2016), 2016, p. 8.
12.Fedotov А. Saving energyin cleanrooms. Cleanroom Technol, 2014, vol. 22, no. 8, pp. 14—18.
13.Khoo C. Y., Lee C. C., Hu S. C. An experimental study on the influences of air change rate and free area ratio of raised-floor on cleanroom particle concentrations. Build. Environ, 2012, no. 48 (1), pp. 84—88.
14.Kircher K., Shi X., Patil S., Zhang K. M. Cleanroom energy efficiency strategies: Modeling. Energy Build, 2010, vol. 42, no. 3, pp. 282—289.
15.Loomans M. G., Molenaar P. C. A., Kort H. S. M., Joosten P. H. J. Energy demand reduction in pharmaceutical cleanrooms through optimization of ventilation. Energy Build, 2019, 109346. Available at: https://doi.org/10.1016.
16.Molenaar P. Ventilation efficiency in pharmaceutical cleanrooms — Pilot study graduation. Eindhoven University of Technology, 2016.
17.Noakes C. J., Sleigh P. A. Mathematical models for assessing the role of airflow on the risk of airborne infection in hospital wards. J. R. Soc. Interface, 2009, suppl. 6, pp. S791—S800.
18.Ogunsola O. T., Wang J., Song L. ASHRAE Research Project Report 1399-RP: Survey of particle production rates from process activities in pharmaceutical and biological cleanrooms. Oklahoma, 2018.
19.Reinmüller B. People as a Contamination Source — Clothing Systems. Dispersion and Risk Assessment of Airborne Contaminants in Pharmaceutical Cleanrooms. Building Services Enginiring Bulletin, 2001, no. 56, pp. 54—77.
20.Sun J. M. W., Flyzik K. Cleanroom pressurization strategyupdate-Quantification and validation of minimum pressure differentials for basic configurations and applications. ASHRAE Trans, 2013, part 1, p. 16.
81

Russian Journal of Building Construction and Architecture
21.Tschudi W., Faulkner D., Hebert A. Energyefficiencystrategies for cleanrooms without compromising environmental conditions. ASHRAE Transactions, 2005, vol. 111, part 2, no. 2, pp. 637—645.
22.Villafruela J. M., Castro F., San Jose J. F., Saint-Martin J. Comparison of air change efficiency, contaminant removal effectiveness and infection risk as IAQ indices in isolation rooms. Energy Build, 2013, vol. 57, pp. 210—219.
23.Whyte W., Whyte W. M., Eaton T. The application of the ventilation equations to cleanrooms; Part 2: Decay of contamination. Clean Air and Containment Review, 2014, no. 20, pp. 4—9.
24.Xie X., Li Y., Chwang A. T., Ho P. L., Seto W. H. How far droplets can move in indoor environmentsrevisiting the Wells evaporation-falling curve. Indoor Air, 2007, jun., no. 17 (3), pp. 211—25.
82

Issue № 3 (51), 2021 |
ISSN 2542-0526 |
DESIGNING AND CONSTRUCTION OF ROADS, SUBWAYS,
AIRFIELDS, BRIDGES AND TRANSPORT TUNNELS
DOI 10.36622/VSTU.2021.51.3.007 UDC625.8
V. V. Volkov1, V. A. Kozlov2, V. N. Melkumov3
EXPERIMENTAL STUDIES OF WEARING AND TEARING
OF ASPHALT CONCRETE SURFACING UNDER THE ACTION
OF WATER PRESSURE IN MICROPORES
Voronezh State Technical University1, 2, 3
Voronezh, Russia
1PhD in Physics and Mathematics, Assoc. Prof. of Structural Mechanics, tel. (473) 276-40-06, e-mail: kotlac@yandex.ru
2Sc. D. In Physics and Mathematics, Head of the Dept. of Structural Mechanics, tel. (473) 276-40-06, e-mail: v.a.kozlov1@yandex.ru
3Sc. D. in Engineering, Prof. of the Dept. of Heat and Gas Supply and Oil and Gas Business, tel. (473) 271-53-21, e-mail: ser.chu@mail.ru
Statement of the problem. Thegoal ofthisstudyistoidentifytheeffect ofwet surfacing on itswear and tear. Themechanism ofinfluence oftransport loadingin the presence ofmoisture andexperimental methodsofmeasurementofitsinfluenceon wear andtear ofthetoplayer ofasphaltconcretearediscussed.
Results. The contribution of the presence of moisture in the upper layer of the pavement to its wear and tear in the form of track formation was identified, and the hydrodynamic effect of water in the micropores of the pavement was investigated. Experimental data on the values of water pressure in the pores of the asphalt-concrete pavement in the moistened state under the action of the wheels of the moving traffic flow were obtained. Therefore it became possible to identifythe maximum values of the pressure effect, the depth of penetration of the fluid pressure front and its effect on the destruction of the surfacing.
Conclusions. The analysis of the data showed not only the presence of brittle fracture, but also the impact of moisture moving in the pores of asphalt concrete, exceeding its structural strength. Using experimental data, regression dependences of the wear and tear value on the standard flow parameters were obtained. For the operated surfacings regression dependence enables one to predict the size of wear and tear for the whole life cycle of the road.
Keywords: road surface wear, water pressure in a porous medium.
Introduction. A lot of scholars have been researching the field of vehicle interaction and surfacing: A. A. Khachaturov, A. K. Birulya, N. Ya. Govorushchenko, R. V. Rotenberg, F. I. Bomhard, N. Moppert and other foreign scientists [ 7, 8, 10––15, 17, 18].
© Volkov V. V., Kozlov V. A., Melkumov V. N., 2021
83

Russian Journal of Building Construction and Architecture
In experimental studies [3, 4], measurements were conducted on dry surfacings or in the presence of low moisture content, which did not enable researchers to separate dry and wet wear in the presence of moisture.
In [5], integral indicators of the smoothness of the surfacing were used viewing them in the context of the additive effect of the transport flow, which did not allow one to understand the mechanism of different speed wear and tear of the dry and wetted surfacing either. The authors assumed there was some pressure in the micropores of the upper layer of the road, but the existing methods and techniques for identifying this pressure have not been sufficiently tested, so qualitative methods for identifying the humidity and porosity of asphalt concrete have been employed [6].
The development of the theory of failure of materials under the action of a high-velocity water jet [12] has shown that the pressure emerging at the point of concentration of the material stress might cause further defects in the form of a crack. This phenomenon is called the «waterjet» effect known to specialists in the industrial processing of materials by means of a jet of water. A similar failure takes place with the piston effect along the pore line of the upper layer of road material under the pneumatic action of the tire. In this case, the maximum value of the hydrodynamic pressure exceeds that of the strength ofthe material itself or that of the tensile strength of the mineral component [17]. Emerging internal stresses do not only cause the entrainment of the mineral component, but also the formation of a network of micropores and cracks.
While vehicles are moving on the road, the impact of wheel tires on asphalt concrete has a different nature for the dry and wet condition of the road surface due to pores and microcracks. In the moistened state, the bubble structure of the aqua trace is indicative of the microcirculation of water in the upper thin layer of the road surfacing. The resulting pressure in the area of contact of the wheel with the road is the cause of failure of the upper layer of the surfacing, which is washing of its mineral components. According to the performed mathematical modeling [9], there is wear and tear resulting from the impact of the wheels of moving vehicles in the presence of water on the surfacing («waterjet»). In order to verify the data obtained by means of mathematical modeling, a technique was developed and an original system for measuring the pressure in the pores of the surface of the pavement while a vehicle is passing with simultaneous registration of the deflection of the road structure was set forth.
The object of the study are asphalt concrete pavements of roads under the influence of traffic. The subject of the study is the process of wear and tear of the upper layer of the road surface
84
Issue № 3 (51), 2021 |
ISSN 2542-0526 |
from the resulting water pressure in the micropores in the area of contact of the wheels with
the road.
1. Identifying deformations and wear and tear of the road surface in dry and wet state.
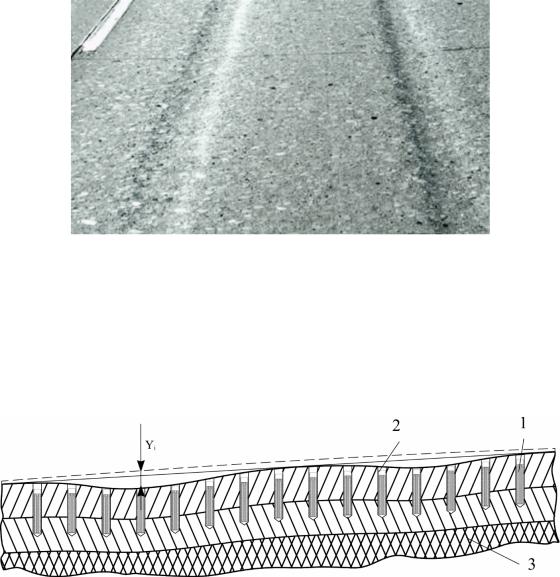
Experimental studies are based on the common and private techniques that enable the maximum information about the processes of wear and tear of the asphalt pavement to be measured and obtained. The maximum amount of wear and tear on the width of the road surface under study is observed on the section with a track. Tracks are formed due to staining of the mineral part of the road surface and plastic deformations of asphalt concrete under the action of repeated loads from the wheels of vehicles (Fig. 1).
Fig. 1. Photo of a section of the road surface with a defect in the form of a track
Sensors are set up on the selected section of the road in order to measure the amount of road wear and tear. To ensure the smoothness and high accuracy of the periodicity of the markers, their strictly vertical arrangement uses a template in the form of a long wooden rail with predrilled holes onthe machine. Fig. 2 showsthe layout ofthe markers in the asphalt surfacing.
Fig. 2. Schematic of the position of the markers in a road section.
1 is a marker; 2 is the road surfacing; 3 is the lower layer
85

Russian Journal of Building Construction and Architecture
The drilling depth of the asphalt surfacing corresponds to that of the position of the markers. Particles and chips emerging during drilling of asphalt concrete are removed by blowing with compressed air. Using a pin setter, the marker is inserted to a depth of 15 mm from the top face. The diameter of the hole for the markers is 10 mm, the pitch of the markers for measurements is 10 cm. In order to protect the channel and the marker from water, dirt and dust, it is closed with a silicone rubber stopper and filled with a bitumen one.
а) |
b) |
c) |
Fig. 3. а) structure of a marker sensor; b) composites; c) measuring film; 1 is an external sleeve; 2 is a thin-walled tube; 3 is a sleeve –– clamp; 4 is a fixing rod; 5 is a film
Fig. 3 a) shows a drawing of the resulting marker sensor, which is a thin-walled tube with a diameter of 8 mm and a length of 80 mm made of stainless steel with a wall thickness of 0.25 mm, position 2. In the tube wall holes are made with a diameter of 1.25 mm, with a vertical and horizontal step, 2.5 mm respectively. The inner surface is polished thoroughly. A caprolon sleeve with an outer diameter of 7.3 mm, position 3, is inserted into this tube. A slot is made in the sleeve for fixing the barosensitive film, Fig. 3 c). For effective clamping, a fixing rod with a diameter of 5 mm is screwed, position 4. Notches are made for the correct positioning of the sensor. Prior to surfacing, the fabricated markers had been tested for sensitivity to hydrostatic pressure in various materials. In order to increase the accuracy of the measurements, the sensors were calibrated with an autoclave setup.
86

Issue № 3 (51), 2021 |
ISSN 2542-0526 |
The accuracy of measuring the wear and tear of the surfacing Y1 is 0.01 mm from the surface of the asphalt to the lower edge of the measuring line, and to the top of the reference marker ––
Y2. The deformation values S1 and S2 are measured for recording changes in the deformed state of the surfacing. In the in-house processing of the results, the measured values are processed by means of the methods of mathematical statistics. In this case, S1 simultaneously identifies the amount of plastic deformation and the wear and tear. A caliper is used to measure the distance from the lower face of the measuring rail to the end of the marker.
The amount of deformable material and wear and tear is proportional to the cross-sectional area S which can be given by the formula:
SN S2i S2 i 1 S1i S1 i 1 , 2 i 1
where а is the distance between the neighboring markers.
The average value of wear ξ in the examined section for any period of road operation is given by the formula:
|
1 |
N |
|
|
|
|
2 |
i 1 |
Y2i |
Y2 i 1 Y1i Y1 i 1 |
|
12 N Y2'i Y2' i 1 Y1'i Y1'i 1 ,
i 1
where N is the number of cars passing through the section; Y is the distance from the measuring line to the marker in the initial position; Y’ is the distance from the measuring line to the marker after passing of another car.
Fig. 4. Graphs of track change and wear and tear on the road surface in dryand wet state. 1 is the track depth; 2 is the difference of track depth for two sections of the road;
3 is the difference between the wear and tear on the dryand wet roads;
4 is the difference between the values of the wear and tear of the wet and moist road surfaces
87

Russian Journal of Building Construction and Architecture
Fig. 4 shows the values of the geometric parameters of the track in the form of wear and tear on the sections over the month. The profile clearly indicates both areas of plastic deformation in the form of the track and protrusions, and areas with wear and tear, in the absence of the previous ones. The impact of traffic flow on the road structure in the initial period is manifested in minor deformations, while subsequent operation reveals a drop in the wear and tear. At the same time, a larger amount of wear and tear is manifested in the tracks themselves, and as water is retained in these areas more, it can be argued that the presence of moisture in the tracks has an extra effect on the wear and tear of the surfacing.
The analysis of the change in the geometric position of the points of the upper layer of the surfacing and the markers showed there are not only longitudinal deformations, but also transverse ones. It is possible to separate plastic deformations and wear and tear on the clamps if the general change of the position of the material of asphalt concrete in the section and change of the area are observed given that it is constant in the initial condition.
2. The method of identifying the amount of pressure in the pores and wear and tear in the
wet surfacing. In order to verify the obtained data of mathematical modeling, a method for identifying the water pressure in the micropores while a vehicle is passing on the surfacing with simultaneous record of the deflection of the road structure was developed [5, 16]. Using this technique, data were obtained based on the parameters of the dynamic effect of water and its effect on the amount of wear and tear and irreversible deformation ofthe surfacing.
In order to assess the impact of water on the wear and tear of the surfacing, two sections on roads without branches and changes in the technological cycle of road construction were selected. The markers were placed on each section, fixing the applied pressure, as well as their geometric position in the surfacing material. In order to simulate different cases of the surfacing state, each section was put in one ofthree states: dry, moistened and covered with a thin layer of water for a period oftime.
Measurement and recording of hydrostatic pressure in the surfacing using barosensitive films set up in the marker sensors wasconducted in the following order:
extraction ofa strain film fromthe marker;
washing ofthe strain film and drying at 400C;
application ofa straightening composition, marking and registration;
laying on the scanner with a clip of a reflective film and drawing of immersion liquid;
scanning (at least three times) and saving for further processing;
image processing in the mathematicalpackage MATLAB: calibrationcorrection, analysis ofthe brightnessofpixelsand their area, statisticalanalysisofthe pressure distribution;
88
Issue № 3 (51), 2021 |
ISSN 2542-0526 |
constructionof correlations;
constructionof a vertical pressure profile;
constructionof a circular pressure profile.
Measurement of geometrical parameters ofthe surfacing and extraction ofthe marker-sensors is performed following several stages of humidification of the sites and passing of vehicles, followed by new films beign set up for the next stagesofthe measurement.
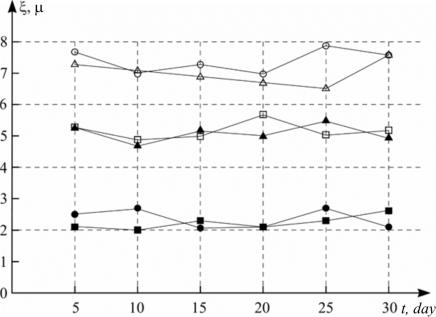
Fig. 5 shows a graph of changes in the wear and tear over the month on two selected sections of the road in different operating conditions: drylower curves; periodically moistened –– average curves; with a constant humidityupper curves. The analysis of the change in the wear and tear in different sites shows that in the presence of moisture on the surfacing, the wear and tear rate goes up. At the same time, a larger amount of wear and tear with the formation of ruts is manifested in the areas where water is retained more. This serves to indicate the effect on the wear and tear ofthe surfacing on the moisture in the tracks.
Fig. 5. Graphs of wear and tear change on the 1st and 2nd sections of the surfacing in their various operational
condition (dry, periodicallymoistened, with a constant humidity)
The analysis of experimental data related to the wear and tear of the surfacing showed the presence of local values, and the form of the obtained curves is quadratically dependent on the speed of the transport flow. At the same time, the measurement of vehicle weight, record of the pressure exerted by the tires of the wheels showed there is a logarithmic dependence of
89