

Учебное пособие 2210
.pdfIssue № 4 (36), 2017 |
ISSN 2542-0526 |
NF |
|
|
|
|
|
rn |
|
|
|
|
|
fk 1 |
|
|
|
|
|
|
|
. |
(8) |
||
|
|
|
|
|
2 |
|
|
||||
n 1 |
|
n |
2 |
2 |
2 k nf p |
2 |
|
||||
|
1 |
|
|
f p |
|
|
|
|
|||
|
|
|
2 |
|
|
||||||
|
|
|
|
|
|
|
|
|
|
||
|
|
|
|
fk |
|
|
fk |
|
|||
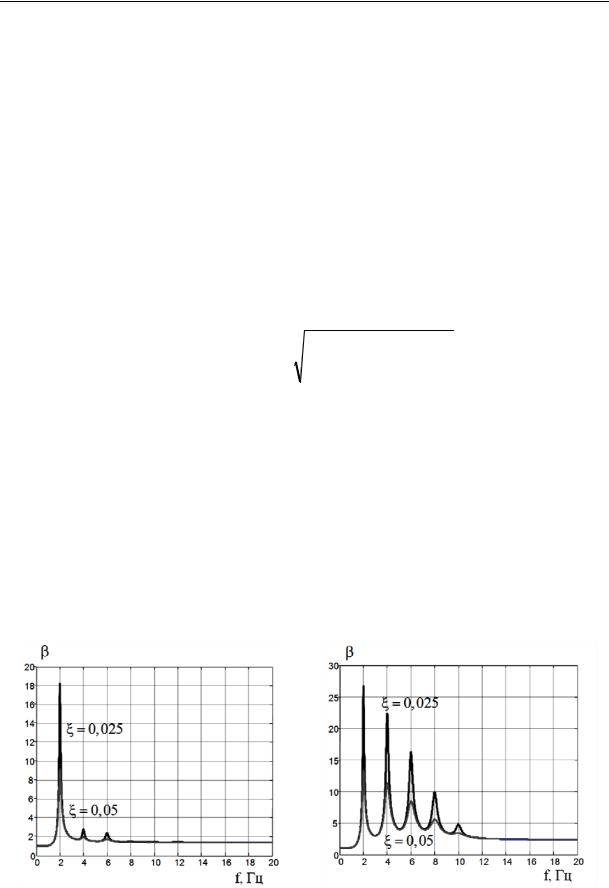
Fig. 2 shows the graphs of the dynamic factors in the axes of eigenfrequencies β(fk) at the impulse frequency fp=2 Hz: а) for pedestrian movement α = 2/3 and b) for high jumps α = 1/4; both graphs are designed for 5 % damping (the grey line) and 2,5 % damping (the black line).
а) |
b) |
|
|
f, Hz |
|
|
|
|
|
|
|
|
|
f, Hz |
|
|
|
|
|
|
||
|
|
|
|
|
||
|
|
|
|
|
|
|
|
|
|
|
|
|
|
|
|
|
|
|
|
|
Fig. 2
3. Quasi-static probabilistic solution
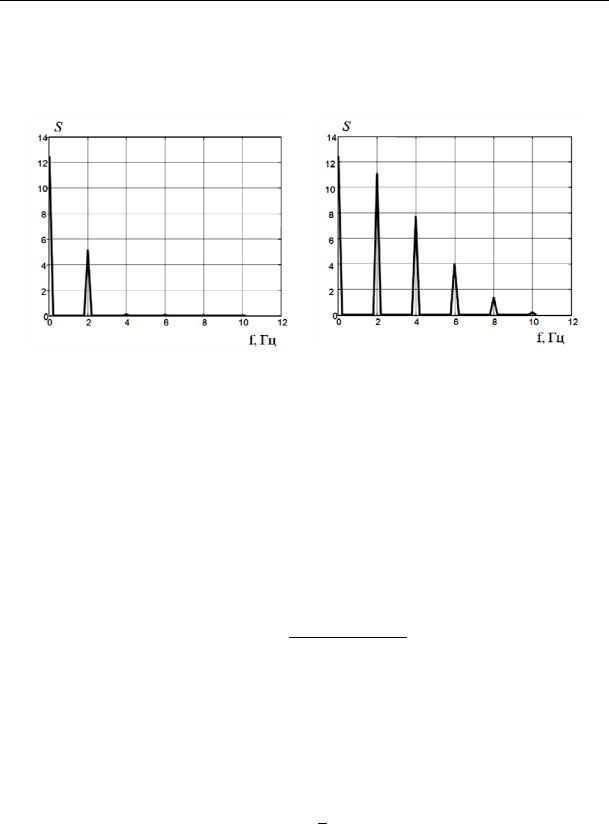
A random process corresponding to an impulse load is narrow, i.e. it is determined for a discrete set of frequencies nθ using the formula (2). The spectral density of the impulse load is functions close to the δ-function along the coordinates corresponding with the impact frequencies nθ, n =1, …, NF. Fig. 3 shows the graphs of spectral densities S, (kN/m2)2/Hz corresponding with the impulse loads in Fig. 1 at the impulse frequency fp = 2 Hz: а) for pedestrian movement α = 2/3, b) for high jumps α = 1/4.
In a temporary interval of active loading by a single impact a random process of spectator movement on a stand can be considered stationary, i.e. the average value and standard do not depend on time. The average value of a random process considering the ratios
Kp  2 , tp
  Tp
Tp
is
|
1 |
Tp |
F t dt |
K pG Tp |
t |
K pG tp |
|
|
||||
mF |
|
|
|
|
|
|
|
2 |
|
G . |
(9) |
|
|
|
|
|
|||||||||
Tp 0 |
Tp 0 |
sin |
dt |
|
|
|||||||
|
|
tp |
Tp |
|
|
|||||||
131
Russian Journal of Building Construction and Architecture
Therefore a load from the coordinated crowd movement can be considered as a stationary random process with an average value of that of a static load G.
а) |
b) |
|
|
|
|
f, Hz |
|
|
f, Hz |
|
|||
|
Fig. 3 |
|
|
|
|
The movement of the system (6) can be presented in the following way: |
|
|
|||
|
u 2 u 2u |
Q , |
(10) |
||
where Q(t) is a stationary process at the input that corresponds with an external impact on the system; u(t) is a stationary process at the output that corresponds with a response (movement) of a system.
If a spectral density of a stationary process at the input SQ(θ) is known, a spectral density of a process at the output Su(θ) for a linear stationary system (10) is given by the formula [1, 2]
Su |
SQ |
|
2 2 2 4 2 2 . |
(11) |
The concept of the dynamic factor is introduced similarly to determined established oscillations for harmonic loading. This factor shows by how many times a static load is to be increased so that dynamic effects are considered in the quasi-static approach.
Let us separate the constant multiplier G from the right part of the equation (10), which is an average value of a random load Q , then a generalized random force is
Q t GQ t .
Based on linearity of the system (10),
u t Gu t ,
132

Issue № 4 (36), 2017 |
ISSN 2542-0526 |
where the random process u is movement from the force Q . Then due to stationarity of the
processes at the input and output the average square u2 |
(or the dispersionDu ) is |
|
|||
2 |
D G2D |
|
. |
(12) |
|
u |
u |
u |
|
||
The dynamic factor β for random loads is determined as a ratio of the dynamic movement u to the static movement uG (i.e. the movement from the static load G):
|
|
|
|
|
|
|
|
|
|
|
|
|
|
|
|
|
|
|
|
|
|
|
|
|
|
|
|
|
|
|
|
|
u u . |
|
|
|
|
|
|
|
|
|
|
|
|
|
|
|
(13) |
|
|
|
|
|
|
|
|
G |
|
|
|
|
|
|
|
|
|
|
|
|
|
|
|
|
The square of the standard |
2 |
is the dispersion of the process at the output |
D |
and is con- |
||||||||||||||||||||
|
u |
|
|
|
|
|
|
|
|
|
|
|
|
|
|
|
|
|
|
|
|
|
u |
|
nected to the spectral densities Su |
and SQ . Considering (12): |
|
|
|
|
|
|
|
||||||||||||||||
2 |
|
2 |
|
|
2 |
|
2 |
|
|
|
SQ |
|
|
|
|
|
|
|||||||
u Du |
G D |
|
G S |
|
d G |
|
|
|
|
|
|
|
|
|
|
|
|
|
d . |
(14) |
||||
|
|
|
|
|
|
|
|
|
|
|
|
|
||||||||||||
u |
u |
|
|
2 |
|
2 |
|
2 |
|
2 |
|
2 |
||||||||||||
|
|
|
|
|
|
0 |
|
|
|
0 |
|
|
|
|
4 |
|
|
|
|
|||||
The static movement uG does not depend on time and is determined using the equation (10) at
Q = G:
u G 2 . |
(15) |
G |
|
The final formula for the dynamic factors of the system with one degree of freedom is obtained using the equation (13) considering (14) and (15):
|
|
|
|
|
|
|
|
|
|
|
|
|
|
|
1 |
|
|
|
|
|
|
4 |
SQ |
|
|
|
|
|
2 |
||
|
|
|
|
|
|
|
|
|
|
|
|||||
|
|
2 |
|
2 |
|
2 |
2 |
|
2 |
d |
. |
||||
|
|
0 |
|
|
|
|
4 |
|
|
|
|||||
For multidimensional systems when a dynamic factor is different for oscillations along each k-th eigenfrequency, it is assumed to be a function of the eigenfrequencies Ωk:
|
|
|
|
|
|
|
|
|
|
|
|
1 |
|
|
|
|
4 |
|
|
|
|
|
|
|
2 |
k |
|
|
|
k SQ |
|
|
|
|
||||
|
2 |
|
2 |
|
2 |
2 |
|
2 |
d |
. |
||
|
|
0 |
k |
|
|
4 k |
|
|
|
|||
This formula can be written using the modal damping coefficient k ( k k k ) and the frequencies expressed in Hz (SQ SQ f  2 , 2 f , k 2 fk ):
|
|
|
|
|
|
|
|
|
|
|
1 |
|
|
|
|
|
|
|
|
|
|
|
|
2 |
|
|
|
|
|
|
SQ f |
|
|
|
|
|||
|
|
|
|
|
|
|
|
|
||||
fk |
|
|
|
|
|
|
|
|
|
|
df . |
(16) |
|
|
f |
2 |
|
2 |
f |
2 |
|||||
|
0 |
|
p |
4 2 |
p |
|
|
|||||
|
|
1 |
|
|
|
|
|
|
||||
|
f |
|
f |
|
|
|||||||
|
|
|
2 |
|
k |
2 |
|
|||||
|
|
|
|
|
k |
|
|
|
k |
|
|
|
133
Russian Journal of Building Construction and Architecture
Fig. 4 shows the graphs of the dynamic factors β(fk) designed using the formula (16) for the frequency of the impulses fp = 2 Hz: а) for pedestrian movement α = 2/3 and b) for high jumps α = 1/4. The black line corresponds to 2.5 % damping, the grey line to 5 % damping.
4. Test calculation using a temporary range and result analysis
Based on the example of the system with one degree of freedom, we will consider how the quasi-static solutions described in Section 3 and 4 correlate with the test calculation in a temporary range. The formula (7) for the established movements of a one-mass system (10) is as follows:
|
|
|
|
|
|
|
|
|
|
|
|
|
|
|
|
|
|
|
|
G |
|
|
|
rn sin n t n |
|
|
|
|
|||||||||
|
|
NF |
|
|
|
|
|
|||||||||||
u t |
|
|
1 |
|
|
|
|
|
|
|
|
|
|
|
|
. |
(17) |
|
|
2 |
|
2 |
|
|
2 |
|
2 |
|
|
|
|
2 |
|||||
|
|
|
n 1 |
1 |
|
|
|
|
2 n |
|
|
|||||||
|
|
|
|
|
n |
|
|
|
|
|
|
|||||||
|
|
|
|
|
|
|
2 |
|
|
|
|
|
2 |
|
|
|
|
|
|
|
|
|
|
|
|
|
|
|
|
|
|
|
|
|
|||
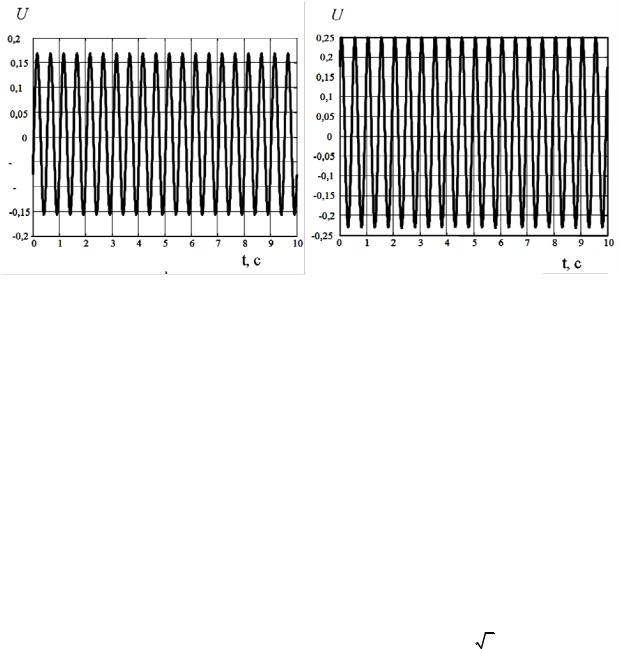
The test calculation is performed for a resonance mode when the frequency of an impulse load coincides with the eigenfrequency of the system: θ = Ω = 12.5664 rad/sec (2 Hz). Fig. 5 presents movements, m, as a time function, sec, for pedestrian movement (а) and high jumps (b) in the range of 10 seс.
The load G is assumed to be one. Using the graphs, let us determine the probabilistic and determined dynamic factors and compare them with the factors obtained in Section 2 (see Fig. 2) and Section 3 (Fig. 4).
а) |
b) |
|
|
f, Hz |
f, Hz |
||
|
Fig. 4 |
|
|
||
134
Issue № 4 (36), 2017 |
ISSN 2542-0526 |
а) |
b) |
|
f, sec |
|
|
|
|
|
|
f, sec |
|
|
Fig. 5 |
|
|
|
|
|
|
||
For pedestrian movement: the amplitude of the |
oscillations ua = 0.1624, average value |
|||
um = ust = 0.0063, standard σu = 0.1152; for the frequency 2 Hz the determined efficiency coefficient is βdet = ua /um = 25.78, the probabilistic one βstoch = σu /um = 18.29. The corresponding values in the diagrams (see Fig. 2а, 4а): βdet = 26.79 (the error is 3.8 %), βstoch = 18.24 (the error is 0.3 %).
For high jumps: the amplitude of the oscillations ua = 0.2432, average value um = ust = 0.0064, standard σu = 0.1689; for the frequency 2 Hz the determined efficiency coefficient is βdet = ua /um = 38.00, the probabilistic one βstoch = σu /um = 26.39. The corresponding values in the diagrams (see Fig. 2b, 4b): βdet = 39.44 (the error is 3.7 %), βstoch = 26.69 (the error is 1.1 %). The test resuts are indicative of the two above approaches being correct.
Note that as shown in [5], for the impulse spectral density stoch  det 1
det 1 2 0.707. This is due to the fact that βstoch is a standard of a random dynamic factor. The ratio βstoch/βdet will be dropping considering a random character of the load.
5. Evaluation of the spectators’ perception of vibrations
A human body is a viscoelastic system with its own frequencies. Resonance frequencies of certain body parts are as follows: [3]: eyes — 12—27Hz, throat — 6—27 Hz, chest — 2— 12 Hz, legs and arms — 2—8 Hz, head — 8—27 Hz, face and jaw — 4—27 Hz, lumbar spine — 4—14 Hz, stomach — 4—12 Hz. For the oscillation frequencies close to the resonance ones vibrations might have a range of negative impacts from unpleasant sensations to
135

Russian Journal of Building Construction and Architecture
severe functional and physiological damage. The qualitative assessment of subjective perceptions caused by vibration is shown in Fig. 6 [3] as ranges of equal perception: а) depending on vibration movements and frequency, b) depending on vibration acceleration and frequency. Different levels of unpleasant sensations summed in Table correspond to each range of equal perception.
а) |
b) |
||
|
|
|
|
|
u, mm |
|
a, cm/sec2 |
|
|
|
|
|
|
f, Hz |
|
|
|
f, Hz |
|
|
|||
|
|
|
|
|
|
|
|
|
|
|
|
Fig. 6 |
|
|
|
|
|
|
|
|
|
|
|
|
|
|
|
|
|
|
Таble 3 |
|
|
|
|
|
|
|
|
Range |
Vibration |
Range |
Vibration |
||||
|
|
|
|
|
|
|
|
1 |
Imperceptible |
4 |
Strongly perceived |
||||
|
|
|
|
|
|
|
|
2 |
Poorly perceptible |
5 |
Unpleasant during long-term impact |
||||
|
|
|
|
|
|
|
|
3 |
Well perceived |
6 |
Unpleasant during short-term impact |
||||
|
|
|
|
|
|
|
|
For significant vibration levels in the range of 4—10 Hz humans might feel discomfort and pain due to resonance in the “chest-stomach” system. The most comfortable condition for the vibrations with the frequencies from 1 to 4 Hz (vibrations are not perceived) is at the vibration accelerations of up to 1 сm/seс2, vibration movements of up to 1 mm. This data is in agreement with the acceptable vibration acceleration documented in the health and safety guidelines [11]. Hence in order to evaluate the spectators’ perception using Fig. 6 and Table, it is necessary that the amplitudes of the movements and accelerations are known. The amplitudes of the movements and accelerations can be calculated according to the formula (7). Differentiat-
136
Issue № 4 (36), 2017 |
ISSN 2542-0526 |
ing the movements (7) in time twice and assuming that the sinuses are one, we obtain the maximum modal acceleration:
|
1 |
N |
|
|
|
2 |
|
2 |
rn |
|
|
|
|
maxuk |
vTk PG F |
|
|
|
n |
|
|
|
. |
(18) |
|||
2 |
|
|
n2 2 2 |
|
|
|
|
||||||
|
k M mod,k |
n 1 |
|
|
2 n 2 |
|
|||||||
|
|
|
1 |
|
2 |
|
|
k 2 |
|
|
|||
|
|
|
|
|
k |
|
|
|
k |
|
|
||
Let us introduce the modal coefficient of reducing the static movements to the accelerations Cacc (the coefficient that the static movement should be multiplied by in order for the maximum acceleration to be obtained):
N |
|
|
|
|
n |
2 |
rn |
|
|
|
|
|
Cacc 2 F |
|
|
|
|
|
|
|
|
. |
(19) |
||
|
|
|
n2 2 2 |
|
2 |
|
|
|||||
n 1 |
|
1 |
|
|
n 2 |
|
||||||
|
|
2 |
|
|
|
|
k 2 |
|
|
|||
|
|
|
|
k |
|
|
|
k |
|
|
||
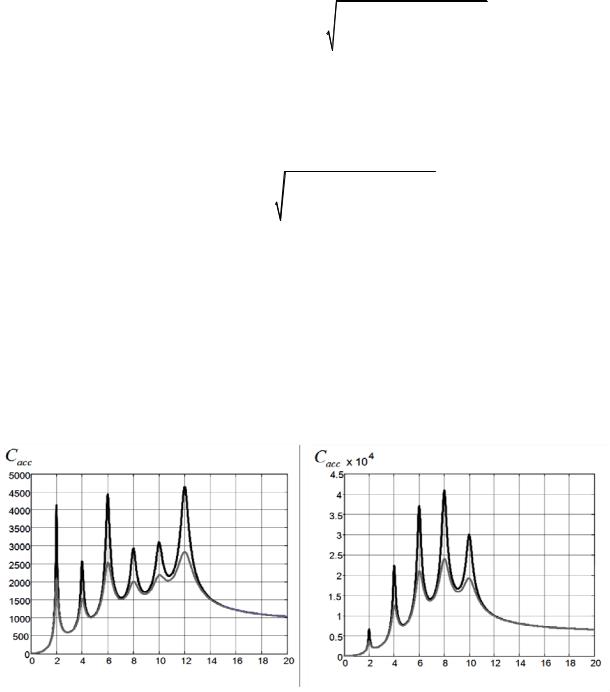
The coefficients Cacc are determined for each eigenfrequency (Fig. 6) and are thus modal as well as the dynamic factor. An example of a diagram of Cacc in Fig. 6 is given for the impulse frequency fp =2 Hz: а) for pedestrian movement α = 2/3 and b) for high jumps α = 1/4. The black line corresponds to 2.5 % damping, the grey one to 5 % damping. Using the values of the dynamic movements and accelerations at a known impact frequency the spectators’ perception level is determined according to Table and Fig. 6.
a) |
b) |
f, Hz |
f, Hz |
|
Fig. 7
Conclusions
The study revealed the following features of loading caused by coordinated crowd activity: 1. Impulse impact (1) has such a property that at the same impulse frequency several forms of
137

Russian Journal of Building Construction and Architecture
oscillations in a structure are excited. Hence spectators synchronously jump with the frequency of 2 Hz, resonances will be not only for eigenfrequencies of a structure of 2 Hz but also for 4, 6, 8 Hz if there are any (Fig. 2, 4). It is most dangerous when a spectrum of eigenfrequencies interrupts a range of possible frequencies of forced oscillations of 1—4 Hz. The dynamic factors reach their maximum. As noted in [5], if this is the case, a dynamic calculation is not advisable, it is thus necessary to take construction measures in order to avoid resonance. A dynamic response is on the rise if static movements are large (particularly for console structures);
2. Loading is narrow, i.e. the entire impulse energy is focused on certain frequencies nf and the spectral impact density is a sequence of impulse functions at these frequencies, n = 1, 2, …, NF. Therefore the dynamic factors turned out to be incredibly high: up to 14 at 5 % and up to 26 at 2.5 % damping in a resonance mode for pedestrian movement, up to 20 at 5 % and up to 39 at 2.5 % damping in a resonance mode for high jumps. Note that these dynamic factors correspond to absolutely synchronous human movement with the same phase, frequency and amplitude, which is obviously unlikely. It is reasonable to reduce the dynamic factors considering inconsistency of crowd movement. In foreign methods the parameters of a dynamic response are suggested to be multiplied by the non-synchronous coefficient, which is 0.67 [12]. However, this can be dealt with in a more accurate manner by introducing the random parameters of dynamic load such as amplitude, movement phase as well as spatial distribution. Spectral density will be smoother, the peak ordinates will drop and so will the dynamic factors;
3.In order to reduce the amplitudes of oscillations, it is reasonable to make use of the technologies enhancing the damping properties of structures;
4.Since a vibration level might be high and unpleasant for spectators, it is necessary that a calculation is supplemented by the evaluation of a level of perceived vibrations. Note that if the healthy and safety regulations [11] are adhered to, stands are to provided the “vibrations are not felt” level, which is barely impossible to implement for sporting structures.
References
1. Bolotin V. V. Metody teorii veroyatnostey i teorii nadezhnosti v raschetakh sooruzheniy. Izd. 2-e, pererab. i dop. [Methods of probability theory and reliability theory in calculations of constructions. Ed. second, revised and enlarged]. Moscow, Stroyizdat Publ., 1982. 352 p.
138
Issue № 4 (36), 2017 |
ISSN 2542-0526 |
2.Bolotin V. V. Statisticheskie metody v stroitel'noy mekhanike [Statistical methods in structural mechanics]. Moscow, Stroyizdat Publ., 1961. 160 p.
3.Vibratsii v tekhnike: spravochnik: v 6 t. T. 6. Zashchita ot vibratsii i udarov [Vibration in engineering: Handbook in 6 vol. Vol 6. Protection from vibration and shock]. Moscow, Mashinostroenie Publ., 1981. 456 p.
4.Gul'vanesyan Kh., Formichi P., Kalgaro Zh. A. Rukovodstvo dlya proektirovshchikov k Evrokodu 1. Vozdeystviya na sooruzheniya. Razdely EN 1991-1-1 i s 1991-1-3 po 1991-1-7 [Guide for designers to the Eurocode 1. Effect on the structures. Sections 1991-1-1 EN 1991-1-3 and at 1991-1-7]. Moscow, MGSU Publ., 2011. 264 p.
5.Nazarov Yu. P. Dinamika sportivnykh sooruzheniy [The dynamics of sports facilities]. Moscow, Nauka Publ., 2014. 222 p.
6.Nazarov Yu. P. Raschetnye modeli seysmicheskikh vozdeystviy [The analysis model of seismic effects]. Moscow, Nauka Publ., 2012. 414 p.
7.Nazarov Yu. P., Zhuk Yu. N., Simbirkin V. N., Anan'ev A. V., Kurnavin V. V. [Expert evaluation of design solutions the Central stadium and the Big ice arena for ice hockey in Sochi]. Aktual'nye problemy issledovaniy po teorii sooruzheniy: sbornik nauchnykh statey: v 2 chastyakh. Chast' 2 [Actual problems of the theory of structures: collection of scientific articles in 2 parts. Part 2]. Moscow, TsPP, 2009, pp. 8—16.
8.Nazarov Yu. P., Poznyak E. V. Opredelenie koeffitsienta dinamichnosti v raschetakh na seysmostoykost' [The definition of the dynamic factor in the calculations for seismic]. Available at: http://www.nso-journal. ru/public/journals/1/issues/2015/01/2_Nazarov.pdf
9.Nazarov, Yu. P., Simbirkin V. N. Kolebaniya konstruktsiy sportivno-razvlekatel'nykh kompleksov pri vozdeystvii lyudey [Fluctuations in construction it is sports-entertainment complexes when exposed to people]. Mir stroitel'stva i nedvizhimosti, 2009, no. 34, pp. 14—17.
10.Nazarov Yu. P., Simbirkin V. N. Analiz i ogranichenie kolebaniy konstruktsiy pri vozdeystvii lyudey [Anal-
ysis and limitation of oscillations of the structure when exposed to people]. Vestnik TsNIISK im. V. A. Kucherenko. Issledovaniya po teorii sooruzheniy, 2009, no. 1 (XXVI), pp. 10—18.
11.SN 2.2.4/2.1.8.566-96. Proizvodstvennaya vibratsiya, vibratsiya v pomeshcheniyakh zhilykh i obshchestvennykh zdaniy. Sanitarnye normy [SN 2.2.4/2.1.8.566-96. Industrial vibration, vibration in residential and public buildings. Sanitary standards]. Saint Petersburg, 2014. 32 p.
12.BS 6399-1:1996. Part 1: Code of practice for dead and imposed loads. London, British Standards Institution (BSI), 1996. 16 p.
13.Ellis B. P., Ji T. Human-structure interaction in vertical vibrations. Proc. Institution of Civil Engineer: Structures and Buildings, 1997, no. 122 (1), pp. 1—9.
14. Ellis B. P., Ji T. Loads generated by jumping crowds: Numerical modeling. Structural Engineer, 2004, no. 82 (17), pp. 35—40.
15.IStructE/ODPM/DCMS working group. Dynamic performance requirements for permanent grandstands subject to crowd actions. Interim guidance on assessment and design. Publications and Reports. London (UK), 2001, no. 79 (6). 60 p.
16.Jones C. A., Reynolds P., Pavic A. Vibration serviceability of stadia structures subjected to dynamic crowd loads: A literature review. Journal of Sound and Vibration, 2011, vol. 330, iss. 8, pp. 1531—1566.
139

Russian Journal of Building Construction and Architecture
17.Kelly A., Salyards, Hua Yue. Assessment of dynamic properties of a crowd model for human-structure interaction modeling. Engineering Structures, 2015., vol. 89, pp. 103—110.
18.Mazzoleni P., Zappa E. Vision-based estimation of vertical dynamic loading induced by jumping and bobbing crowds on civil structures. Mechanical Systems and Signal Processing, 2012, vol. 33, pp. 1—12.
19.Racic V., Chen Jun. Data-driven generator of stochastic dynamic loading due to people bouncing. Computers & Structures, 2015, vol. 158, pp. 240—250.
20.Sim J. H. Human-Structure Interaction in Cantilever Grandstands: Ph. D. Thesis. Part 2. University of Oxford, 2006. 91 p.
21.Venuti F., Bruno L. Crowd-structure interaction in lively footbridges under synchronous lateral excitation: A literature review. Physics of Life Reviews, 2009, vol. 6, iss. 3, pp. 176—206.
140