

Учебное пособие 2210
.pdfIssue № 4 (36), 2017 |
ISSN 2542-0526 |
mix obtained is 32 %. On addition of fly ash and silica fume the normal consistency of cement paste increases. The outer surface of fly ash particles increases with increase in fly ash content, the amount of absorbed calcium ion increases. This inhibits calcium ion concentration built up in fresh paste during early hydration resulting setting time is prolonged and thus the heat of hydration decreases causing consistency to increase. Also the results show that both Initial setting time and final setting time of mix increase as replacement level of fly ash increases. There is lesser effect on final setting time as compared with initial setting time at same replacement level of fly ash.
|
|
|
|
|
|
|
|
|
|
|
|
Table 2 |
|
|
|
|
|
Results |
|
|
|
|
|
|
|
|
|
|
|
|
|
|
|
|
|
|
|
|
|
Normal |
Setting Time |
Compressive strength (Mpa) |
Flexural strength (Mpa) |
|
|||||||
Mix |
(min) |
Shrinkage |
||||||||||
Code. |
Consistency |
|
|
|
|
|
90 |
|
|
|
|
Strain |
|
|
7 |
28 |
60 |
7 |
28 |
60 |
90 |
||||
|
(%) |
Initial |
Final |
Day |
Day |
Day |
Day |
Day |
Day |
Day |
Day |
|
|
|
|
|
|
|
|
55.21 |
|
|
|
|
|
C |
32 |
32 |
500 |
26.01 |
48.01 |
52.54 |
2.38 |
4.86 |
5.13 |
5.35 |
460 |
|
|
|
|
|
|
|
|
56.12 |
|
|
|
|
|
CP1F1S |
37 |
45 |
530 |
25.33 |
48.80 |
54.46 |
2.59 |
4.97 |
5.22 |
5.77 |
440 |
|
|
|
|
|
|
|
|
57.11 |
|
|
|
|
|
CP1F2S |
40 |
70 |
590 |
25.02 |
47.82 |
56.87 |
2.64 |
5.01 |
5.54 |
6.12 |
430 |
|
|
|
|
|
|
|
|
55.95 |
|
|
|
|
|
CP1F3S |
44 |
90 |
620 |
24.89 |
45.43 |
55.23 |
2.60 |
5.04 |
6.90 |
7.27 |
425 |
|
|
|
|
|
|
|
|
58.03 |
|
|
|
|
|
CP2F1S |
38 |
45 |
530 |
25.20 |
49.18 |
57.30 |
2.76 |
7.84 |
7.86 |
8.22 |
380 |
|
|
|
|
|
|
|
|
58.45 |
|
|
|
|
|
CP2F2S |
41 |
70 |
590 |
25.43 |
48.21 |
58.22 |
2.75 |
7.91 |
8.17 |
8.54 |
365 |
|
|
|
|
|
|
|
|
57.23 |
|
|
|
|
|
CP2F3S |
43 |
90 |
620 |
24.92 |
46.19 |
56.19 |
2.43 |
7.94 |
8.12 |
9.01 |
350 |
|
|
|
|
|
|
|
|
59.20 |
|
|
|
|
|
CP3F1S |
37 |
45 |
580 |
26.23 |
48.27 |
59.09 |
2.82 |
8.41 |
8.89 |
9.52 |
342 |
|
|
|
|
|
|
|
|
59.45 |
|
|
|
|
|
CP3F2S |
42 |
70 |
590 |
25.49 |
48.91 |
59.22 |
2.86 |
7.92 |
8.83 |
9.81 |
340 |
|
|
|
|
|
|
|
|
57.46 |
|
|
|
|
|
CP3F3S |
43 |
90 |
620 |
24.12 |
47.20 |
57.00 |
2.81 |
7.88 |
8.56 |
9.75 |
339 |
|
|
|
|
|
|
|
|
|
|
|
|
|
|
Workability
The slump cone value for each mix type obtained is given in table 2. It was observed that with the addition of fibers, the entrapped air voids increases and hence the increased air content reduces the workability. Due to reduction in workability, compaction of fresh concrete becomes difficult. As observed from the slump cone values, it can be seen that the workability of fresh concrete decreases with increase in polypropylene fiber volume but this can be overcome by adding Water reducing admixture. There is reduction in workability with increase in fiber content. Up to the fiber content of 0.40 percent there is not much reduction in workability, it was within the permissible requirement but, for 0.60 percent fiber content a suitable dose of 1.5 percent of super plasticizer was added to achieve desired slump value.
121
Russian Journal of Building Construction and Architecture
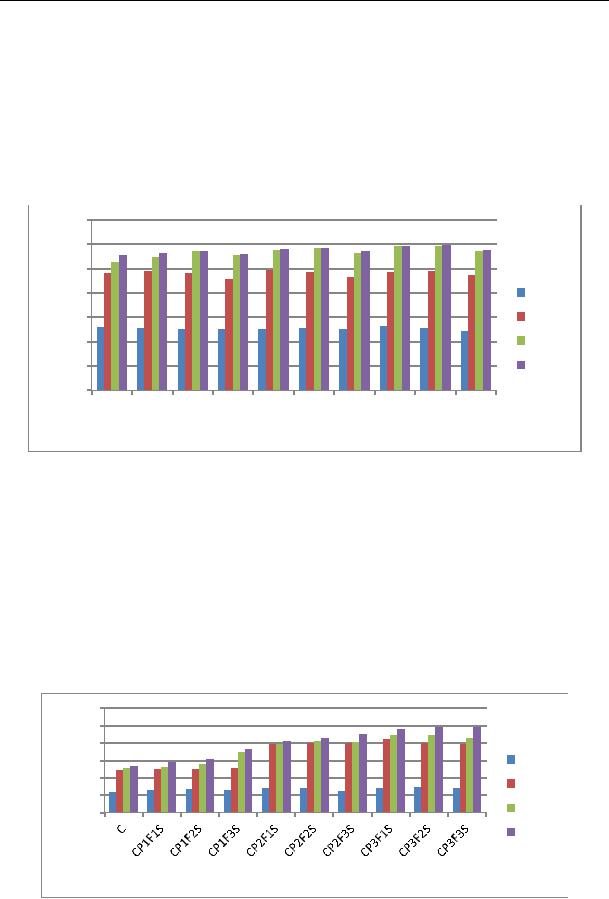
Compressive strength
The compressive strength test results are presented in fig 1. The maximum compressive strength is observed to be 59.53 Mpa for mix 10 (containing 0.60 % PP fibers with 30 % fly ash and 5 % silica fume replacement). For a same fly as replacement level, as fiber volume increases there is an increase in compressive strength. However it can be observed that increase in compressive strength in not significant.
Fig. 1. Compressive strength result
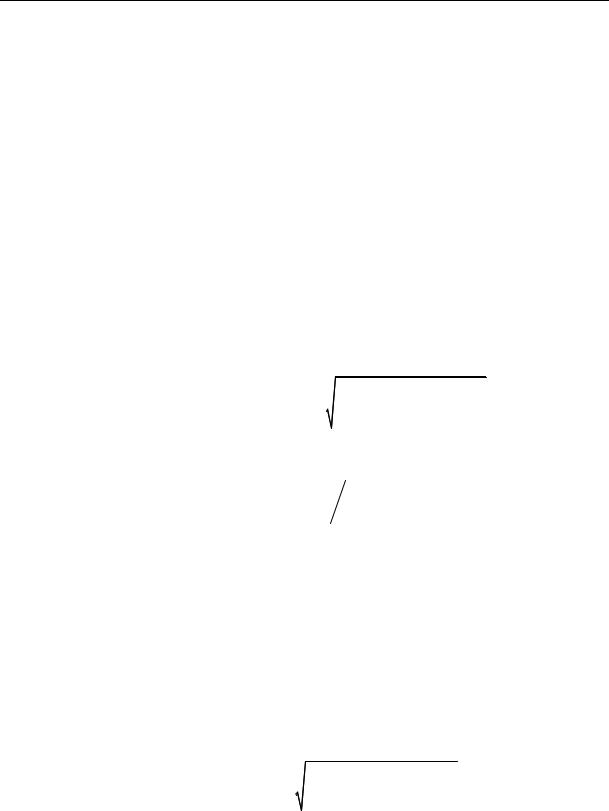
Flexural strength
The flexural strength test results are presented in fig 2. The maximum flexural strength is observed to be 9.81 Mpa for mix 9 (containing 0.60 % PP fibers with 20 % fly ash and 5 % silica fume replacement). The results show that pozolons replacement and PP fiber volume greatly affects flexural strength. As fly ash replacement level increases flexural strength increases. Also direct relation is observed between fiber volume and flexural strength.
Fig. 2. Flexural strength result
122

Issue № 4 (36), 2017 |
ISSN 2542-0526 |
Shrinkage strain
The results obtained from shrinkage test are presented in fig 3. From the results it is observed that the PP fiber with pozzolons is very effective in controlling shrinkage of concrete. The minimum shrinkage observed at mix 10 (Containing 0.60 % PP fiber with 30% fly ash replacement and 5 % silica fume) as 339.
Fig 3. Shrinkage strain resul
Conclusion
PP fiber tends to behave well with pozzolans. There is not much significance of polypropylene fibers’ addition on compressive strength but it improves the behavior under flexural loading. Also it mitigates shrinkage by increasing the tensile strength of concrete and bridging the forming cracks. In this study, it was found that the strength parameters increase with an increase in polypropylene fibers’ volume. For same replacement of fly ash as the fiber volume is increased from 0.20 % to 0.40 % a maximum increase of 16 % in flexural strength is observed. Further increase in fiber volume does not yield a significant increase in flexural strength.
Most of the developed as well as developing countries are having huge resource of waste materials such as fly ash and silica fume. These waste materials if not disposed of properly can cause severe environmental degradation. The results of present study shows that these materials tend to perform well with PQC thereby providing a means for their effective disposal. The results show that the gain in compressive and flexural strength is less at early age of 7 days, but gain in later age strength is more due to pozzolonic reactions which sets in late. The durability in terms of shrinkage strength decreases with the use of pozzolans which is an additional benefit.
123

Russian Journal of Building Construction and Architecture
It can be inferred from the result that, the optimum PP fiber content and replacement level of fly ash varies with the parameter under consideration. The maximum 90 day compressive strength and Flexural strength is obtained as 59.45 Mpa and 9.81 Mpa for mix CP3F2S (0.60 % PP fiber volume, 20 % fly ash and 5% silica fume replacement), whereas minimum 28 day shrinkage strain of 339 is obtained for CP3F3S (0.60 % PP fiber volume, 30 % Fly ash and 5 % Silica fume replacement). Thus in general CP3F2S can be considered as best mix.
The construction of rigid pavement with polypropylene fiber may increases the cost of construction which can be counter balanced by reduction in the maintenance and rehabilitation operation cost. Also, the replacement of cement with pozzolans further helps in cost reduction.
Acknowledgements
The author would like to acknowledge “Ropar Thermal Power plant, Punjab India” for providing us Fly ash. The contribution of materials from Transportation engineering Laboratory, NIT Hamirpur is greatly appreciated.
References
1.Hussam A. Toutanji. Properties of polypropylene fiber reinforced silica fume expansive-cement concrete. Construction and Building materials, Elsevier, 1999, vol. 13, pp. 171––177.
2.Madhkhan M., R. Azizkhani and M. E. Torki Harchegani. Effects of pozzolans together with steel and polypropylene fibers on mechanical properties of RCC pavements. Construction and Building materials, 2011, vol. 26, pp. 102––112.
3.Kolluru V. Subramaniam, Roman Gromotka, Surendra P. Shah, Karthik Obla and Russell Hill. Influence of Ultrafine Fly Ash on the Early Age Response and the Shrinkage Cracking Potential of Concrete. Journal of materials in civil engineering, ASCE, 2005, vol. 17 (1), pp. 45––53.
4.Alaa M. Rashad, Hosam El-Din H. Seleem and Amr F. Shaneen. Effect of Silica Fume and Slag on Compressive strength and Abrasion Resistance of HVFA Concrete. International journal of Concrete Structures and Materials, 2014, vol. 8, pp. 69––81.
5.Shiping Zhang and Binghua Zhao. Influence of polypropylene fibre on the mechanical performance and durability of concrete materials. European Journal of Environmental and Civil Engineering, Taylor and Francis, 2012, vol. 16 (10).
6.Osman Gencel, Cengiz Ozel and Witold Brostow. Mechanical properties of self-compacting concrte reinforced with polypropylene fibres. Material research innovations, Research Gate, 2011, vol. 15.
7.Zhen Mei and D. D. L. Chung. Improving the flexural Modulus and Thermal Stability of Pitch by the Addition of Silica Fume”, Journal of Reinforced plastics and Composites, 2000, vol. 21 (1).
8.IS 3812-2: 2003, Specification for pulverized fly ash for use as an admixture in mortar or concrete.
9.IS 383: 1970, Specifications for coarse and fine aggregates from natural sources for concrete.
10.IS 456: 2000, Plain and Reinforced Concrete - Code of Practice.
124
Issue № 4 (36), 2017 |
ISSN 2542-0526 |
11.IRC 44: 1976, Tentative guidelines for cement concrete mix design for pavements.
12.IS 1489 (1):1991, Specifications for Portland pozzolona cement.
13.IS 15388: 2003, Silica fume specifications.
14.IS 1199: 1959, Methods for sampling and analysis of concrete [CED 2: cement and concrete].
15.IS 516: 1959, Method of tests for strength of concrete.
16.IS 4031 (1): 1996, Methods of physical tests for hydraulic cement.
17.ASTM C 157/ C157 M-04, Guidelines for shrinkage test of cement mortar.
18.IRC 58: 2011, Guidelines for plain jointed rigid pavements for highways.
125

Russian Journal of Building Construction and Architecture
BUILDING MECHANICS
UDC539.4:624.01
Yu. P. Nazarov1, E. V. Poznyak2
THEORY OF A QUASI-STATIC ANALYSIS OF SPORT GRANDSTANDS UNDER LOADS FROM CONCERTED ACTIONS OF SPECTATORS
Central Research Institute of Building Structures Named after V. A. Kucherenko (Federal State Unitary Enterprise Scientific Research Centre «Construction»)
Russia, Moscow, e-mail: nazarov-dom@mail.ru
1D. Sc. in Engineering, Prof., Member of the Russian National Committee on Theoretical and Applied Mechanics, Council of the Russian Academy of Architecture and Building Sciences,
Head Research Fellow
National Research University «Moscow Power Engineering Institute»
Russia, Moscow, e-mail: PozniakYV@mpei.ru
2PhD in Engineering, Assoc. Prof. of the Dept. of Dynamics and Machinery Performance Named after V. I. Bolotin
Statement of the problem. This paper presents deterministic and stochastic methods for a quasistatic structural calculation of the influence of sporting stands on a semi-sinusoid impulse pulse load of audiences moving concertedly.
Results. Deterministic and probabilistic solutions are obtained for specific concerted load, i. e. by walking and jumping up. The study found a connection between the deterministic and probabilistic approaches. Both of the solutions are tested by calculating in a time domain. A method of the assessment of vibrations is described, which is perceived by an audience in accordance to maximum displacements and accelerations.
Conclusions. This study has shown such features of pulse loads as simultaneous excitation of several forms of oscillations and high dynamic factors. In case of high vibrations it is necessary to evaluate a dynamic comfort level. The results of the study can be useful for updating existing guidelines on loads and impacts.
Keywords: quasi-static analysis, impulse load, sporting stands, human effect on a structure, amplification factors, estimation of a dynamic comfort level.
The study was carried out at the Laboratory for Automatization, Research and Design of the Central Scientific Research Institute for Structures Named after V.A. Kucherenko (Ltd. “Scientific Research Centre Construction”) as part of Scientific Research and Experimental Construction Work ordered by the Federal Autonomous Institution “Federal Centre for Standardization and Technical Evaluation in Construction”.
© Nazarov Yu. P., Poznyak Ye. V., 2017
126

Issue № 4 (36), 2017 |
ISSN 2542-0526 |
Introduction
Modern architectural forms of sport and public cultural constructions, which are suspended or console structures, call for calculations for a new type of dynamic impacts –– human-structure interaction loads.
These impacts are due to synchronous movement of people and can be characterized as lowfrequency periodic surface loads. If eigenfrequencies of stands are close to that of impulses generated by spectators, this might lead to an increased vibration level, degradation of operational criteria and sometimes local damage [9—10, 13, 14].
In order to investigate the impact from spectator movement, there has been an extensive series of experiments and theoretical studies performed abroad [13, 14, 16—21] where the approximation of a dynamic load on a stand was obtained as a sequence of half-sinusoidal impulses:
|
|
|
t |
, |
0 t t |
|
, |
|
K |
p |
G sin |
|
p |
|
|||
F t |
|
|
|
|
|
(1) |
||
|
tp |
|
|
|
|
|||
|
|
|
|
|
tp t Tp , |
|
||
0, |
|
|
|
|
|
|||
where Kp = Fmax / G is an impact factor; Fmax is a peak load; G is the weight of a static spectator load on a stand; tp is a contact period; Tp is an impulse period. The ratio of a contact period tp to a load time Tp is a contact ratio α = tp / Tp, the impulse frequency is fp =1 / Tp. It was experimentally shown that the impulse frequency may vary from 1 to 4 Hz [13, 14, 21].
The approximation (1) is the foundation for guidelines of the UK, Canada, Germany and is illustrated in the Eurocode EN 1991-1-1 [12, 15, 4]. In the guideline BS 6399-1:1996 there is a correspondence of different types of contact ratios and those of spectator actions [5]: the value α = 2/3 corresponds to pedestrian movement and low-rhythmic aerobics, the value α = ½ to rhythmic movement and high-rhythmic the value α = 1/3 to regular jumps and the value α = ¼ to high jumps. The decomposition of the function F(t) into a Fourier series [4] is known:
|
|
|
|
|
2 n |
|
2 n |
|
|
|
2 n |
|
||||||||||
F t G 1 an |
cos |
T |
|
t bn sin |
|
T |
|
t G 1 rn |
sin |
|
t n , (2) |
|||||||||||
|
n 1 |
|
|
|
p |
n 1 |
|
p |
|
|
n 1 |
|
T |
p |
|
|
||||||
|
|
|
|
|
|
|
|
|
|
|
|
|
|
|
|
|||||||
|
|
|
|
|
|
|
|
|
|
|
|
|
|
|
|
|
|
|
|
|
||
where an , bn are the Fourier coefficients at 2n 1, |
an 0, bn 2, in other cases |
|
||||||||||||||||||||
|
an 0.5 |
cos 2n 1 1 |
|
cos 2n 1 1 |
, |
|
|
|
||||||||||||||
|
|
|
|
|
|
|
|
|
|
|
|
|
|
|
|
|
|
|||||
|
|
|
|
2n 1 |
|
|
|
2n 1 |
|
|
|
|
|
|||||||||
|
|
|
|
|
|
|
|
|
|
|
|
|
|
|
|
|||||||
|
bn 0.5 |
sin 2n 1 1 |
|
|
sin 2n 1 1 |
, |
|
|
|
|||||||||||||
|
|
|
|
|
|
|
|
|
|
|
|
|
|
|
|
|
||||||
|
|
|
2n 1 |
|
|
|
|
2n 1 |
|
|
|
|
||||||||||
|
|
|
|
|
|
|
|
|
|
|
|
|
|
|
|
|||||||
rn an2 bn2 , n arctg an  bn .
bn .
127

Russian Journal of Building Construction and Architecture
The analysis of the series (2) shows that the impulse load (1) is successfully modeled by the first six harmonics. In Fig. 1 there are graphs of the function F, kN/m2, of the time, sec, obtained by summing the first six harmonics in (2) for α = 2/3 (pedestrian movement) and α = 1/4 (high jumps) with the frequency 2 Hz, a static crowd load is the maximum actual weight 2.80 kN/m2.
A dynamic response of a structure to an impact (1) can be determined in a few ways. The main one is the quasi-statiс method as it is most convenient and known to engineering designers for its common use in seismic resistance. The quasi-static method is convenient as exterior impulse force is applied to a structure as a static load, internal effort does not depend on time, which makes construction calculations easier to perform. Dynamic effects in the quasi-static method are considered using dynamic factors. The quasi-static method can be regarded from the point of view of determined or probabilistic loading [19—21, 12]. In the first case all the parameters of a calculation model and loading are considered strictly prescribed and dynamic factors are determined using the methods of the oscillation theory. In the second case loading is considered as an implementation of a random process and dynamic factors depend on its spectral density. A test calculation will be direct integration of movement equations in a temporary range with the resulting dependencies of the parameters of stress-strain on time. Below are three approaches to solving a dynamic task (a quasi-static determined, quasi-static probabilistic and test in a temporary area) and they are compared. Besides determining a dynamic response, a comfort level is evaluated. Based on the frequencies and amplitudes of vibrodisplacements and vibro-accelerations, 6 gradations of spectators’ perception ranging from “vibrations are not felt” to “vibrations are not pleasant during a short-term impact”.
а) |
b) |
|
|
|
t, sec |
t, sec |
Fig. 1
128
Issue № 4 (36), 2017 |
ISSN 2542-0526 |
1. Movement equations in the main coordinates
The movement equation of a dissipative system with N degrees of freedom takes the following form
Mq+Bq+Cq= P, |
(3) |
where q is a N-dimensional vector of generalized movements; M, B, C are matrices of inertia, damping and solidness of the dimension N×N; P is a N-dimensional vector of generalized external impulse forces. The vector P consists of periodic forces Pi that can be arranged into a Fourier series using the formula (2):
|
|
|
G |
|
NF |
|
2 n |
|
|
|
|
|||||
|
Pi t Pi |
|
1 rn sin |
|
|
|
n |
n , |
|
(4) |
||||||
|
|
|
T |
|
|
|||||||||||
|
|
|
|
|
|
n 1 |
|
|
p |
|
|
|
|
|
||
|
|
|
|
|
|
|
|
|
|
|
|
|
||||
|
|
|
|
|
|
|
|
|
|
|
|
|
|
|||
wherePG |
is a static crowd load along the i-the generalized coordinate; N |
F |
is a number of re- |
|||||||||||||
i |
|
|
|
|
|
|
|
|
|
|
|
|
|
|
|
|
tained members of the Fourier series. As a vector |
|
2 n |
|
|
|
|
|
|
|
|||||||
|
P P |
G |
P |
G |
NF |
|
|
|
|
|
|
|
|
|
||
|
|
|
|
r sin |
|
|
n |
. |
|
|
|
|||||
|
|
|
|
|
|
|
|
|
||||||||
|
|
|
|
|
n |
|
Tp |
|
|
|
n |
|
|
|
||
|
|
|
|
|
n 1 |
|
|
|
|
|
|
|
|
|
||
Let us denote: V is a matrix of eigenvectors of the system (3) of the N×N dimension;
Ω2 diag 2k is a diagonal quadratic matrix of eigenfrequencies; 2k is the square of the k-th eigenfrequency; Mmod is a diagonal modal matrix of the masses:
Mmod VT MV diag Mmod,k ;
Mmod,k is a modal mass along the k-th eigenform; 2ε Mmod1 VT BV is a modal damping matrix. Damping is assumed to be small thus the damping matrix can be considered diagonal ε diag k , k is a modal damping coefficient along the k-th eigenform. Using the transformation q Vuwe obtain a system of independent movement equations in the space of the main coordinates:
u 2εu 2u Q, |
(5) |
where u is a vector of the main coordinates; Q is a vector of external impulse forces reduced to the main coordinates:
Q Mmod1 VT P. In the component-wise form the equation (5) is as follows
u |
2 |
u |
k |
2u |
k |
Q |
, |
(6) |
k |
k |
|
k |
k |
|
|
129
Russian Journal of Building Construction and Architecture
where |
Q |
1 |
vT P; |
|
|||
|
k |
|
k |
|
|
M mod,k |
|
vTk is a vector of the k-th eigenform. The solution in the initial base for the j-th generalized coordinate is
q j vTj u.
2. Quasi-static determined solution
The solution of the equation (5) in an established mode of forced vibrations can be obtained by means of the superposition method considering the decomposition (4) and summing a dynamic response along each harmonic component of a load (the detailed development is provided in [5]):
|
|
|
|
|
|
|
|
|
|
|
|
|
|
|
|
|
|
|
|
|
1 |
|
T |
|
|
|
rn sin n t n |
|
|
|
|
||||||||
|
|
G |
NF |
|
|
|
|
||||||||||||
uk |
|
|
vk |
P 1 |
|
|
|
|
|
|
|
|
|
|
|
|
, |
(7) |
|
2 |
|
|
|
|
|
|
|
|
|
|
|
|
|
||||||
|
k Mmod,k |
|
|
|
n 1 |
|
|
2 |
|
2 |
|
2 |
|
2 k n |
2 |
|
|
||
|
|
|
|
|
|
|
1 n |
|
|
|
|
|
|||||||
|
|
|
|
|
|
|
|
|
|
2 |
|
|
|
|
2 |
|
|
|
|
|
|
|
|
|
|
|
|
k |
|
|
|
|
k |
|
|
|
|
||
where n is a response phase to the n-th harmonic component of a load: |
|
|
|
|
|||||||||||||||
|
n n |
|
|
|
2 n |
|
|
n2 2 |
; |
|
|
|
|
|
|||||
|
arctg |
k 2 |
1 |
|
|
|
2 |
|
|
|
|
|
|
||||||
|
|
|
|
|
k |
|
|
|
k |
|
|
|
|
|
|
|
|||
is an angular frequency of an impulse load:
2 2 f p .
Tp
The summand (7) that is independent of time corresponds to the static movement ust. A maximum dynamic movement along the k-th generalized coordinate u will be found by assuming the sinuses (7) to equal one. Then the modal dynamic factor corresponding to the k-th form of oscillations is
k |
umax,k |
NF |
|
|
|
|
r |
|
|
|
. |
|
1 |
|
|
|
|
|
|
|
|||||
|
|
|
|
|
|
|
n |
|
|
|
|
|
|
ust |
n 1 |
|
1 |
|
n2 2 2 |
|
2 |
n 2 |
|||
|
|
|
|
2 |
|
|
|
k 2 |
|
|||
|
|
|
|
|
|
k |
|
|
k |
|
||
This formula can be written using a modal damping coefficient k ( k k k ) and the frequency expressed in Hz ( fp  2 , fk k
  2 ):
2 ):
130