

Биоинженерия / Биомеханика_микрофлюидные_устройства / статьи / 20_BIOMGB-000005-032006_1
.pdfBIOMICROFLUIDICS 5, 032006 (2011)
Microfluidic endothelial cell culture model to replicate disturbed flow conditions seen in atherosclerosis susceptible regions
Rosendo Estrada,1 Guruprasad A. Giridharan,1 Mai-Dung Nguyen,1 Sumanth D. Prabhu,2 and Palaniappan Sethu1,a)
1Department of Bioengineering, Speed School of Engineering, University of Louisville, Louisville, Kentucky 40208, USA
2Institute of Molecular Cardiology, Department of Medicine, University of Louisville, and Louisville VAMC, Louisville, Kentucky 40202, USA
(Received 30 March 2011; accepted 24 May 2011; published online 20 September 2011)
Atherosclerotic lesions occur non-randomly at vascular niches in bends and bifurcations where fluid flow can be characterized as “disturbed” (low shear stress with both forward and retrograde flow). Endothelial cells (ECs) at these locations experience significantly lower average shear stress without change in the levels of pressure or strain, which affects the local balance in mechanical stresses. Common in vitro models of atherosclerosis focus primarily on shear stress without accounting for pressure and strain loading. To overcome this limitation, we used our microfluidic endothelial cell culture model (ECCM) to achieve accurate replication of pressure, strain, and shear stress waveforms associated with both normal flow seen in straight sections of arteries and disturbed flow seen in the abdominal aorta in the infrarenal segment at the wall distal to the inferior mesenteric artery (IMA), which is associated with high incidence of atherosclerotic lesion formation. Human aortic endothelial cells (HAECs) were cultured within the ECCM under both normal and disturbed flow and evaluated for cell shape, cytoskeletal alignment, endothelial barrier function, and inflammation using immunofluorescence microscopy and flow cytometry. Results clearly demonstrate quantifiable differences between cells cultured under disturbed flow conditions, which are cuboidal with short and randomly oriented actin microfilaments and show intermittent expression of b-Catenin and cells cultured under normal flow. However, in the absence of pro-inflammatory stimulation, the levels of expression of activation markers: intra cellular adhesion molecule-1 (ICAM-1), vascular cell adhesion molecule-1 (VCAM-1), platelet endothelial cell adhesion molecule-1 (PECAM-1), and vascular endothelial cell growth factor – receptor 2 (VEGF-R2) known to be involved in the initiation of plaque formation were only slightly higher in HAECs cultured under disturbed flow in comparison to cells cultured under normal flow. VC 2011 American Institute of Physics. [doi:10.1063/1.3608137]
INTRODUCTION
Atherosclerosis or arteriosclerotic vascular disease is a pathological condition that results in increasing arterial wall thickness and stiffness due to buildup of plaque consisting of monocyte derived macrophages, modified lipoproteins, and lipids such as cholesterol. In recent years, atherosclerosis has been recognized as a chronic inflammatory disease as opposed to a simple phenomenon of lipid deposition.1 This inflammatory process involves a complex interplay between lipoproteins, lipids, activated blood leukocytes, and inflamed endothelium (endothelial cells
a)Author to whom correspondence should be addressed. Electronic mail: p.sethu@louisville.edu. Tel.: (502) 852 0351. Fax: (502) 852 1577.
1932-1058/2011/5(3)/032006/11/$30.00 |
5, 032006-1 |
V 2011 American Institute of Physics |
|
|
C |
032006-2 Estrada et al. Biomicrofluidics 5, 032006 (2011)
(ECs) and smooth muscle cells (SMCs)), which dictates initiation and progression of wall thickening. Plaques can also suddenly rupture, leading to thrombus formation and vessel occlusion increasing the risk of myocardial infarction and stroke, which together are responsible for50% of mortalities in developed nations.2
Atherosclerotic lesions preferentially occur at vascular niches proximal to vessel branches and bends including several locations in the aortic arch, ascending and descending aorta and coronary and carotid arteries.3 At these locations, the local flow behavior is characterized as “disturbed” and is associated with low shear stress recirculation, oscillation, or lateral flow (average: <4 dynes=cm2) in comparison, straight regions of arteries with “normal” high shear stress laminar pulsatile flow (mean: 10–15 dynes=cm2, peak: <100 dynes=cm2). Several in vitro and in vivo studies evaluating the effect on shear stress associated with disturbed flow have shown generation of ECs with polygonal morphology,4,5 random alignment of actin filaments,4,5 high EC turnover,4,5 slow EC migration,4,5 increased permeability,4,5 increased gene expression,4,5 and expression of pro-inflammatory markers such as platelet derived growth factor (PDGF),6 monocyte chemotactic protein-1 (MCP-1),6 platelet endothelial cell adhesion molecule (PECAM)-1,7 vascular cell adhesion molecule (VCAM)-1,7,8 intra cellular adhesion molecule (ICAM)-1,7,8 and growth factors such as vascular endothelial cell growth factor – receptor 2 (VEGF-R2).9
In addition to shear stress, ECs in vivo are also exposed to pulsatile pressure (normal: 120=80 mm Hg) and cyclic stretch (normal: 6–20%) at around 80 bpm. However, evaluation of the effects of mechanical stretch in vitro has focused mostly on SMCs whereas ECs have received a lot less attention. Several recent studies have evaluated the response of ECs to both physiological and pathological levels of cyclic stretch.10–12 Evaluation of cyclic stretch on ECs accomplished using flexible substrates reveals alignment of ECs perpendicular to the direction of stretch13 (in the direction of flow in blood vessels) and stimulation of stretch-activated ion channels for Ca2þ ion transport.14 In vitro studies demonstrate that short term stretch results in modulation of vessel tone through synthesis of superoxide15 known to play a role in vasoconstriction whereas prolonged exposure to stretch resulted in increased generation of vasoactive mediators NO and ET-1,16 expression of angiotensin receptor II (ANG II-R),17 and pro-inflam- matory markers such as IL-8,10 MCP-1,10 ICAM-1,18 and VCAM-1.18 Physiological levels of cyclic stretch have also been shown to significantly improve endothelial barrier function whereas increased levels of stretch seen in conditions such as hypertension decreases barrier function.19 Relatively fewer in vitro studies have focused on the direct effects of pressure on EC structure and function.20 This can be attributed to the assumption that pulsatile pressure from blood flow causes the blood vessel to stretch, and therefore, the overall effect of pressure manifests itself primarily in the form of stretch. However, evaluation of pressure on ECs in vitro shows that pressure alone in the absence of stretch results in increased EC proliferation, cytoskeletal reorganization, and synthesis of ECM proteins.21–23
Conventional platforms such as parallel plate systems24 and cone in plate viscometers25 create disturbed flow conditions in the absence of pressure and stretch. Cyclic stretch is an important determinant in regulation of cytoskeletal alignment, endothelial barrier function, modulation of vessel tone, and inflammation and may play an important role particularly in areas of low shear stress.26 The effects of in vitro stimulation with stretch and shear stress have shown to have common and opposing effects on EC phenotype and function. Both shear stress and cyclic stretch cause increase in eNOS, intracellular Ca2þ, inositol triphosphate, and triacylglycerol.19 Shear stress and cyclic stretch also differentially regulate ET-1, ICAM-1, plasminogen activation inhibitor, MCP-1, and oxidative stress response.19 In general, increasing shear stress in the absence of additional stimulation results in an anti-inflammatory phenotype whereas stimulation with increasing cyclic strain alone results in a pro-inflammatory phenotype. However, the response of ECs to individual stimuli is very different from the simultaneous and coordinated stimulation sustained in vivo.27
Considering the complex interplay between different mechanical stresses, in vitro stimulation with shear stress alone may not fully replicate the in vivo signaling environment in its entirety. Therefore, concomitant simulation with pulsatile pressure and strain may be critical to generate a more physiologically relevant in vitro model of atherosclerosis. To address this issue,
032006-3 |
Cell culture model of atherosclerosis |
Biomicrofluidics 5, 032006 (2011) |
we used our newly developed endothelial cell culture model (ECCM)28 that can achieve realistic representation of pressure, stretch, and shear stress waveforms seen in vivo to recreate disturbed flow conditions seen in atherosclerosis susceptible while at the same time maintaining normal levels of pressure and stretch. Using this system, we cultured human aortic endothelial cells (HAECs) under normal and disturbed flow conditions and evaluated cell shape, cytoskeletal alignment, endothelial barrier function, and inflammation.
MATERIALS AND METHODS
Endothelial cell culture model (ECCM)
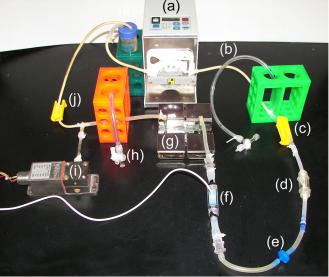
The ECCM (Fig. 1) consists of a peristaltic pump to induce and manipulate flow, a cell culture chamber with a compliant thin membrane that mimics a vessel wall, a pneumatically driven pulsatile chamber, a one-way valve, 2 tunable flow resistance elements to adjust preload and afterload, and 2 tunable compliance elements that represent arterial and venous compliance. The peristaltic pump flow rate determines the average levels of shear stress within the system. The cell culture chamber is a rectangular channel 0.75 mm 5 mm 70 mm and consists of rigid walls on three sides and 500 lm thick flexible membrane on which cells are cultured. The membrane forms a concave shape inside the channel under pressure and represents a segment of the blood vessel wall. Culture of cells on a thin (500 lm) membrane allows generation of physiological levels of stretch (5–25% constant strain and 5–10% cyclic strain) in response to applied pressure within the chamber. The primary component that introduces pulsatility or contractile function within the system is a pneumatically actuated collapsible chamber. The applied pressure, percentage systolic=diastolic fraction, and frequency (bpm) can be manipulated to alter frequency and amplitude of pressure and flow waveforms. In addition to this chamber, tunable compliance and flow resistance elements upstream of the inlet (pulmonary) and downstream of the outlet of the cell culture channel (aortic=systemic) allow modulation of flow resistance and modification of shape and amplitude of attained pressure and flow profiles. A one-way valve placed between the pulsatile chamber and the cell culture chamber ensures prevention of retrograde flows within the cell culture chamber.
Generation of disturbed flow
A similar setup to that mentioned above was used to generate disturbed flow patterns typically seen in atherosclerosis susceptible regions in the abdominal aorta in the infrarenal segment
FIG. 1. Image showing the actual ECCM flow loop setup: (a) peristaltic pump, (b) pulmonary compliance, (c) pulmonary resistance, (d) collapsible chamber, (e) one-way valve (removed to generate disturbed flow), (f) inline flow sensor, (g) cell culture chamber, (h) aortic=systemic compliance, (i) inline pressure sensor, (j) aortic=systemic resistance, and (k) medium reservoir.

032006-4 |
Estrada et al. |
Biomicrofluidics 5, 032006 (2011) |
at the wall distal to the inferior mesenteric artery (IMA). The original set up for generation of normal flow contains a one-way valve prior to entry into the cell culture chamber. To generate disturbed flow, the one way valve was removed to ensure retrograde flow within the system. The flow rate of the pump was also decreased to reduce flow velocity and wall shear stress to match clinical values reported in literature.
Pressure, stretch, and shear stress measurement
Pressure and flow measurements were accomplished using inline pressure and flow sensors (Validine, San Fransisco, CA, and Transonics, Boston, MA) as previously reported.28 Strain measurements were accomplished using laser induced fluorescence to track the membrane deflection under applied pressure using an imaging setup also described previously.28 Shear stress measurements utilized the flow data in conjunction with change in channel cross-section following application of pressure. The Womersely Number (a), which accounts for flow changes due to pulsatility, was calculated and factored into the shear stress calculation using the following equation, where Q is the volume flow rate, l is the flow viscosity and “h” and “w” are the height and width of the cell culture chamber, respectively.
a 6Ql |
|
s ¼ p2 h2w |
(1) |
The shear stress waveform can be analyzed to determine two dimensionless numbers that can discriminate disturbed flow from normal flow.29 The first number is the oscillatory shear index (OSI), which can be defined as the area of the shear stress curve in the negative region (Aneg) divided by the total area (Apos þ Aneg) of shear stress curve. The second number is the negative index (NEG), which can be determined by dividing the total time duration that the shear waveform has a negative value during a beat (Tneg) divided by the total time duration of 1 beat (T)
Aneg
OSI ¼ ; (2)
Apos þ Aneg
NEG ¼ |
Tneg |
: |
(3) |
T |
Human aortic endothelial cell culture (HAECs)
HAECs (Invitrogen, Carlsbad, CA) were initially cultured in standard tissue culture flasks using Medium 200 (Invitrogen, Carlsbad, CA) supplemented with low serum growth supplement (LSGS; Invitrogen, Carlsbad, CA) and 1% penicillin-streptomycin. Prior to seeding within the cell culture chamber in the ECCM, the surface of the cell culture chamber was treated with 50 mg=ml of fibronectin for 12 h at 4 C and for 30 min at 37 C to promote cell adhesion. Following washing with cell culture medium, HAECs cells were seeded at a density of 5 105 cells=ml. A polymeric stencil was used to restrict cells to the middle 4 cm region (where the strain is uniform and unidirectional). Cells were allowed to attach and spread, and after 4 h, the medium was replaced with fresh medium and maintained in culture until they reached confluence. Once they reach confluence, they were assembled with the flow loop and gradually the fluid flow rate and pressures were increased until the values for the desired conditions were obtained. Further, the compliances, resistances, and pulsatility were modulated to modify the shape of the flow waveforms to simulate normal or disturbed flow conditions. Cells were maintained under culture for 24 h prior to analysis using different techniques.
Alignment and cell shape analysis using microscopy
Cell alignment was determined following visual examination of phase contrast microscopy images. Cell shape estimation was accomplished using live cell images acquired using a digital
032006-5 |
Cell culture model of atherosclerosis |
Biomicrofluidics 5, 032006 (2011) |
camera attached to the microscope. Three images (>30 cells=image) were taken for each device at randomly selected locations, and the shape of cells was determined using the METAMORPH software (tracing boundaries of single cells) and classified as either ellipsoidal or polygonal. The ratio of ellipsoidal to polygonal cells was averaged for each condition. To determine alignment, the angle of orientation of cells with respect to the direction of fluid flow was determined and cells within 620 of the direction of fluid flow were considered aligned. For examining differences between the shape and alignment of cells in the two conditions, unpaired Student’s t- tests were performed with two-tailed significance set at p 0.05 (n ¼ 3).
Microfilament arrangement and adherns junction formation using immunofluorescence microscopy
HAECs were fixed with 4% paraformaldehyde in 1 PBS for 20 min, washed two times with wash buffer (1 PBS containing 0.05% Tween-20 (Fisher Scientific, Fair Lawn, NJ)) and permeabilized with 0.5% Triton X-100 (Fisher Scientific, Fair Lawn, NJ) for 2 min at room temperature. Then, cells were washed two times with wash buffer, blocked with 1% BSA in 1 PBS freshly prepared for 30 min, and incubated with primary antibody anti-human mouse b-Catenin (1:50; Santa Cruz Biotechnology, Santa Cruz, CA) at room temperature for 1 h. Cells were washed three times with wash buffer for 5 min each time and incubated at room temperature with the second antibody, fluorescein isothiocyanate (FITC)-conjugated goat anti-mouse (1:100; Millipore, Billerica, MA). After 1 h, cells were washed three times with wash buffer. For negative controls, the same procedure was performed without adding the primary antibody. For the detection of F-actin, cells were washed two times with wash buffer, blocked with 1% BSA in 1 PBS for 30 min, and incubated at room temperature for 1 h with TRITC-conjugated phalloidin (1:100; Millipore, Billerica, MA). Light Diagnostics mounting fluid (Millipore, Billerica, MA) was added to the cells, and cells were examined using a Nikon Eclipse A1 Confocal Microscopy System (Nikon Instruments, Melville, NY).
Evaluation of inflammatory markers using flow cytometry
The surface area of the ECCM allows culture of >15 000 HAECs. By obtaining primary antibodies conjugated to four different fluorophores (FITC, PE, PerCP, and APC), simultaneous evaluation of four different markers can be accomplished. HAECs cultured within the ECCM under normal and disturbed flow conditions for 24 h were trypsinized and resuspended in 250 lL of flow cytometry buffer (1 PBS containing 2% paraformaldehyde and 1% bovine serum albumin). 10 lL of each antibody (anti-human PECAM-1-FITC, VEGF-R2-PE, VCAM-1- PerCP, and ICAM-1-APC) were added to the cell sample and incubated at room temperature in the dark for 45 min. Samples were washed with an additional 250 lL of flow cytometry buffer, centrifuged at 350g for 5 min, and finally resuspended in 200 lL of flow cytometry buffer processed. Results were normalized to isotype controls and analyzed using flow cytometry data analysis software (WINMDI and BD CELL QUEST PRO). Paired Student’s t-tests with two-tailed significance set at p 0.05 was used to quantify differences in expression of inflammatory markers (n ¼ 3).
RESULTS
Generation of pressure, flow, strain, and shear stress waveforms
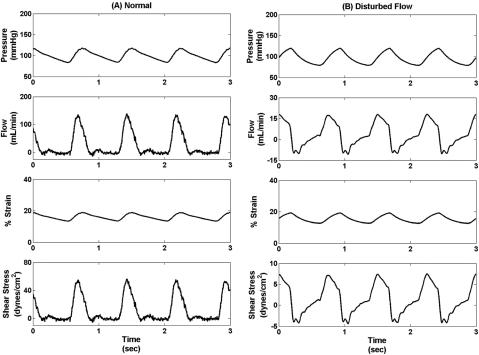
The ECCM was used to generate pressure, flow, strain, and shear stress waveforms associated with normal (pressure 118=83 mm Hg systolic=diastolic, 13% constant strain, 6% cyclic strain, average flow of 28 ml=min, and average shear stress of 11 dynes=cm2) and disturbed flow (pressure 118=83 mm Hg systolic=diastolic, 13% constant strain, 6% cyclic strain, average flow of 3 ml=min, and average shear stress of 1.3 dyne=cm2) conditions (Fig. 2). A setup similar to previously described was used to generate normal flow conditions whereas the setup was slightly modified by removal of the one-way valve and reduction of flow rate to generate reciprocating disturbed flow conditions.
032006-6 |
Estrada et al. |
Biomicrofluidics 5, 032006 (2011) |
FIG. 2. Pressure, flow, strain and shear stress waveforms generated using the ECCM to culture ECs under (A) normal flow (pressure 118=83 mm Hg systolic=diastolic, 13% constant strain, 6% cyclic strain, average flow of 28 ml=min, and average shear stress of 11 dynes=cm2) and (B) disturbed flow conditions (pressure 118=83 mm Hg systolic=diastolic, 13% constant strain, 6% cyclic strain, average flow of 3 ml=min, and average shear stress of 1.3 dyne=cm2). These waveforms closely match the clinical waveforms reported in literature.
Replication of shear waveform in the infrarenal segment of the abdominal aorta proximal to the inferior mesenteric artery
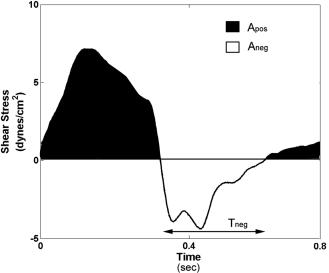
Once disturbed flow was enabled within the ECCM, the pulmonary compliance and resistance as well as the aortic compliance and resistances were modulated to replicate the flow and shear stress profiles seen in the infrarenal segment proximal to the inferior mesenteric artery, an atherosclerosis susceptible region in the abdominal aorta. For the waveforms generated, the mean shear stress was 1.37 dynes=cm2, the maximum shear stress was 7.5 dynes=cm2 and the minimum shear stress was 4.4 dynes=cm2, which are similar to in vivo measured values.29 The measured OSI and NEG values are 0.27 and 0.38, respectively, and again these values closely match in vivo values to within 65% error.29 Figure 3 shows the shear waveform over 1 beat and the calculated OSI and NEG values. This condition was used for all disturbed flow experiments.
Evaluation of cell shape and alignment
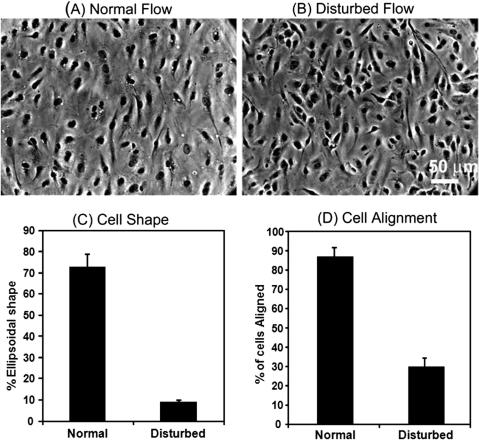
Phase contrast microscopy was used to characterize HAEC shape and alignment. Image analysis of cells cultured under both normal and disturbed flow conditions was used to determine percentage of cells per frame exhibiting ellipsoidal shape and percentage of cells per captured frame that were aligned (<20 from the direction of flow). Microscope images and image processed data clearly indicates that cells attain an ellipsoidal shape and show good alignment in the direction of flow with normal high shear stress laminar flow, whereas cells cultured under disturbed flow exhibit rounded or cuboidal shape and random orientation (Fig. 4). The percentage of ellipsoidal and aligned cells in the normal flow condition was statistically significant in comparison (p ¼0.05) for a sample size of n ¼ 3.
032006-7 |
Cell culture model of atherosclerosis |
Biomicrofluidics 5, 032006 (2011) |
FIG. 3. Shear stress waveform over one beat attained for the disturbed flow condition. The maximum shear stress is 7.5 dynes=cm2, minimum shear stress is 4.4 dynes=cm2, and the average shear stress is 1.3 dynes=cm2. Analysis of the areas in the positive and negative shear stress axes indicates attainment of an OSI value of 0.27 and NEG value of 0.38 matching clinical values reported in literature for the inferior mesenteric artery. (Note: Different scale on the y-axis was used for flow and shear stress waveforms for each condition).
Intracellular microfilament architecture
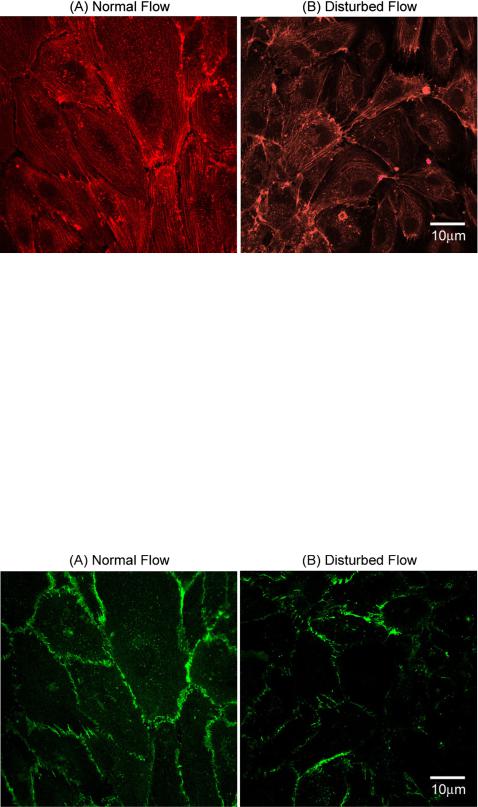
HAECs cultured under both normal and disturbed flow conditions were evaluated using immunofluorescence microscopy to analyze cytoskeletal architecture. Staining F-actin filaments using phalloidin clearly shows long and continuous F-actin aligned in the direction of flow following 24 h of culture under normal flow whereas with disturbed flow results in short, randomly oriented F-actin (Fig. 5).
Evaluation of endothelial layer permeability
Establishment of Adherns Junctions was evaluated by immunofluorescence microscopy of the cytoplasmic domain (b-Catenin) of the VE-Cadherin cell-cell adhesion receptor. HAECs under normal flow show continuous and high levels of expression of b-Catenin whereas HAECs under disturbed flow show low and discontinuous levels of expression of b-Catenin indicating compromised endothelial monolayer permeability (Fig. 6).
Evaluation of inflammatory markers
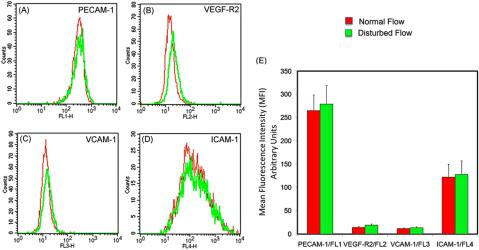
HAECs cultured under conditions of normal and disturbed flow were evaluated for expression of three markers indicative of activation and know to play a role in the formation of atherosclerotic lesions via mediation of adhesion of monocytes and other immune cells (PECAM-1, ICAM-1, and VCAM-1), as well as VEGEF R2, which is known to play a role in endothelial cell regeneration following injury. For a sample size of n ¼3, flow cytometric analysis shows slight but statistically insignificant (p ¼0.05) increase in expression levels of VEGEF-R2 and VCAM-1 in the disturbed flow condition in comparison to normal flow whereas there was virtually no difference in the levels of expression of both ICAM-1 and PECAM in both conditions (Fig. 7).
DISCUSSION
The ECCM was developed a physiologically relevant in vitro model of arterial vessels where pressure, flow, strain, and shear stress waveforms associated with both physiologic and
032006-8 |
Estrada et al. |
Biomicrofluidics 5, 032006 (2011) |
FIG. 4. Phase contrast images of cells cultured under conditions of (A) normal and (B) disturbed flow. Graphs quantifying % of cells cultured under both conditions that assume (C) ellipsoidal shape and (D) alignment in the direction of flow following culture for 24 h within the ECCM. Differences in shape and alignment are statistically significant (p < 0.05).
pathophysiologic conditions in the body can be accurately replicated. This system has been used to generate realistic mechanical stresses associated with conditions like heart failure, hyper=hypo-tension and brady=tachy-cardia where there is no sustained retrograde flow. This manuscript describes a new application of this technology for culture of ECs under conditions of disturbed flow seen in atherosclerosis susceptible regions resulting in generation of low and oscillatory shear stress while maintaining pressure and strain waveforms at normal levels as seen in vivo. Results clearly show that the flow and shear waveforms generated, accurately mimic conditions seen in the infrarenal segment of the abdominal aorta at the wall distal to the inferior mesenteric artery where the average shear stress value is 1.3 dynes=cm2, the OSI value is 0.26, and the NEG index is 0.38. This model therefore represents the first demonstration of an in vitro model of atherosclerosis with realistic concomitant stimulation with shear stress, pressure, and strain.
To demonstrate proof of concept of the ability to accurately replicate normal and disturbed flow conditions within the ECCM we cultured HAECs within this system and evaluated morphological, structural, and functional differences between cells cultured under both conditions. Evaluation of cell shape and alignment using image analysis of phase contrast imaging clearly demonstrates that >70% of cells cultured under normal conditions assume an ellipsoidal shape and >85% of cells align in the direction of fluid flow (within 20 ). However, analysis of cells cultured under disturbed flow conditions shows that <10% of cells assume an ellipsoidal shape and <30 % of cells align in the direction of the flow.
Actin microfilaments (F-actin) in the cytoskeleton of cells play important roles in the establishment and maintenance of structural stability and are involved in variety of signaling
032006-9 |
Cell culture model of atherosclerosis |
Biomicrofluidics 5, 032006 (2011) |
FIG. 5. Immunofluorescence microscopy images of HAEC to visualize actin microfilaments following 24 h of culture under (A) normal and (B) disturbed flow conditions. It can be clearly seen from the images that HAECs cultured under normal flow exhibit thick, aligned, and evenly distributed F-actin in comparison to HAECs cultured under disturbed flow conditions that show short and randomly oriented F-actin localized closer to the cell periphery.
processes such as motility, contraction, and intra-cellular transport of signaling molecules. ECs in straight sections of blood vessels exhibit long and aligned F-actin evenly distributed across the entire cell whereas in bends and bifurcations (regions exposed to disturbed flow) the filaments are short with random distribution and are found closer to the cell periphery. Analysis of F-actin within cells cultured under normal conditions using immunofluorescence confocal microscopy shows long and parallel stress fibers distributed evenly across the cells whereas cells cultured under disturbed flow exhibit short and randomly oriented stress fibers with a majority closer to the cell periphery confirming both in vivo and in vitro observations, confirming generation of disturbed flow within the ECCM.
Endothelial cell-cell junctions (adherens junctions) help establish integrity of the endothelial barrier controlling the movement of solutes between blood and tissues, and the migration of
FIG. 6. Immunofluorescence microscopy images of HAECs to visualize establishment of adherens junctions to quantify endothelial barrier function. Images show higher and continuous levels of expression of b-Catenin in HAECs cultured under normal flow (A) versus low and intermittent expression in HAECs cultured under disturbed flow (B).
032006-10 |
Estrada et al. |
Biomicrofluidics 5, 032006 (2011) |
FIG. 7. Flow cytometric analysis of expression of HAEC activation and growth factors (A) PECAM-1, (B) VEGF-R2, (C) VCAM-1, and (D) ICAM-1 on HAECs cultured under normal and disturbed flow conditions. Plots show small but statistically insignificant increase in expression of these markers in HAECs cultured under disturbed flow in comparison to HAECs cultured under normal flow. (E) Graph summarizing flow cytomety data.
white blood cells (WBCs) between blood and tissues, especially at sites of infection and inflammation. In ECs subject to normal flow, cell-cell junctions are usually depicted with a linear morphology along the boundaries between adjacent cells and in contact with cortical F-actin. However, in conditions of disturbed flow, the cell-cell contacts are discontinuous with an irregular morphology. Adherens junctions are based on the transmembrane adhesive receptor that belongs to the Cadherin family, specifically vascular endothelial (VE)-Cadherin. VE-Cadherin is constitutively linked through its cytoplasmic tail directly to b- or c-Catenin and indirectly to a-Catenin via b- or c-Catenin. Staining for b-Catenin within HAECs cultured under both conditions again confirms in vivo observations. Cells exposed to normal flow exhibit continuous and higher levels of expression of b-Catenin whereas cells cultured under disturbed flow exhibit low and intermittent expression.
Several studies30–34 evaluating ECs under conditions of disturbed flow report increased expression of EC activation markers involved in the binding of activated leukocyte populations like monocytes, macrophages and possibly granulocytes on the endothelium like VCAM-1, ICAM-1, PECAM, and growth factor VEGF-R2, which is involved in EC repair and regeneration. All of these markers are known to be involved in the initiation and progression of atherosclerosis lesions. However, our data indicates flow conditions alone result in small and statistically insignificant changes (p ¼0.05) in expression levels of these four markers in normal and disturbed flow. This is consistent with events leading to lesion formation and progression in regions of disturbed flow in vivo where activation is triggered only in the presence of proinflammatory stimulation via various factors such as hypercholesterolemia, hyperglycemia, hypertension, smoking, and elevated levels of serum C-reactive protein. Our data therefore indicates that in the absence of pro-inflammatory stimulation, markers known to be involved in initiation and progression of atherosclerotic lesions should be comparable to levels in cells cultured under normal conditions.
These results establish proof of concept of the ability of the ECCM to generate a physiologically relevant in vitro cell culture model of atherosclerosis where the specificity of cellular level systems is maintained and the in vivo mechanical loading environment is accurately replicated. This model can be used to understand the molecular basis of events involved in the transduction of altered mechanical stresses in disturbed flow regions that represent a significant risk factor in atherosclerotic lesions formation. This system also provides an ideal platform for drug discovery and development of treatment options for atherosclerosis.