

Биоинженерия / Биомеханика_микрофлюидные_устройства / статьи / 21_chin2011
.pdfPublished on 03 March 2011. Downloaded by Lomonosov Moscow State University on 17/07/2013 21:31:02.
|
View Article Online / Journal Homepage / Table of Contents for this issue |
Lab on a Chip |
Dynamic Article LinksC |
Cite this: Lab Chip, 2011, 11, 1856 |
|
www.rsc.org/loc |
PAPER |
Production of reactive oxygen species in endothelial cells under different pulsatile shear stresses and glucose concentrations†‡
L. K. Chin,a J. Q. Yu,a Y. Fu,a T. Yu,b A. Q. Liua and K. Q. Luo*b
Received 2nd December 2010, Accepted 7th February 2011
DOI: 10.1039/c0lc00651c
A hemodynamic Lab-on-a-chip system was developed in this study. This system has two unique features: (1) it consists of a microfluidic network with an array of endothelial cell seeding sites for testing them under multiple conditions, and (2) the flow rate and the frequency of the culture medium in the microchannel are controlled by a pulsation free pump to mimic the flow profile of the blood in the blood vessel under different physiological conditions. The investigated physiological conditions were:
(1) the resting condition in a normal shear stress of 15 dyne cm 2 with a normal heart rate of 70 bpm, (2) an exhaustive exercise condition with a high shear stress of 30 dyne cm 2 and a fast heart rate of 140 bpm, and (3) a constant high shear stress of 30 dyne cm 2. Two chemical conditions were investigated (10 mM and 20 mM glucose) to mimic hyperglycemic conditions in diabetes patients. The effects of various shear stresses either alone or in combination with different glucose concentrations on endothelial cells were examined using the developed hemodynamic Lab-on-a-chip system by assessing two parameters. One is the intracellular level of reactive oxygen species (ROS) determined by
a fluorescent probe, H2DCFDA. Another is the mitochondrial morphology revealed with a fluorescent dye, MitoTracker Green FM. The results showed that ROS level was elevated nearly 4-fold after 60 min of exhaustive exercise. We found that the pulsatile nature of the fluid was the determination factor for causing ROS generation in the cells as almost no increase of ROS was detected in the constant shear stress condition. Similarly, much higher level of ROS was detected when 10 mM glucose was applied to the cells under normal or high pulsatile shear stresses compared with under a static condition. These results suggest that it is necessary to use pulsatile shear stress to represent the physiological conditions of the blood flow, and demonstrate the advantage of utilizing this newly developed hemodynamic Lab- on-a-chip system over the conventional non-pulsatile system in the future shear stress related studies.
Introduction
Reactive oxygen species (ROS) are natural by-products of the normal aerobic metabolism in cells, which include superoxide anions (O2c ), hydroxyl radicals (OHc), hydrogen peroxide molecules (H2O2), etc.1 The main source of ROS production is the mitochondrion during oxidative phosphorylation, which involves the electron transport chain.2 In the chain, electrons are passed through several proteins by different oxidation–reduction reactions. However, a small percentage of the electrons are leaked out from the mitochondrion electron transport chain, and
aSchool of Electrical and Electronic Engineering, Nanyang Technological University, 50 Nanyang Avenue, Singapore 639798
bChemical and Biomedical Engineering, Division of Bioengineering, 70 Nanyang Drive, Singapore 637457. E-mail: kluo@ntu.edu.sg; Fax: +65 6791-1761; Tel: +65 6790-4257
† Published as part of a LOC themed issue dedicated to Singaporean Research: Guest Editor Professor Ai Qun Liu.
‡ Electronic supplementary information (ESI) available. See DOI: 10.1039/c0lc00651c
subsequently superoxide anions are generated. Other cellular sources of ROS production include enzymatic reactions, signal transduction, antimicrobial action of white blood cells, etc.3 For example, xanthine oxidase catalyzes the oxidation of hypoxanthine to xanthine and further to uric acid by generating superoxide anions. Similarly, reduced nicotinamide adenine dinucleotide phosphate (NADPH) oxidase, which is a membrane-bound enzyme complex, generates superoxide anions by transferring electrons from NADPH inside the cell across the membrane and coupling the electrons to the oxygen molecules. Superoxide anions have limited reactivity by themselves, but they can directly inactivate specific enzymes such as the reduced NADPH complex of the mitochondrion electron transport chain. To maintain the superoxide anion at the basal level and achieve homeostasis, cells use antioxidant defence system to convert superoxide anions to hydrogen peroxide. For example, high concentration of manganese superoxide dismutase (MnSOD) in the mitochondrial matrix catalyzes the breakdown of superoxide anion to hydrogen peroxide and avoids the damage of proteins involved in the regulation of metabolism.
1856 | Lab Chip, 2011, 11, 1856–1863 |
This journal is ª The Royal Society of Chemistry 2011 |
Published on 03 March 2011. Downloaded by Lomonosov Moscow State University on 17/07/2013 21:31:02.
View Article Online
Hydrogen peroxide is a poorly reactive oxidizing agent but it is |
|
||||
cell membrane-permeable. It is generated by several enzymatic |
|
||||
systems inside the cells, such as phagocytic oxidases in the plasma |
|
||||
membrane, sulfydryl oxidase in the endoplasmic reticulum, lipid |
|
||||
oxygenase in cytosol, etc. Under normal metabolic condition, |
|
||||
hydrogen peroxide is involved in the regulation of the signal |
|
||||
transduction events.4 For example, hydrogen peroxide inhibits |
|
||||
crucial phosphatases that attenuate signal propagation from |
|
||||
activated growth factor receptors. However, similar to super- |
|
||||
oxide anions, excess hydrogen peroxide will cause cellular |
|
||||
toxicity. Hydrogen peroxide can react with ferrous iron to form |
|
||||
hydroxyl radicals, which are short-lived ROS and can react with |
|
||||
DNA molecules, membrane lipids, and carbohydrates. This |
|
||||
means that the intracellular concentration of hydrogen peroxide |
|
||||
needs to be tightly regulated. In cells, excess hydrogen peroxide is |
|
||||
broken down by catalase and glutathione (GSH/Px) to yield |
|
||||
water molecules. |
|
|
|
||
Overall, the antioxidant defence system of the cell ensures the |
|
||||
ROS level is kept at the basal and nontoxic level during normal |
|
||||
aerobic metabolism. This includes also non-enzymatic systems |
|
||||
such as glutathione, ascorbate, vitamin, etc. However, the |
|
||||
oxidative stress is generated when the intracellular level of ROS |
|
||||
exceeds the antioxidant ability of the defence system of the cell |
|
||||
and causes the loss of homeostasis. Oxidative stress can lead to |
|
||||
cell damage, apoptosis, and modifications to cellular proteins, |
|
||||
lipids, and DNA. The level of oxidative stress of the cell can be |
|
||||
determined by monitoring the morphological change of the |
|
||||
mitochondria since mitochondria are very important organelles |
|
||||
in the pathway of mitochondria-dependent cell apoptosis.5 |
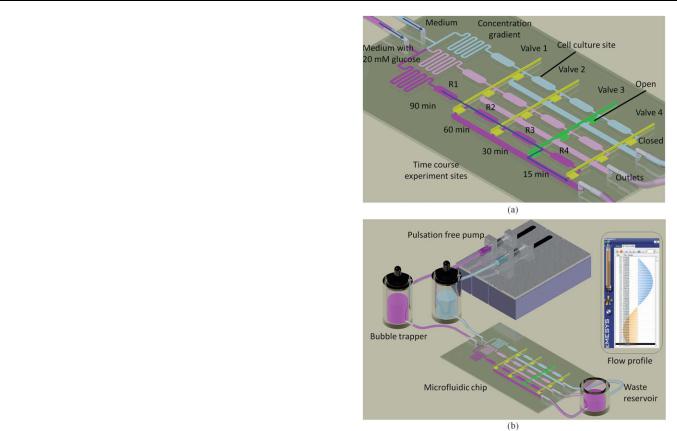
Fig. 1 Schematic illustrations of (a) the design of the microfluidic chip, |
||||
Normally, mitochondria in endothelial cells form a filamentous |
and (b) the hemodynamic Lab-on-a-chip system with configurable flow |
||||
reticular network and constantly undergo morphological |
profile to mimic the blood flow in a blood vessel. |
||||
changes through fusion and fission.6,7 During apoptosis, mito- |
|
||||
chondria are fragmented via fission, and an individual mito- |
different buffer media or dye solutions can be easily injected into |
||||
chondrion becomes swollen and loses its membrane potential. |
|||||
the microchip under predefined flow rates.16 In this paper, the |
|||||
There are |
several reasons for the |
excess levels of |
ROS |
designed Lab-on-a-chip system mimics the flow rate of blood in |
|
production in |
cells. First, short term |
elevation of ROS |
level |
||
the artery at the resting condition or after an exhaustive exercise. |
|||||
occurs after exhaustive exercise.8 Second, the presence of exog- |
|||||
Different concentrations of glucose were added into the flow to |
|||||
enous ROS sources can also elevate the ROS level, such as |
|||||
mimic hyperglycemic conditions in diabetes patients. The shear- |
|||||
ultraviolet light, ionizing radiation, inflammatory cytokines, |
|||||
induced cellular responses under different extracellular condi- |
|||||
environmental toxins, etc. Third, diseases can also increase the |
|||||
tions were studied by investigating the ROS production level in |
|||||
ROS level, such as hypertension,9 renal failure, diabetes,10,11 |
|||||
the endothelial cells and by monitoring the morphological |
|||||
cardiac disease, etc. Therefore, researchers have put in efforts to |
|||||
changes of mitochondria using fluorescence imaging technique. |
|||||
investigate the relationship between the elevated ROS level and |
|||||
|
|||||
the ROS-related diseases, and further search for potential drugs |
|
||||
with antioxidant ability.12 For example, high glucose level13 in |
Materials and methods |
||||
diabetes patients and high sodium level14 in renal failure patients |
Hemodynamic Lab-on-a-chip system |
||||
have been proven to increase the ROS production level in cells. |
|||||
|
|||||
In addition, different antioxidants or ROS scavengers were |
The design of the hemodynamic Lab-on-a-chip system is shown |
||||
studied and shown to reduce ROS production level. However, |
in Fig. 1a. The chip consists of three-layer structures, namely |
||||
these studies were conducted under either a static condition in |
bottom layer with a microfluidic network for cell loading and |
||||
culture dishes or under a constant shear stress,15 which were |
liquid injection, middle layer with pneumatic valves and top layer |
||||
different from the physiological condition with pulsatile shear |
with pneumatic connecting channels to control a series of |
||||
stress. |
|
|
|
pneumatic valves simultaneously. The microfluidic chip was |
|
In order to study the cellular responses of endothelial cells |
fabricated in polydimethylsiloxane (PDMS) material using the |
||||
under a physiological pulsatile shear force-induced condition, |
standard soft lithography process.17 The triple-layered PDMS |
||||
this paper introduces a hemodynamic Lab-on-a-chip system. |
slab was then bonded to a coverslip by exposing to air plasma for |
||||
This system is biocompatible with highly controllable micro- |
15 s using a handheld corona treater (BD-25, Electro-Technic |
||||
fluidic platform so that cells can be cultured in the microchip |
Products). The coverslip was further bonded to a glass slide for |
||||
with a controlled perfusion of culture medium. Furthermore, |
better robustness in operation. For the microfluidic networks, it |
||||
|
|
|
|||
This journal is ª The Royal Society of Chemistry 2011 |
|
Lab Chip, 2011, 11, 1856–1863 | 1857 |
|||

Published on 03 March 2011. Downloaded by Lomonosov Moscow State University on 17/07/2013 21:31:02.
View Article Online
consists of two inlets connected to a concentration gradient network with three branches of microchannels. Each branch of the microchannel has 4 cell culture sites to perform a series of time course experiments. Each cell culture site has a width of 600 mm and a height of 150 mm. The downstream of each cell culture site is connected to a common outlet and has a pneumatic valve for flow switching.
Initially, endothelial cells were loaded, cultured and stained |
|
|
|
prior to the application of shear stress and chemical treatments. |
|
|
|
When the cells were ready for the shear stress and chemical |
Fig. 2 Phase images of endothelial cells (a) seeded in the microchannel |
||
treatments, the two inlets were injected with normal culture |
|||
and (b) cultured in the microchannel for 48 hours. |
|||
medium and culture medium with 20 mM glucose solution, |
|||
|
|
||
respectively. With the concentration gradient network, three |
plus 0.05% EDTA (Gibco, USA). Harvested cells were concen- |
||
chemical conditions can be achieved, i.e. normal culture medium, |
trated by centrifugation and then resuspended in the growth |
||
culture medium with 10 mM glucose and culture medium with |
medium at the concentration of about 1 107 cells ml 1. The cell |
||
20 mM glucose. The time course experiments were conducted in |
suspension was injected into the inlets of the microfluidic chip |
||
the following manner. In the beginning, the first three rows of |
using a glass syringe (Hamilton, USA). The chips were then |
||
valves (valves 1 to 3) were closed and the last row of valves (valve 4) |
incubated in the cell culture incubator with medium replenish- |
||
was opened. Therefore, the liquid injected into the inlet can flow |
ment every 24 hours until the cells in the microchannel reached |
||
through the 4 culture sites at each branch of the micro- |
almost full confluence for the experiments. Growth of the |
||
channel. The first data point was measured at 15 min after the |
endothelial cells in the microchannels was monitored under the |
||
shear stress treatment. At this stage, the valves in the last row |
phase-contrast microscope (IX81, Olympus). Fig. 2a and b show |
||
(valve 4) were closed and the valves in the third rows (valve 3) |
the endothelial cells after initial seeding and after 48 hours |
||
were kept open as shown in Fig. 1a. The cell culture sites in |
culture in the microchannel with a well formed monolayer of |
||
the last row (R4) were disconnected from the microfluidic flow |
cells. In monitoring the ROS level within the endothelial cells, it |
||
in which the medium was flowing into the side branch at the |
is critical to avoid the occurrence of hypoxia due to the lack of |
||
downstream of the third row of culture sites to the outlets. |
oxygen in the culture chamber because oxidative burst and NO |
||
Subsequently, the second data point was measured at 30 min. |
generation have proven to be the initial response to ischemia in |
||
At this stage, the valves in the third rows (valve 3) were |
endothelial cells.18 This hypoxia occurrence in endothelial cells |
||
closed and the valves in the second rows (valve 2) were kept |
can be avoided because the PDMS material is highly oxygen |
||
open. The cell culture sites in the third row (R3) were |
permeable, which ensures that a sufficient amount of oxygen is |
||
disconnected. Similarly, each row of cell culture sites could be |
supplied into the culture chamber.19 |
||
disconnected from the main microfluidic flow at each time |
|
|
|
point by controlling the pneumatic valves. With this densely |
Measurement of ROS by H2DCFDA |
||
designed microfluidic network, one single chip can perform |
|||
|
|
||
a series of experiments with different chemical treatments and |
The intracellular ROS level was measured using a cell-perme- |
||
time course. |
able fluorescent dye of 20,70-dichlorodihydrofluorescein diac- |
||
A pulsation free precision pump (Nemesys, Cetoni) was used |
etate (H2DCFDA) (D399, Invitrogen). The dye remains |
||
for cell loading and media injection as shown in Fig. 1b. The flow |
nonfluorescent until the acetate groups are removed by intra- |
||
profile of the pump was configured to mimic the blood flow in |
cellular esterases, and oxidation occurs due to the presence of |
||
a blood vessel. A bubble trapper was connected between the |
ROS (hydrogen peroxide and hydroxyl radicals) within the |
||
precision pump and the microfluidic chip. The bubble trapper |
cells. Prior to the chemical |
and shear stress experiments, the |
|
could significantly prevent bubbles from flowing into the chip, |
cultured endothelial cells |
in the microfluidic chips were |
|
which can cause the endothelial cells in the microchannel to |
|
|
|
detach from the coverslip and flow out of the chip. A heating |
|
|
|
plate was used to maintain the temperature of the microfluidic |
|
|
|
chip at 37 C for long-term observation under the microscope. |
|
|
|
Protocol for culturing endothelial cells |
|
|
|
Low glucose (1.0 mg ml 1) DMEM (Sigma, USA) was mixed |
|
|
|
1 : 1 (v/v) with F-12 Ham nutrient mixture (Sigma, USA), the |
|
|
|
mixture was supplemented with 10% (v/v) fetal bovine serum |
|
|
|
(FBS, Gibco, USA) and 1% (v/v) penicillin/streptomycin (Gibco, |
|
|
|
USA) to formulate the complete growth medium for culturing |
|
|
|
human vascular endothelial cell line CRL1730 isolated from |
|
|
|
umbilical vein. The endothelial cells were grown in the complete |
Fig. 3 H2DCFDA is hydrolyzed inside the cell, retained in the cyto- |
||
medium in a T-75 cell culture flask (NUNC, Denmark) at 37 C |
|||
plasm, and then oxidized by ROS, leading to the emission of green |
|||
with 5% CO2. Confluent cells were trypsinized with 0.25% trypsin |
fluorescence. |
|
|
|
|
||
1858 | Lab Chip, 2011, 11, 1856–1863 |
This journal is ª The Royal Society of Chemistry 2011 |
||
Published on 03 March 2011. Downloaded by Lomonosov Moscow State University on 17/07/2013 21:31:02.
View Article Online
incubated in culture medium with 10 mM H2DCFDA for |
|
|
|
|
|
|
|
|||||
45 min to establish a stable intracellular level. The cells were |
|
|
|
|
|
|
|
|||||
then being exposed under several chemical and shear conditions |
|
|
|
|
|
|
|
|||||
with the same concentration level of H2DCFDA dissolved in |
|
|
|
|
|
|
|
|||||
culture medium. With the presence of ROS in the cells, the |
|
|
|
|
|
|
|
|||||
H2DCFDA retained in the cytoplasm was oxidized and became |
|
|
|
|
|
|
|
|||||
fluorescent as illustrated in Fig. 3. Therefore, the fluorescence |
|
|
|
|
|
|
|
|||||
intensity of the cell is an index of the intracellular level of ROS. |
|
|
|
|
|
|
|
|||||
The inset of Fig. 3 shows the fluorescent excitation and emis- |
|
|
|
|
|
|
|
|||||
sion wavelengths of H2DCFDA with Ex ¼ 475 nm and Em ¼ |
|
|
|
|
|
|
|
|||||
525 nm. Immediately before measuring the fluorescence inten- |
|
|
|
|
|
|
|
|||||
sity, the endothelial cells were washed with phosphate buffered |
|
|
|
|
|
|
|
|||||
saline (PBS) to remove the extracellular |
H2DCFDA for |
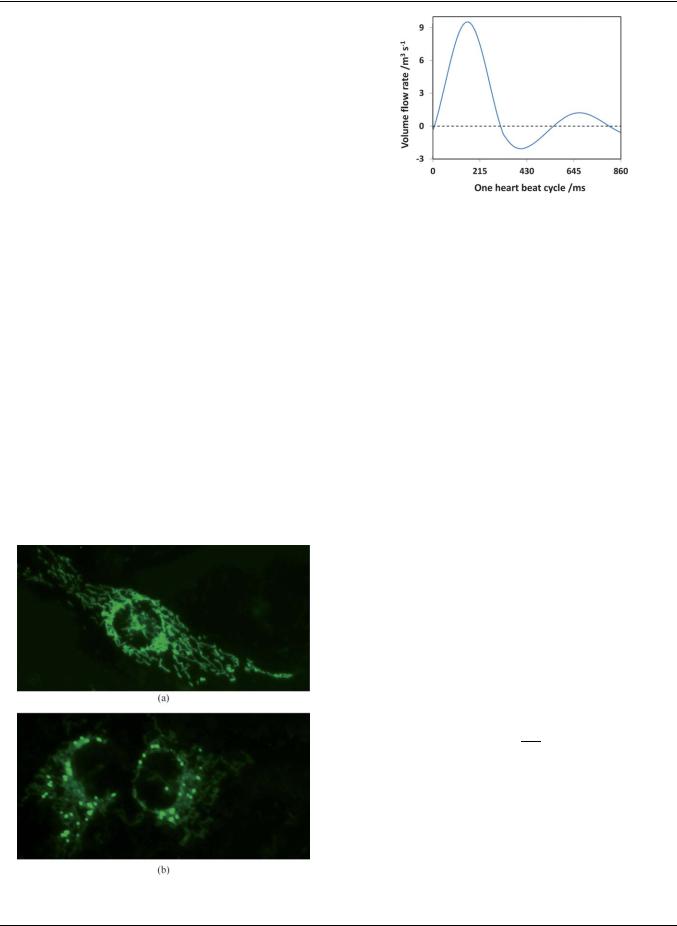
Fig. 5 |
Volume flow rate profile of plasma in a typical artery with |
|||||||||
achieving higher signal/noise ratio. The fluorescent images were |
||||||||||||
endothelial cells under a shear stress of 15 dyne cm 2. |
|
|
||||||||||
captured using an inverted fluorescence microscope (Axiovert |
|
|
||||||||||
|
|
|
|
|
|
|
||||||
S100, Carl Zeiss) equipped with a monochrome camera (RT, |
|
|
|
|
|
|
|
|||||
SPOT imaging solutions). For each chemical and shear treat- |
chips were incubated in culture medium with a working |
|||||||||||
ment condition, 300 cells were measured to obtain the average |
||||||||||||
concentration of 200 nM of MitoTracker dye for 45 min. After |
||||||||||||
fluorescence intensity. Each data point was normalized by the |
||||||||||||
that cells were washed with PBS to remove extracellular |
||||||||||||
maximal intensity and expressed as a fraction of the maximum |
||||||||||||
MitoTracker |
dye. With |
a stable intracellular |
level of |
Mito- |
||||||||
value. |
|
|
|
|
||||||||
|
|
|
|
Tracker dye, the cells were exposed under several chemical and |
||||||||
|
|
|
|
|
||||||||
|
|
|
|
|
shear treatment conditions. When excited at 490 nm, the fluo- |
|||||||
Examination of mitochondrial morphology |
|
|
rescence of the MitoTracker dye could be observed directly at |
|||||||||
Mitochondrial morphology can be visualized by staining the |
the emission wavelength of 516 nm after the treatment. The |
|||||||||||
morphologies of the mitochondria were studied via the |
||||||||||||
mitochondria inside the cells |
using a green fluorescent dye |
|||||||||||
captured fluorescent images using an inverted fluorescence |
||||||||||||
(MitoTracker Green FM, Invitrogen). The MitoTracker Green |
||||||||||||
microscope |
(Axiovert |
S100, |
Carl Zeiss) |
equipped |
with |
|||||||
FM is essentially nonfluorescent in an aqueous solution, and |
||||||||||||
a monochrome camera (RT, SPOT imaging solutions) as |
||||||||||||
becomes fluorescent when it accumulates in a lipid environment |
||||||||||||
shown in Fig. 4. For |
each |
chemical and shear treatment |
||||||||||
in the mitochondria. Therefore, |
background fluorescence is |
|||||||||||
condition, 300 cells were examined to determine the morpho- |
||||||||||||
negligible and the morphologies of the mitochondria can be |
||||||||||||
logical changes of the mitochondria. Each data point was |
||||||||||||
visualized clearly. Prior to |
the |
chemical and |
shear stress |
|||||||||
expressed as a mitochondrial fission ratio, which is the ratio of |
||||||||||||
experiments, the endothelial |
cells |
grown in |
the |
microfluidic |
||||||||
|
|
|
|
|
|
|
||||||
the number of cells with diffused mitochondria to the total number of cells evaluated.
Pulsatile shear stress in the artery
In this experiment, a typical velocity profile of the artery was chosen to induce the shear stress on the cultured endothelial cells in the chip as shown in Fig. 5.20,21 Under normal condition, the typical shear stress in the artery is 15 dyne cm 2 and a heart rate of 70 beats per minute (bpm). During exhaustive exercise, the shear stress and heart rate may increase to 30 dyne cm 2 and 140 bpm, respectively.22,23 As the microchannel was fabricated into a rectangular shape, the shear stress in the microchannel was determined as24
Fig. 4 Fluorescent images of endothelial cells with (a) filamentous reticular mitochondrial networks and (b) mitochondrial fragmentation.
Qm |
|
s ¼ 12h2w |
(1) |
where Q is the volume flow rate, m is the liquid’s viscosity, h and w are the height and width of the microchannel, respectively. As the microchannel has a height of 150 mm and a width of 600 mm, the plasma with m of 1.2 mPa requires a volume flow rate of 4.23 mL s 1 to achieve a shear stress of 1.5 Pa. Based on eqn (1), the volume flow rate can be increased to achieve higher shear stress. In this experiment, the shear stress was adjusted from 15 to 30 dyne cm 2 and the selected heart rates were 70 bpm under normal condition and 140 bpm under exhaustive exercise.
This journal is ª The Royal Society of Chemistry 2011 |
Lab Chip, 2011, 11, 1856–1863 | 1859 |
Published on 03 March 2011. Downloaded by Lomonosov Moscow State University on 17/07/2013 21:31:02.
View Article Online
|
velocity profile for one heart beat cycle was then plotted and |
|
|
compared with the theoretical profile as shown in Fig. S1‡. It |
|
|
shows that the measured flow profile has the same trend as the |
|
|
theoretical profile. The flow for one cycle under the condition of |
|
|
faster heart beat (140 bpm) and higher shear stress (30 dyne cm 2) |
|
|
is shown in Movie M1 (ESI‡) (frame rate: 300 fps). The temporal |
|
|
responses of the endothelial cells in ROS production level under |
|
|
different shear treatment conditions are shown in Fig. 6. The |
|
|
static condition without a fluidic flow serves as a negative control |
|
|
of the experiment and it can be seen that the fluorescence |
|
|
intensity increased when the dye molecules stained the cells for |
|
|
longer than 15 min. To exclude this intensity increment, the |
|
|
normalized fluorescence intensities for the other three shear |
|
|
treatment conditions were subtracted with that of the negative |
|
|
control. Fig. 7a shows the intracellular ROS level when the |
|
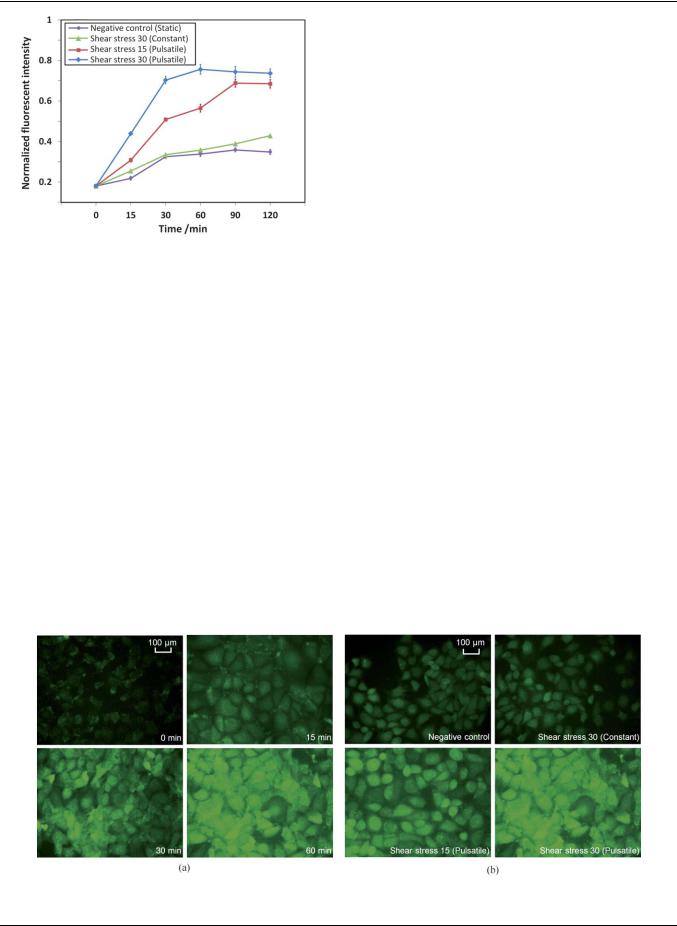
Fig. 6 Temporal responses of the ROS level in endothelial cells under |
endothelial cells were being exposed to pulsatile shear stress of 30 |
|
different shear stress profiles. |
dyne cm 2 for different time periods. The ROS level was |
|
|
increased at the first 60 min by nearly 4-fold (Fig. 6). Prolonged |
|
Experimental results and discussions |
exposure of the endothelial cells to the shear flow up to 2 hours |
|
Shear-induced cellular responses |
resulted in a sustained elevation in ROS levels (Fig. 6), which is |
|
similar to the one reported previously.15 The ROS levels of |
||
|
||
Three different shear treatment conditions were selected to |
endothelial cells under different shear treatment conditions for |
|
investigate the shear-induced responses on cultured endothelial |
up to 120 min are shown in Fig. 6 and 7b. By comparing the ROS |
|
cells in the microchannel: (1) a constant shear stress of 30 dyne |
levels in various shear treatment conditions at the 60 min time |
|
cm 2 with a steady flow rate of 8.46 mL s 1, (2) a normal physi- |
point, there is no significant increase of ROS level between the |
|
ological pulsatile shear stress of 15 dyne cm 2 (mean) with |
constant shear stress of 30 dyne cm 2 and the negative control, |
|
a frequency of 70 bpm as shown in Fig. 5, and (3) a fast pulsatile |
which has no shear stress as the culture medium was maintained |
|
shear stress of 30 dyne cm 2 (mean) with a frequency of 140 bpm |
in a static condition in the microchannel (0.36/0.34). In contrast, |
|
to mimic the condition under exhaustive exercise. The pulsatile |
the increment was more substantial when the endothelial cells |
|
flow profile was verified by tracking the displacement of the |
were being exposed to physiological pulsatile shear stress |
|
suspended microbeads with a diameter of 5 mm in the micro- |
conditions. The ROS level was increased by 1.7 fold (0.56/0.34) |
|
channel. A high-speed camera (Photron, FASTCAM SA3) was |
and 2.2 fold (0.76/0.34) at pulsatile shear stress of 15 and 30 dyne |
|
employed to capture images of the microbeads in the micro- |
cm 2, respectively (Fig. 6). This results show that it is necessary to |
|
channel at 6000 fps. The velocity of the microbeads at different |
investigate the effect of shear stress on the endothelial cells under |
|
time points was calculated based on the displacement of the |
a physiological condition, which can truly reflect the pulsatile |
|
microbeads within a known time period. Based on the calculated |
pattern of the blood flow in the artery. In addition, reports |
|
velocity and the cross-sectional area of the microchannel, the |
stating that pulsatile shear stress is critical to maintain the |
|
flow rate of the flow in the microchannel was determined. The |
functionalities of endothelial cells in the artery have been |
Fig. 7 The ROS level in endothelial cells being exposed to (a) a pulsatile shear stress of 30 dyne cm 2 for different times and (b) different shear treatment conditions for 60 min.
1860 | Lab Chip, 2011, 11, 1856–1863 |
This journal is ª The Royal Society of Chemistry 2011 |

Published on 03 March 2011. Downloaded by Lomonosov Moscow State University on 17/07/2013 21:31:02.
View Article Online
Fig. 8 Mitochondrial morphology of endothelial cells under different shear treatment conditions for 3 hours.
presented.25,26 Therefore, it is more realistic to expose the endothelial cells using pulsatile shear stress under different chemical conditions in the experiments.
The mitochondrial morphology of endothelial cells being exposed under different shear treatment conditions was investigated using MitoTracker staining and the fluorescent images are shown in Fig. 8. The endothelial cells under static condition (negative control) were mostly tubular with the appearance of filamentous reticular networks. Only 2% of the cells had shorter and smaller mitochondria, indicating mitochondrial fragmentation. When the endothelial cells were exposed to a physiological pulsatile shear stress, some of the cells showed mitochondrial morphological changes. The mitochondrial fission ratios of the endothelial cells under these conditions for the first 3 hours are shown in Fig. 8. The levels of endothelial cells with mitochondrial fragmentation after being exposed to pulsatile shear stress of 15 and 30 dyne cm 2 for 3 hours were measured as 6.8% and 7.6%, respectively. This is reasonable as endothelial cells should remain viable and functioning under normal physiological pulsatile shear stress or during exhaustive exercise.
To evaluate the shear-induced ROS production, two antioxidants were examined, i.e. propyl gallate (PG) and butylated hydroxyanisole (BHA). PG is an antioxidant which inhibits the oxidation by hydrogen peroxide and oxidative free radicals. On the other hand, BHA is an antioxidant which stabilizes free radicals and acts as a free radical scavenger. In the experiments,
Fig. 9 Effects of propyl gallate (PG) and butylated hydroxyanisole (BHA) on shear-induced increase of ROS production in endothelial cells.
the endothelial cells were pretreated with either one of the antioxidants at 20 mM for 30 min. Subsequently, the endothelial cells were being exposed to the pulsatile shear stress of 30 dyne cm 2 for one hour, and the ROS levels were measured as shown in Fig. 9. The ROS level was increased by 4-fold without the addition of antioxidants. The ROS level was significantly reduced by PG, but not BHA suggesting that the fast pulsatile shear stress may cause the production of hydrogen peroxide in endothelial cells.
Effects of glucose concentrations on ROS levels
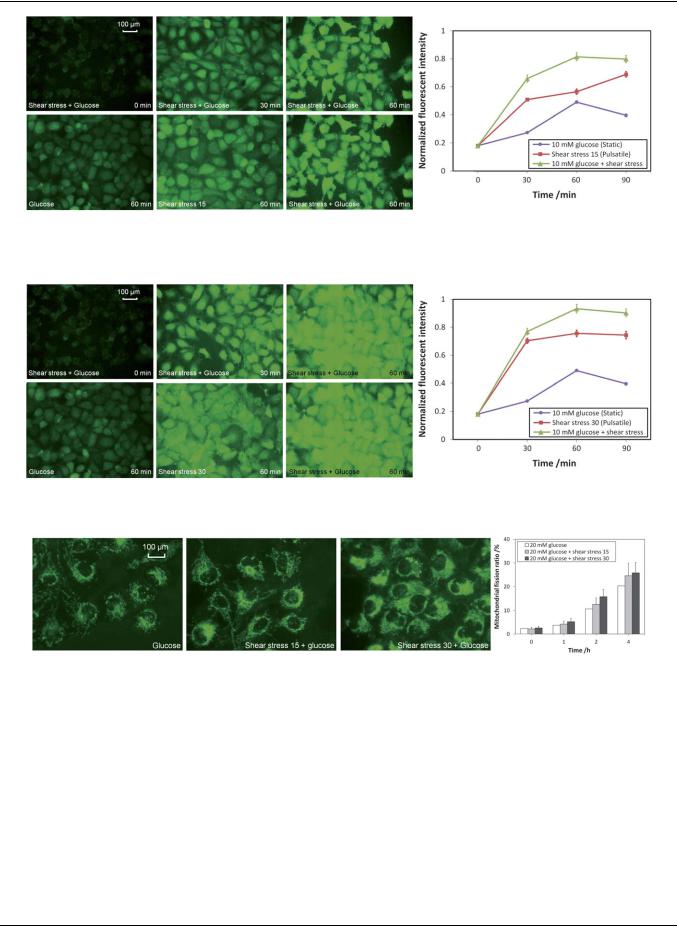
For normal people, the concentration of glucose in the blood is ranging from 4 to 6 mM. For diabetes patients, however, the concentration of glucose in the blood is above 6 mM and may be up to 20 mM. In these experiments, 10 mM of glucose was added to mimic the plasma condition of a diabetes patient and the ROS level of the endothelial cells was monitored under normal physiological pulsatile shear stress condition or under exhaustive exercise. The experimental results for the normal physiological pulsatile shear stress condition are shown in Fig. 10. When the endothelial cells were being exposed to 10 mM glucose under the normal pulsatile shear stress of 15 dyne cm 2, the ROS level was quickly increased for over 4-fold in the first 60 min and stabilized afterward. By comparing the ROS level at the 60 min time point between the cells treated with 10 mM glucose in a static state and that under a normal shear stress of 15 dyne cm 2, the ROS level was increased 1.7 fold (0.81/0.49) (graph in Fig. 10). It can be concluded that although high concentration of glucose can elevate the level of intracellular ROS, a much higher level of ROS can be detected if the glucose solution is delivered under a normal pulsatile shear stress condition.
Fig. 11 shows the results of endothelial cells being exposed to the fast pulsatile shear stress of 30 dyne cm 2 (exhaustive exercise). Similar to the ROS elevation profile observed under the normal pulsatile shear stress of 15 dyne cm 2, the ROS level was significantly increased for nearly 5-fold in the first 60 min and stabilized afterward. By comparing the ROS level at the 60 min time point between the cells treated with 10 mM glucose in a static state and that under the high level of shear stress of 30 dyne cm 2, the ROS level was increased 1.9-fold (0.93/0.49) (graph in Fig. 11). By comparing the ROS level in the 60 min time point between the one with normal pulsatile shear stress of 15 dyne cm 2 and the one with a fast pulsatile shear stress of 30 dyne cm 2, the ROS level was elevated by 15% (0.93/0.81) (graphs in Fig. 10 and 11). It can be concluded that the high glucose level under exhaustive exercise condition can substantially increase the intracellular level of ROS.
This journal is ª The Royal Society of Chemistry 2011 |
Lab Chip, 2011, 11, 1856–1863 | 1861 |
Published on 03 March 2011. Downloaded by Lomonosov Moscow State University on 17/07/2013 21:31:02.
View Article Online
Fig. 10 The ROS level in endothelial cells being exposed to 10 mM glucose with normal pulsatile shear stress of 15 dyne cm 2.
Fig. 11 The ROS level in endothelial cells being exposed to 10 mM glucose with fast pulsatile shear stress of 30 dyne cm 2.
Fig. 12 Mitochondrial morphology of endothelial cells with 20 mM glucose under different shear treatment conditions.
Effects of glucose concentrations on mitochondrial morphology
To investigate the mitochondrial morphological changes of endothelial cells, 20 mM of glucose was added and the endothelial cells were being exposed under different shear treatment conditions for 4 hours. The fluorescent images of the endothelial cells after being exposed for 4 hours and the mitochondrial fission ratios monitored for the first 4 hours are shown in Fig. 12. For endothelial cells treated with 20 mM glucose for 4 hours, mitochondrial fragmentation was prevalent with a mitochondrial fission ratio of 20%. When the endothelial cells were being exposed with 20 mM glucose plus the pulsatile shear stress of 15 or 30 dyne cm 2, the mitochondrial fission ratio was further
elevated from 20% to 25% and 26%, respectively. The results show that the chemical treatment (i.e. high concentration of glucose) produced a more dominant effect in promoting mitochondrial fission than the physical treatment (i.e. pulsatile shear stress), especially in such an extreme case of 20 mM of glucose.
Conclusions
In this paper, the intracellular ROS level and the mitochondrial morphology of endothelial cells under physiological pulsatile shear stresses and different glucose concentrations were investigated using a hemodynamic Lab-on-a-chip system. The
1862 | Lab Chip, 2011, 11, 1856–1863 |
This journal is ª The Royal Society of Chemistry 2011 |

Published on 03 March 2011. Downloaded by Lomonosov Moscow State University on 17/07/2013 21:31:02.
|
|
|
View Article Online |
||
intracellular ROS level was studied using real-time fluorescence |
3 |
L. G. Kevin, E. Novalija and D. F. Stowe, Anesth. Analg. (N.Y.), |
|
||
microscopy with the measurement of the oxidation of H2DCFDA |
|
2005, 101, 1275. |
|
||
4 |
M. Giorgio, M. Trinei, E. Migliaccio and P. G. Pelicci, Nat. Rev. Mol. |
||||
by hydroxyl radicals or hydrogen peroxide molecules. The |
|||||
|
Cell Biol., 2007, 8, 722. |
||||
elevated cellular ROS level led to morphological changes of |
|
||||
5 |
D. R. Green and G. Kroemer, Science, 2004, 305, 626. |
||||
mitochondria from filamentous reticular networks to diffused and |
6 |
T. Yu, S.-S. Sheu, J. L. Robotham and Y. Yoon, Cardiovasc. Res., |
|||
short fragments. The mitochondrial morphology was studied via |
|
2008, 79, 341. |
|
|
|
7 |
J. B. Brocard, G. L. Rintoul and I. J. Reynolds, Biol. Cell, 2003, 95, |
||||
fluorescent MitoTracker staining. The shear-induced cellular |
|||||
|
239. |
|
|
||
|
|
|
|
||
responses of endothelial cells under glucose concentration of 10 |
8 |
L. L. Ji, Proc. Soc. Exp. Biol. Med., 1999, 222, 283. |
|||
mM or 20 mM were realized and studied by mimicking the |
9 |
T. Mori and A. W. Cowley,Jr, Hypertension, 2004, 43, 341. |
|||
physiological pulsatile flow profiles in the blood vessel, i.e. during |
10 |
T. Inoguchi, P. Li, F. Umeda, H. Y. Yu, M. Kakimoto, M. Imamura, |
|||
|
T. Aoki, T. Etoh, T. Hashimoto, M. Naruse, H. Sano, H. Utsumi and |
||||
resting and exhaustive exercising. The results show that ROS level |
|
||||
|
H. Nawata, Diabetes, 2000, 49, 1939. |
||||
was elevated during exhaustive exercise (shear stress of 30 dyne |
11 |
F. Cosentino, M. Eto, P. D. Paolis, B. van der Loo, M. Bachschmid, |
|||
cm 2) and with high glucose concentration (diabetes patient). The |
|
V. Ullrich, A. Kouroedov, C. D. Gatti, H. Joch, M. Volpe and |
|||
results also show that pulsatile shear stress is an essential element |
|
T. F. Luscher,€ |
Circulation, 2003, 107, 1017. |
||
12 |
O. I. Aruoma, Free Radical Biol. Med., 1996, 20, 675. |
||||
|
|||||
to mimic the physiological conditions in the blood vessel, which |
13 |
T. Sano, F. Umeda, T. Hashimoto, H. Nawata and H. Utsumi, |
|||
also highlights the potential of using the developed Lab-on-a-chip |
|
Diabetologia, 1998, 41, 1355. |
|||
system in future hemodynamic studies as compared to the |
14 |
Z. Zhang, N. I. Dmitrieva, J.-H. Park, R. L. Levine and M. B. Burg, |
|||
|
Proc. Natl. Acad. Sci. U. S. A., 2004, 101, 9491. |
||||
conventional experimental setup. |
|
||||
15 |
H.-J. Hsieh, C.-C. Cheng, S.-T. Wu, J.-J. Chiu, B.-S. Wung and |
||||
|
|
D. L. Wang, J. Cell. Physiol., 1998, 175, 156. |
|||
Acknowledgements |
16 |
J. El-Ali, P. K. Sorger and K. F. Jensen, Nature, 2006, 442, 403. |
|||
17 |
L. K. Chin, A. Q. Liu, Y. C. Soh, C. S. Lim and C. L. Lin, Lab Chip, |
||||
This work was supported by the Academic Research Fund |
|
2010, 10, 1072. |
|
|
|
18 |
Y. Manevich, A. Al-Mehdi, V. Muzykantov and A. B. Fisher, Am. J. |
||||
(AcRF) Tier 1 (RG45/09, M52120104) by the Minister of |
|
Physiol. Heart Circ. Physiol., 2001, 280, H2126–H2135. |
|||
Education in Singapore and the research project (Grant No. |
19 |
E. Leclerc, Y. Sakai and T. Fujii, Biomed. Microdevices, 2003, 5, 109–114. |
|||
20 |
D. N. Ku, Annu. Rev. Fluid Mech., 1997, 29, 399–434. |
||||
MEWR C651/06/171) by Environmental and Water Industry |
|||||
21 |
X. He, D. N. Ku and J. E. Moore,Jr, Ann. Biomed. Eng., 1993, 21, 45–49. |
||||
|
|||||
Development Council of Singapore. |
22 |
D. J. Duncker and R. J. Bache, Physiol. Rev., 2008, 88, 1009–1086. |
|||
|
23 |
G. Hellstrom€ and N. G. Wahgren, Neurosurg. Rev., 1993, 16, 151– |
|||
|
|
156. |
|
|
|
References |
24 |
H. Lu, L. Y. Koo, W. M. Wang, D. A. Lauffenburger, L. G. Griffith |
|||
|
|
and K. F. Jensen, Anal. Chem., 2004, 76, 5257–5264. |
|||
1 J. S. Armstrong and M. Whiteman, Methods Cell Biol., 2007, 80, 355. |
25 |
P. F. Davies, Physiol. Rev., 1995, 75, 519. |
|||
2 T. Finkel and N. J. Holbrook, Nature, 2000, 408, 239. |
26 |
P. F. Davies and S. C. Tripathi, Circulation, 1993, 72, 239. |
|||
This journal is ª The Royal Society of Chemistry 2011 |
Lab Chip, 2011, 11, 1856–1863 | 1863 |