

Cardiology / Электрокардиография Ослопова 2005 года
.pdfГОСУДАРСТВЕННОЕ ОБРАЗОВАТЕЛЬНОЕ УЧРЕЖДЕНИЕ ВЫСШЕГО ПРОФЕССИОНАЛЬНОГО ОБРАЗОВАНИЯ
КАЗАНСКИЙ ГОСУДАРСТВЕННЫЙ МЕДИЦИНСКИЙ УНИВЕРСИТЕТ ФЕДЕРАЛЬНОГО АГЕНТСТВА ПО ЗДРАВООХРАНЕНИЮ И
СОЦИАЛЬНОМУ РАЗВИТИЮ КАФЕДРА ПРОПЕДЕВТИКИ ВНУТРЕННИХ БОЛЕЗНЕЙ
Введение в электрокардиографию
Учебно-методическое пособие
Introduction to Electrocardiography
Manual
Казань, 2005
УДК 616.12-008.3-073.96 ББК 54.101
Печатается по решению Центрального координационнометодического совета Казанского государственного медицинского университета
Авторы-составители:
заведующий кафедрой пропедевтики внутренних болезней профессор В.Н.Ослопов, доцент О.В.Богоявленская, ассистент Ю.В.Ослопова, старший преподаватель кафедры иностранных языков Л.А.Ануфриева
Рецензенты:
декан отделения по работе с иностранными студентами, к.м.н., доцент кафедры эпидемиологии
Н.М.Хакимов старший преподаватель кафедры иностранных языков
И.В.Карамышева
Ослопов В.Н., Богоявленская О.В., Ослопова Ю.В., Ануфриева Л.А. Основы электрокардиографии. Учебно-методическое пособие.
Introduction to Electrocardiography. Manual. - Казань: КГМУ, 2005. – 102 с.
Учебно-методическое пособие составлено в соответствии с Государственным образовательным стандартом высшего профессионального образования, Государственными требованиями к минимуму содержания и уровню подготовки выпускника вуза по специальности 040100 «Лечебное дело», типовой и рабочей программами по дисциплине «Пропедевтика внутренних болезней». В учебно-методическом пособии подробно освещается содержание занятий по электрокардиографии, изложен теоретический материал, приводятся контрольные вопросы и задания. Пособие предназначено для иностранных студентов медицинских вузов.
Казанский государственный медицинский университет, 2005
CONTENTS |
|
ABBREVIATION ……...………………………………………. |
4 |
UNIT 1 ......................................................................................... |
5 |
Theme 1. Electrocardiography. Performing the |
|
electrocardiographic test, electrocardiographic leads, and patterns |
|
analyzed in electrocardiographic analysis. Analyzing and interpreting |
|
the electrocardiogram. The normal Electrocardiogram........................... |
5 |
Theme 2. Atrial and Ventricular Hypertrophy. Right and Left |
|
Bundle (Bundle of His) Branches Block ................................................. |
36 |
UNIT 2 ........................................................................................... |
52 |
Theme 1. Sinus rhythm disturbances. Sino-atrial block. |
|
Atrioventricular block. Pre-excitation syndrome..................................... |
52 |
Theme 2. Supraventricular arrhythmias (premature atrial and |
|
junctional contractions, paroxysmal supraventricular tachycardia, atrial |
|
fibrillation and flutter). Ventricular arrhythmias (ventricular premature |
|
beats, ventricular tachycardia, torsades de pointes and the long QT- |
|
interval syndrome, and ventricular fibrillation)........................................ |
64 |
UNIT 3 ........................................................................................... |
81 |
Theme 1. Myocardial ischemia and infarction: the classic ECG- |
|
findings, evolution of ECG-changes, the topical diagnosis. Standard |
|
exercise electrocardiography.................................................................... |
81 |
Control Summing-up ....................................................................... |
102 |
Literature used ............................................................................... |
102 |
|
4 |
|
ABBREVIATION |
AAL |
anterior axillary line |
AV |
atrioventricular |
AVNRT |
atrioventricular nodal reentrant tachycardia |
EA |
electrical axis |
ECG |
electrocardiogram |
HR |
heart rate |
ICS |
intercostal space |
LA |
left atrium |
LAA |
left atrium abnormality |
LAE |
left atrial enlargement |
LBBB |
left bundle branch block |
LGL |
Lown-Ganong-Levine |
Lt |
left |
LV |
left ventricle |
LVH |
left ventricular hypertrophy |
MAL |
midaxillary line |
MCL |
midclavicular line |
MFAT |
multi-focal atrial tachycardia |
PACs |
premature atrial contractions |
PJCs |
premature junctional contractions |
PSVT |
paroxysmal supraventricular tachycardia |
PVC |
premature ventricular contraction |
RA |
right atrium |
RBBB |
right bundle branch block |
Rt |
right |
RV |
right ventricle |
RVH |
right ventricular hypertrophy |
SA |
sinoatrial |
TIDA |
time of the internal deflection of atrtia |
TIDV |
time of the internal deflection of ventricles |
VF |
ventricular flutter |
VM |
ventricular muscle |
VPBs |
ventricular premature beats |
WPW |
Wolff-Parkinson-White |
5
UNIT 1
Theme 1. ELECTROCARDIOGRAPHY.
PERFORMING THE ELECTROCARDIOGRAPHIC TEST, ELECTROCARDIOGRAPHIC LEADS, PATTERNS ANALYZED IN
ELECTROCARDIOGRAPHIC ANALYSIS. ANALYZING AND INTERPRETING THE ELECTROCARDIOGRAM. THE NORMAL ELECTROCARDIOGRAM
Goal:
to get a notion about physiological basis of the Electrocardiogram (ECG) and the principles of the performing the electrocardiographic test, to master skills.
Knowledge objectives:
to know the history of electrocardiography, physiological basis of the Electrocardiogram, the principles of the performing the electrocardiographic test, the characteristic features of the ECG-leads (3 standard limb leads, 3 augmented limb leads, 6 unipolar chest, or precordial, leads), the ECG-wave morphology, the term ―electrical axis‖ and the angle , approach to ECG-analysis.
Skill objectives:
to develop practical skills in performing the electrocardiographic test and analyzing the normal electrocardiogram.
EDUCATIONAL MATERIAL
Electrocardiography – is a method to study bioelectric potentials generated by the myocardium; graphic recording of electric potentials generated by the heart. Electrocardiogram (ECG) is a record of the electrical changes in the heart muscles. The signals are detected by means of metal electrodes attached to the extremities and chest wall and are then amplified and recorded by the electrocardiograph.
Although the ECG shows no more than the intermittent passage of electrical impulses in the heart, the tracings provide detailed information
6
about the physical condition and functioning of the heart muscle. Disturbances of the natural rhythm are precisely shown, and damage to the muscle, e.g. caused by disease of the coronary arteries, can be localized. It is one of the most useful diagnostic aids after a suspected heart attack, both in the early stages to show whether and to what extent the heart is affected, and later to indicate the patient's progress. An ECG recording made during graduated exertion, e.g. on a static bicycle or treadmill, is a valuable test of fitness and may expose abnormalities not seen on the resting cardiogram.
THE HISTORY OF ELECTROCARDIOGRAPHY
The start of electricardiography (ECG) took place more than two centuries ago.
In 1780 Italian Anatomist Luigi Galvani (1780) noticed that a dissected frog's leg was twitching when touched with a metal scalpel: ―I had dissected and prepared a frog in the usual way and while I was attending to something else I laid it on a table on which an electrical machine stood at some distance from its conductor and separated from it by a considerable space. Now when one of the persons present touched accidentally and lightly the inner crural nerves of the frog with the point of a scalpel, all the muscles of the legs seemed to contract again and again as if they were affected by powerful cramps‖. Later L.Galvani showed that direct contact with an electrical generator or the ground through an electrical conductor would lead to a muscle contraction. L.Galvani also used brass hooks which were attached to the frog's spinal cord and were suspended from an iron railing in a part of his garden. He noticed that the frogs' legs twitched during lightening storms and also when the weather was fine. He interpreted these results in terms of "animal electricity" or the preservation in an animal of ―nerveoelectrical fluid‖ similar to that of an electric eel. Galvani's name is given to the ―galvanometer‖ which is an instrument for measuring (and recording) electricity - this is essentially what an ECG is; a sensitive galvanometer. In 1791 Galvani discovered that electrical stimulation of a frog's heart lead to cardiac muscular contraction.
7
In 1843-1849 a German physiologist Emil Dubois-Reymond described an ―action potential‖ accompanying each muscular contraction. He detected the small voltage potential present in a resting muscle and diminished with contraction of the muscle. He developed one of the most sensitive galvanometers of his time. His device had a wire coil with nearly 24 000 turns - 5 km of wire.
In 1878 British physiologists John Burden Sanderson and Frederick Page recorded the heart's electrical current with a capillary electrometer and showed that it consisted of two phases (later called QRS and T).
In 1880 a French physicist Arsene d’Arsonval in association with Marcel Deprez improved the galvanometer. Instead of a magnetized needle moving when electrical current flowed through a surrounding wire coil the Deprez-d'Arsonval galvanometer had a fixed magnet and moveable coil. If a pointer is attached to the coil it can move over a suitably calibrated scale. The d'Arsonval galvanometer is a basis for most modern galvanometers.
In 1887 a British physiologist Augustus D. Waller of St Mary's Medical School, London published the first human electrocardiogram. It was recorded with a capilliary electrometer from Thomas Goswell, a technician in the laboratory.
In 1889 a Dutch physiologist Willem Einthoven, Leyden, saw Waller who demonstrated his technique at the First International Congress of Physiologists in Bale. Waller often demonstrated his technique using his dog "Jimmy" who would patiently stand with paws in glass jars of saline.
In 1891 British physiologists William Bayliss and Edward Starling of University College London improved the capillary electrometer. They connected the terminals to the right hand and to the skin over the apex beat and showed a ―triphasic variation accompanying (or rather preceding) each beat of the heart‖. Those deflections were later called P,
QRS and T.
In 1893 Willem Einthoven introduced the term ―electrocardiogram‖ at a meeting of the Dutch Medical Association (later he claimed that Waller was the first to use the term). In 1895 Einthoven distinguished five deflections which he named P, Q, R, S and T.

8
1895 to date: The first accurate recording of the electrocardiogram and its development as a clinical tool.
Why PQRST and not ABCDE? The four deflections prior to the correction formula were labelled ABCD and the 5 derived deflections were labelled PQRST. The choice of P is a mathematical convention by using letters from the second half of the alphabet. N has other meanings in mathematics and O is used for the origin of the Cartesian coordinates. In fact Einthoven used O...X to mark the timeline on his diagrams. P is simply the next letter. A lot of work had been undertaken to reveal the true electrical waveform of the ECG by eliminating the damping effect of the moving parts in the amplifiers and using correction formulae. If you look at the diagram in Einthoven's 1895 paper you will see how close it is to the string galvanometer recordings and the electrocardiograms we see today. The image of the PQRST diagram may have been striking enough to have been adopted by the researchers as a true representation of the underlying form. It would have then been logical to continue the same naming convention when the more advanced string galvanometer started creating electrocardiograms a few years later.
In 1901-1903 W.Einthoven invented a new galvanometer for producing electrocardiograms using a fine quartz string coated in silver based on ideas by Deprez and d'Arsonval (who used a wire coil). His
―string galvanometer‖ weighed 600 pounds. W.Einthoven acknowledged the similar system by Ader but later (1909) calculated that his galvanometer was in fact many thousands of times more sensitive. W.Einthoven published the first electrocardiogram recorded on a string galvanometer and in 1903 he already discussed commercial production of a string galvanometer with Max Edelmann of Munich and Horace Darwin of Cambridge Scientific Instruments Company of London. In 1905 W.Einthoven started transmitting electrocardiograms from the hospital to his laboratory 1,5 km away via telephone cable. On
March 22nd the first ―telecardiogram‖ was recorded from a healthy and vigorous man and the tall R waves were attributed to his cycling from laboratory to hospital for the recording.
9
1903 to date: the official date of the ECG appearance is considered to be 1903 when Einthoven invented an apparatus to record electric changes in the heart.
Simultaneously with Einthoven a Russian physiologist Alexander Ph. Samoilov of Kazan University (1867–1930) in 1903 recorded with the help of capillary electrometer thin potentials of muscle action, and in 1906 he performed the electrographic record for the first time in Russia. From that time professor A.Samoilov and professor Vladimir Ph. Zelenin (1881–1968) began an active introduction of the method into clinic.
In 1912 Einthoven addressed the Chelsea Clinical Society in London and described an equilateral triangle formed by his standard leads I, II and III later called ―Einthoven's triangle‖. In 1924 Willem
Einthoven was awarded the Nobel Prize for his invention of the electrocardiogram.
In 1932 F. Wilson offered the chest leads, American Heart Association and the Cardiac Society of Great Britain defined the standard positions, and wiring, of the chest leads V1 – V6 (the ―V‖ stands for voltage).
In 1934 by joining the wires from the right arm, left arm and left foot with 5000 Ohm resistors Frank Wilson defined an ―indifferent electrode‖ later called the ―Wilson Central Terminal‖. The combined lead acts as an earth and is attached to the negative terminal of the ECG. An electrode attached to the positive terminal then becomes 'unipolar' and can be placed anywhere on the body. Wilson defined the unipolar limb leads VR, VL and VF where ―V‖ stood for voltage (the voltage seen at the site of the unipolar electrode). In 1942 Emanuel Goldberger increased the voltage of Wilson's unipolar leads by 50% and created the augmented limb leads aVR, aVL and aVF. When added to Einthoven's three limb leads and the six chest leads we arrive at the 12-lead electrocardiogram that is used today.
ELECTROPHYSIOLOGY
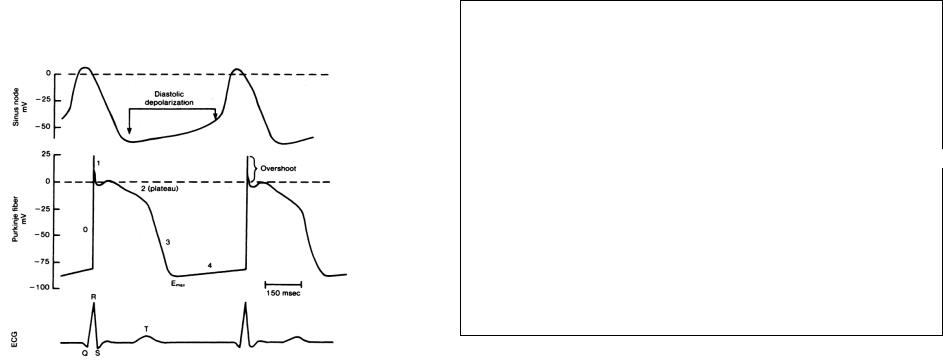
The action potential is generated by depolarization and repolarization of the muscle cell (Fig. 1). Depolarization of the heart is
10
the initiating event for cardiac contraction. The electric currents that spread through the heart are produced by three components: cardiac pacemaker cells, specialized conduction tissue, and the heart muscle itself. The ECG, however, records only the depolarization (stimulation) and repolarization (recovery) potentials generated by the atrial and ventricular myocardium. Under resting conditions, myocardial cells are polarized; that is, they carry an electric charge on their surface due to transmembrane ion concentration differences. The charge measured across atrial and ventricular cell membranes is about 90 mV, with the inside negative relative to the outside. When these cells are stimulated above a critical threshold potential, they rapidly depolarize and transiently reverse their membrane polarity. This depolarization process spreads in a wavelike manner through the atria and ventricles. The return of myocardial fibers to their original resting state occurs during repolarization.
Fig. 1. Transmembrane potentials from the sinus node (upper panel) and a Purkinje fiber (middle panel); relationship to the ECG (the lower panel). [From Singn BN et al. Prog Cardiovasc Dis 22:243, 1980].
11
You can see the process of action potential generation at the Fig. 1 (middle panel). If an electrical stimulus is applied, the membrane becomes very permeable to sodium ions, which rapidly leak into the cell (phase 0). The membrane is thus depolarized (loses its negative charge) and, in fact, is transiently positively charged (overshoot). Repolarization occurs relatively slowly as chloride (phase 1), calcium ions (phase 2), and then potassium ions (phase 3) move back into the cell and thereby restore the resting potential (phase 4) (Fig. 1).
In the heart the phases of rapid depolarization and overshoot correspond to the QRS complex of the ECG; phase 2 corresponds to the ST-segment; and phase 3, to the T-wave (Fig. 1, the lower panel).
REMEMBER:
1.Resting cardiac cell is polarized - INTERIOR is NEGATIVE 90 mV relative by exterior.
2.Application of electrical current to cardiac cell causes DEPOLARIZATION: Rapid influx of Na+.
3.Depolarization of one cell triggers depolarization of adjacent cells. A DEPOLARIZATION wave front (advancing wave of positive charge) passes along all connected, living cells (but does not pass along scar or other non-cardiac tissues).
4.The ECG machine is a STRING galvanometer that records changes of potential difference (ie. a passing depolarization wave front or current).
5.The ECG machine records from skin electrodes the small (milliVolt) electrical signals generated by the heart, amplifies them and, by a recording pen attached to the galvanometer, records them on paper. Each deflection of the pen is proportional to the instantaneous amplitude of the cardiac electrical signal. By moving the recording paper under the pen, a plot of cardiac wave form AMPLITUDE vs. TIME is generated. This is the ECG.
The depolarization stimulus for the normal heartbeat originates in the sinoatrial (SA) node or sinus node, a collection of pacemaker cells (Fig. 2). These cells fire spontaneously; that is, they exhibit automaticity. The first phase of cardiac electrical activation is the spread of the depolarization wave through the right and left atria, followed by
12
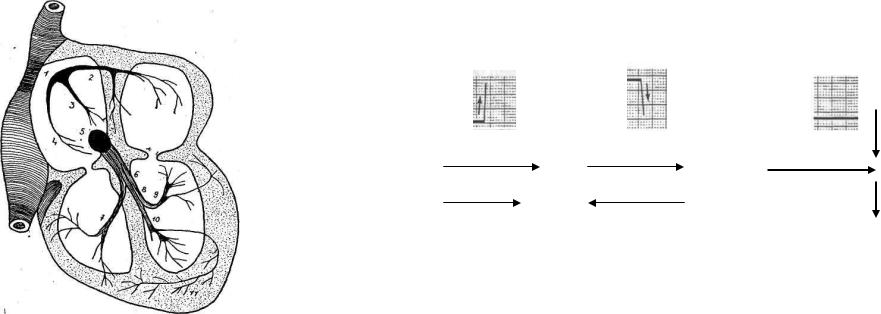
atrial contraction. Next, the impulse stimulates pacemaker and specialized conduction tissues in the atrioventricular (AV) nodal and His-bundle areas; together, these two regions constitute the AV junction. The bundle of His bifurcates into two main branches, the right and left bundles, which rapidly transmit depolarization wave fronts to the right and left ventricular myocardium by way of Purkinje fibers. The main left bundle bifurcates into two primary subdivisions, a left anterior fascicle and a left posterior fascicle. The depolarization wave fronts then spread through the ventricular wall, from the endocardium to the epicardium, triggering ventricular contraction.
Fig. 2. Schematic of the cardiac conduction system.
1 - Sinoatrial node; 2 - Bachman’s anterior tract; 3 - Venkebach’s middle tract;
4 - Torel’s posterior tract; 5 - Atrioventricular node; 6 - the common trunk of His bundle; 7 – Right bundle branch; 8 - Left bundle branch;
9 - Anterosuperior (anterior) branch of the left bundle branch; 10 - Posterior inferior (posterior) branch of the left bundle branch; 11 - Purkinje fibers.
13
Since the cardiac depolarization and repolarization waves have direction and magnitude, they can be represented by vectors. The general principles of vector analysis remain fundamental to understanding the genesis of normal and pathologic ECG waveforms.
Each ECG electrode has a positive and negative pole. By convention, the following deflections occur (Fig. 3):
1.A depolarization (positive) wave moving parallel to and toward the positive pole of the ECG electrode causes an upward deflection on the ECG paper (Fig.3, A).
2.A depolarization (positive) wave moving parallel to but away from the positive pole of the ECG electrode causes a downward deflection on the ECG paper (Fig. 3, B).
3.A depolarization (positive) wave oriented perpendicular to the positive pole of the ECG electrode causes no deflection on the ECG paper (Fig. 3, C).
Axis of ECG lead |
|
|
Axis of ECG lead |
|
Axis of ECG lead |
- |
+ |
- |
+ |
- |
+ |
Vector of current flow |
|
|
|
|
|
A |
|
|
B |
|
C |
|
|
Fig. 3. Deflections on the ECG-paper |
|||
A – if current flows in the same direction as the axis of lead, ECG stylus is deflected strongly upward from baseline in that lead. B – if current flow is in the opposite direction to the axis of lead, stylus is deflected strongly downward. C – If current flow is perpendicular, either toward or away from the axis of lead, there is no deflection, either up or down, of stylus.
Vector analysis illustrates a central concept of electrocardiography that the ECG records the complex spatial and temporal summation of electrical potentials from multiple myocardial fibers conducted to the surface of the body.
14
This principle accounts for inherent limitations in both ECG sensitivity (activity from certain cardiac regions may be cancelled out or may be too weak to be recorded) and specificity (the same vectorial sum can result from either a selective gain or a loss of forces in opposite directions).
PERFORMING THE ELECTROCARDIOGRAPHIC TEST
Electrocardiography should be carried out in a warm quiet room. A patient is laid on the back and asked to relax muscles, stretch the hands along the trunk and breathe calmly, not deeply. Trembling of the body distorts the electrocardiogram.
In order to decrease skin resistance, it is necessary to apply a small amount of special electrode jelly to the skin before attaching the electrode. This should be well massaged in, and should cover an area only very slightly larger than that of the electrode itself. It can subsequently be wiped off. Otherwise gauze layings between an electrode and the body surface moistened in a physiologic solution can be used.
Suitable sites for attachment of the limb electrodes are the medial aspects of the wrists and the outer sides of the legs just above the ankles. The rubber straps supplied for holding them in position should be adjusted to give firm, even contact, but must not be excessively tight.
Chest electrodes are now usually of the suction type, though alternative patterns for strapping or manually holding in position are also available. It is absolutely essential that electrode jelly be applied only to the immediate area of contact with the chest wall, and that all traces of jelly be removed from the other chest lead sites. If these conditions are not observed, considerable distortion of the recorded patterns can result.
In usual ECG examination the recording is carried out in 12 leads – 6 from the extremities (limbs) (standard and augmented leads) and 6 chest leads; not less than 4 ECG complexes are fixed in every lead. In disturbance of cardiac rhythm and conductivity the larger amount of complexes should be fixed. Remember to obtain a rhythm strip. The rhythm strip is usually done with lead II or V2.
15
Under normal conditions, ECG recordings are standardized so that a vertical deflection of 10 mm (i.e. two large divisions) represents a potential of one millivolt. A switch on the machine allows a signal of 1 mV to deflect the recording needle, and operation of the sensitivity control will then adjust the travel of the needle to the desired 10 mm. Standardisation should always be carried out before an ECG is recorded, so that the amplitude of the tracing can be correctly interpreted. When exceptional conditions (e.g. very large voltages) necessitate recording at other than standard sensitivity, this fact should be clearly indicated on the tracing.
The paper used in standard direct-writing machines is calibrated in both vertical and horizontal directions by lines at millimetre intervals with thicker lines every 5 mm. The paper is run at a standard speed of 50 mm per second, so that each small division on the horizontal or time scale represents 0,02 second and each larger division 0,1 second.
ECG LEADS
The electrocardiogram can be written down by attaching the electrodes on two points of the human body which are at some distance from each other, excepting isopotential points, i.e. points with identical potentials. However it was more convenient to use certain points giving the most informative data. Use of these points allowed to unify the method of the electrocardiogram registration. Registration of an electrocardiogram is performed with the help of different leads.
The line, connecting two points of electrodes application was named a lead axis. In an electrocardiographic lead the polarity, i.e. the direction of current on an lead axis, is maid out. It is considered that the positive pole is the pole having the greater potential. It is connected with the anode (+) of the electrocardiograph. Therefore in case of direction of summary total vector to "+" leads on the electrocardiogram a positive wave is registered, and at a return direction of vector – a negative one.
Standard leads. The founder of the electrocardiograms leads development is Eintchoven, who relatively presented a human body as a spherical formation, in the centre of which there is the working heart creating the electric field. He offered to lead heart biopotentials from the
16
extremities, imagining both hands and the left leg as corners of the lateral triangle formed at mental frontal slit through the human body. This schematic triangle later received the name of the Eintchovens triangle (Fig. 4). With its help it is possible to get more clear notion concerning the genesis of the electrocardiogram leads.
Rt arm |
Lt arm |
Lt leg
Fig. 4. Eintchovens triangle
Each lead of the ECG ―views‖ the heart from a different perspective. Though any single lead may allow determination of the heart rate and rhythm, analysis of multiple leads provides more comprehensive information. For clinical purposes, the routine ECG is recorded by attaching 10 electrodes to the body (one to each limb, 6 on the chest) to form 12 ECG leads.
To record limb leads the electrodes are applied to the extremities. To achieve better ECG recording and avoid errors coloured marking of electrodes is used according to the light signal principle: electrode attached to the right arm (in the forearm area) is of the red colour, to the left arm (in the forearm area) is of the yellow colour, to the left leg (in the shin area) is of the green colour; to the right leg (in the shin region) black electrode is attached. The right leg electrode functions as a ground and doesn’t affect the character of electric signals recorded by the ECG.
17
The 12 conventional ECG leads record the difference in the potential between electrodes placed on the surface of the body. These leads are divided into two groups: six extremity (limb) leads and six chest (precordial) leads (Fig. 5). The extremity leads record potentials transmitted onto the frontal plane, and the chest leads record potentials transmitted onto the horizontal plane.
The six extremity leads are further subdivided into three standard - bipolar - leads (I, II, and III) and three augmented - unipolar - leads (aVR, aVL, and aVF).
Each bipolar lead measures the difference in the potential between electrodes at two extremities: a) lead I: Rt arm (-) Lt Arm (+),
b)lead II: Rt arm (-) Lt Leg (+),
c)lead III: Lt arm (-) Lt Leg (+).
ATTENTION: the right arm is always connected with the negative pole of the galvanometer, the left leg is always connected with the positive pole of the galvanometer while the left arm can be connected both with the positive pole of the galvanometer (I lead), and the negative one (III lead).
The unipolar leads as well as the standard ones record the difference in the potentials between two points of the body located in the front plane. In the augmented leads one electrode is indifferent that has approximately zero potential (its potential is near to zero), it is attached to the negative pole of the galvanometer; the second – active electrode, is attached to the positive pole of the galvanometer.
The augmented leads are designated by letter symbols, where lowercase ―a‖ (from ―augmented‖) indicates that these unipolar potentials are electrically augmented by 50 percent, V – for the physical symbol of voltage, while the letters R, L, F are for right, left, and foot correspondingly:
a)aVR: Rt Arm (+),
b)aVL: Lt Arm (+),
c)aVF: Lt Leg (+). Other limbs serve as common ground.

18 |
19 |
Fig. 5. ECG-leads.
1- Standard Limb Leads
2- Augmented Limb Leads
3а – Unipolar chest (precordial) leads (position of the exploring electrode) 3b – Axes of the chest leads in the horizontal plane
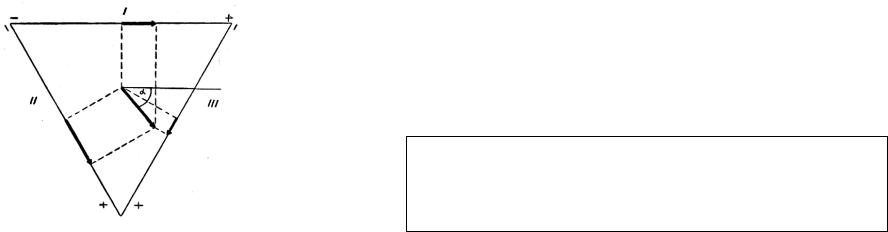
The spatial orientation and polarity of the six frontal plane leads is represented on the hexaxial diagram (Fig. 6). Each ECG lead has a specific spatial orientation and polarity. The positive pole of each lead axis (solid line) and negative pole (hatched line) are designated by their angular position relative to the positive pole of lead I (0 ). The mean electrical axis of the QRS complex is measured with respect to this display.
Fig. 6. Hexaxial diagram
(ПР – right arm, ЛР – left arm).
In recording the chest leads the indifferent electrode is attached to the negative pole of the galvanometer and the active electrode connected with the positive pole of the galvanometer is placed on the different points of the chest. The chest leads are designated by the letter V (the physical symbol of voltage): V1, V2, V3, V4, V5, V6, etc.
The six chest leads (Fig. 5-3a) are unipolar recordings obtained by electrodes in the following positions:
a) V1 - fourth intercostal space (ICS), just to the right of the sternum;
b)V2 - fourth ICS, just to the left of the sternum;
c)V3 - midway between V2 & V4;
d)V4 - midclavicular line (MCL), fifth ICS;
e)V5 - anterior axillary line (AAL), the same level as V4;
f)V6 - midaxillary line (MAL), the same level as V4 and V5.
Sometimes other leads are recorded: V7 (the crossing place of the same horizontal line as for V4, V5, V6 with the left posterior axillary line), V8 (the crossing place of the same horizontal line with the scapular line), V9 (the crossing place of the same horizontal line with the paravertebral one).
Conditionally (!) V1, V2 leads are referred to the so called ―right‖ chest leads, V5, V6 – to the ―left‖ chest leads, and V3,V4 are called ―the transitional zone‖. It is very useful in the assessment of the state of the